What are the key features to look for in an APM Tool?
Application performance monitoring helps you map the various aspects of your application's complexities to better understand how the application works. When selecting an APM tool for your monitoring purposes, look for these basic features:
Topology Maps
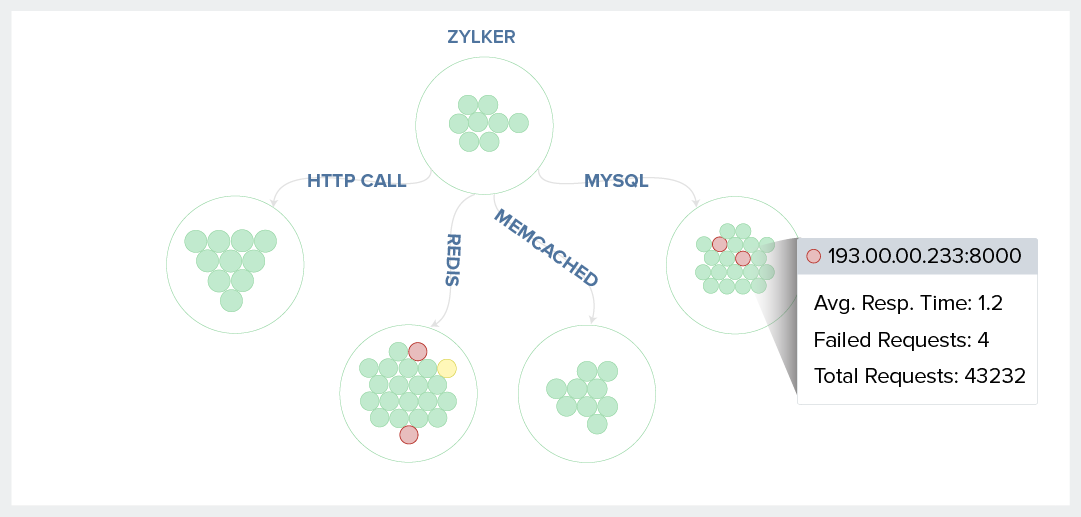
Applications often rely on external resources for tasks like caching, database updates, or interacting with services like payment gateways. Application dependency mapping helps DevOps and IT teams quickly identify and resolve bottlenecks.
Key Transactions
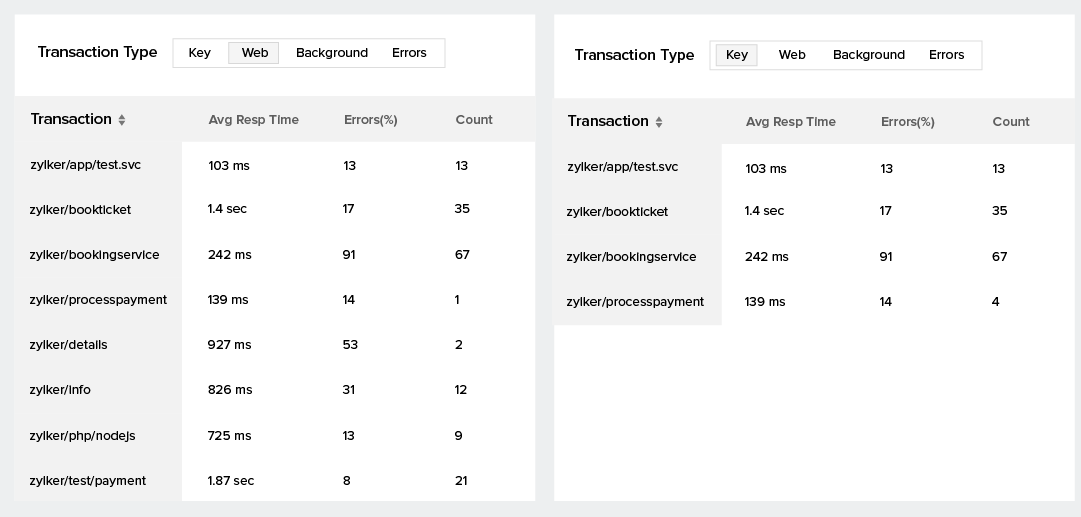
Monitor the performance of business-critical transactions at a glance by labeling them as key transactions. Doing so enables you to save time searching for transactions and helps you debug and analyze them with ease.
Distributed Tracing
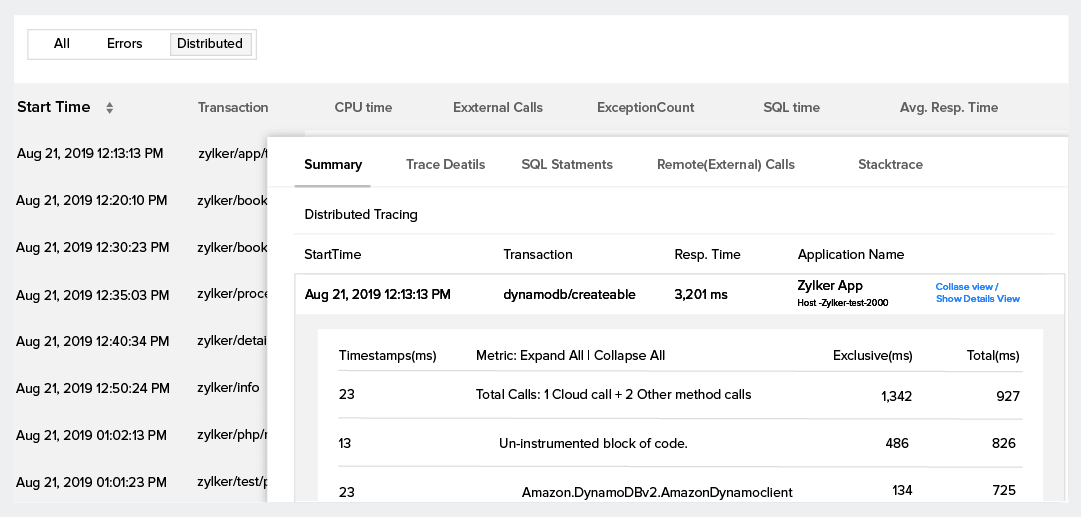
With distributed tracing, you can track transaction traces made from one application to another. This enables you to monitor calls made between applications and isolate problems.
Error Analytics
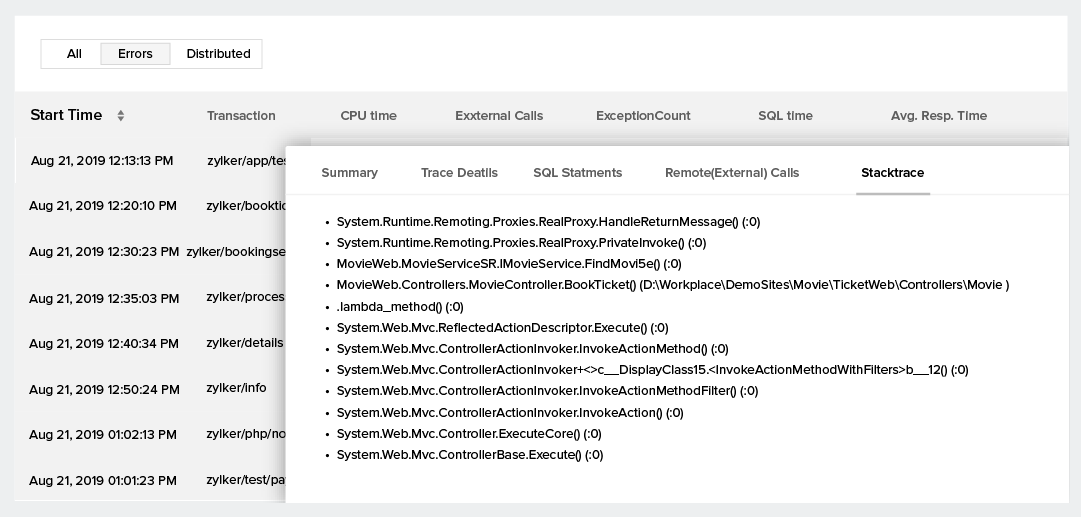
Knowing when and how frequently errors happen in an application enables organizations to develop crucial strategies to build more robust products and make the user experience more seamless.
Custom Metrics
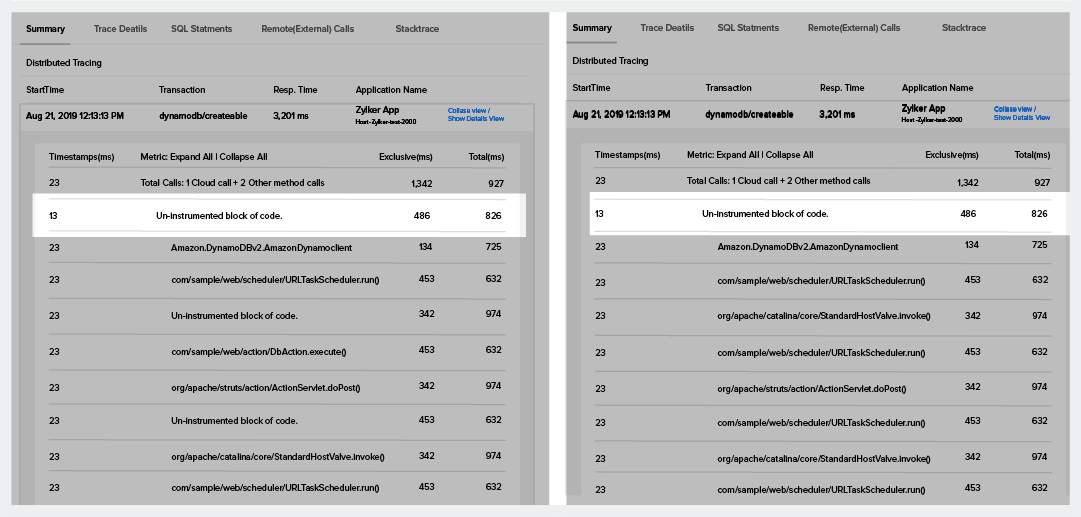
Enabling developers to customize application-specific metrics ensures they can evaluate performance bottlenecks and tweak the existing codebase.
Milestone Markers
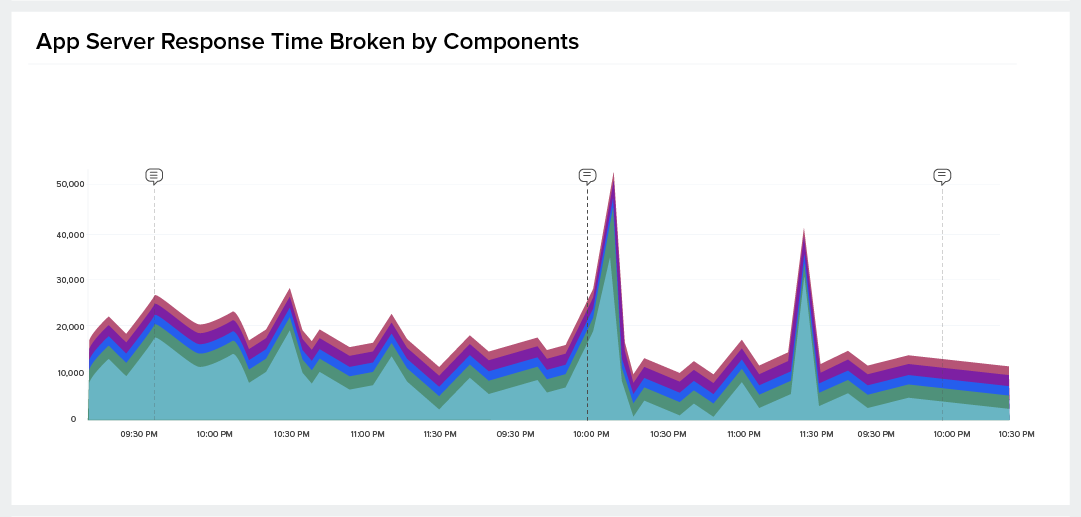
Milestone markers help you record significant events in your application’s life cycle, like build deployments, product updates, feature enhancements, and infrastructure upgrades.
Rule-based Alerting
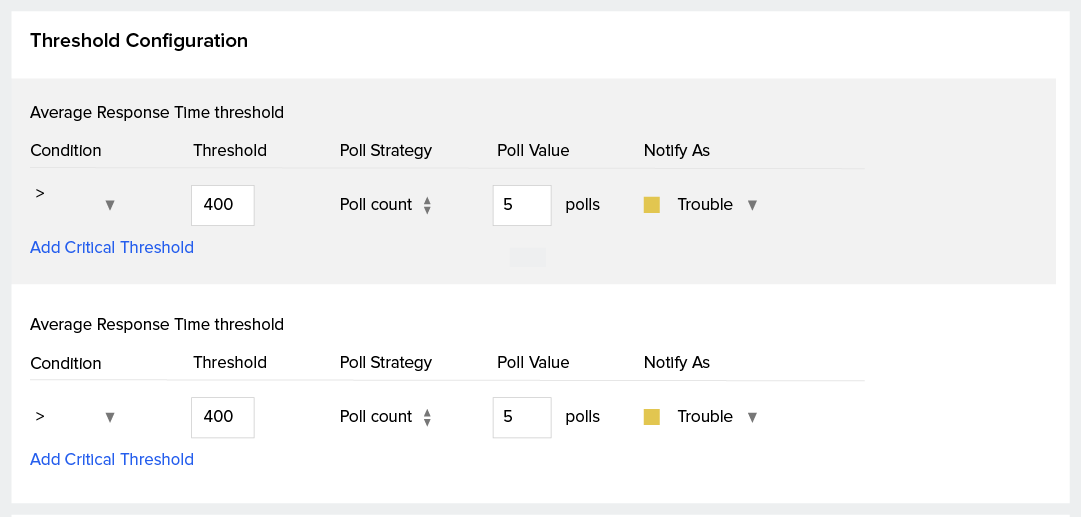
With a continuous monitoring solution offloading most of the operations-related worries, alerting is just the icing on the cake. DevOps teams can set up rules to receive alerts during an irregularity, freeing up their time to manage other day-to-day operations since they won’t have to constantly check on the metrics.
AI for Anomaly Detection
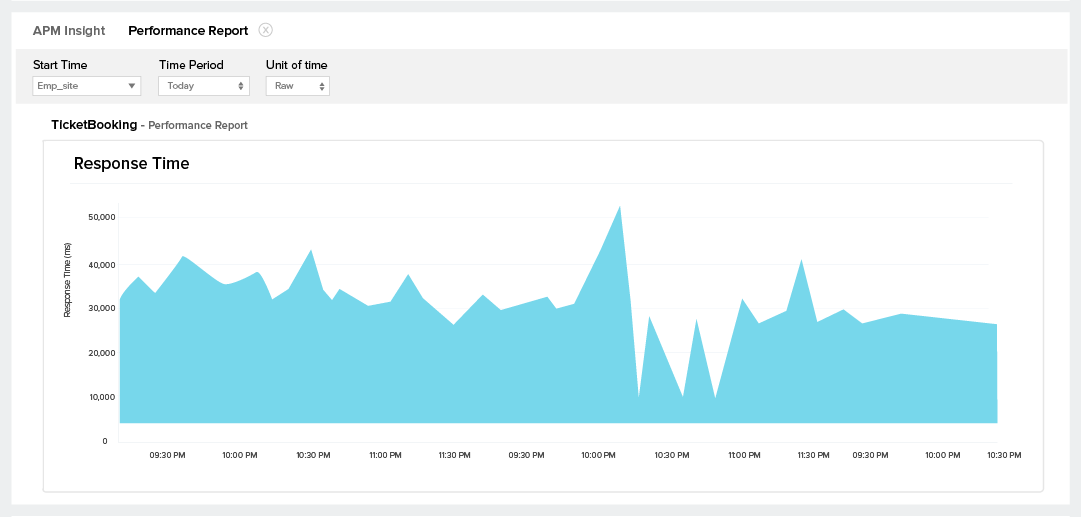
The idea behind anomaly detection is to uncover any abnormal spikes in an application's critical performance attributes. An anomaly is triggered when a KPI falls below or exceeds the previously benchmarked values. This helps you handle unforeseen issues that could have a big impact later.
Key APM metrics
Measuring application performance goes beyond application availability and responsiveness. It is crucial to establish a baseline for key parameters, as this helps you detect application degradation or anomalies. To begin, measure your application performance with these KPIs:
- Are there any seasonal patterns in response time or throughput?
- Did the latest update affect your application performance?

- Does your average response time vary in relation to throughput?
- Have you defined how fast your application should run?
- How do response time and throughput affect your user experience?

- How often does your application crash?
- Does it happen sporadically or does it occur frequently?
- Can you trace the exact root cause via logs?

- Do you have a good understanding of how your application connects and communicates with all other internal and third-party services?
- How do external components affect your application performance?

- Can your servers handle the increasing traffic, or do you need to scale them?
- Are your application services up and available 24x7?
- If not, have you identified the cause of application downtime?


Who uses APM monitoring tools?
An APM tool can alert DevOps teams immediately when an application behaves erratically. These continuous monitoring solutions provide key insights on errors, including stacktraces, and enable DevOps to take further actions during an emergency, like applying a quick patch, running an automation script, or reporting details to the concerned teams.
APM tools track performance metrics over time and offer quick snapshots of intensive operations, helping teams spot areas for improvement. They provide a comprehensive view of application topology, enabling swift identification of issues and faster response through alerting and anomaly detection.
APM supports site reliability engineers (SREs) by offering real-time performance insights and telemetry data, diagnosing issues, optimizing system reliability, and improving incident response. It tracks metrics, predicts demand spikes, and scales infrastructure effectively using actionable data and alerts. This enables quick issue resolution, proactive management, and consistent performance.
Ensuring that a new update enhances response time, or deciding to revert to an earlier build, requires a comparison of key metrics before and after deployment. APM tools with options to mark significant infrastructure updates as milestones and compare reports make this a breeze.
APM eliminates the need for developers to manually gather key environmental details required to simulate and fix an issue. These tools capture the entire application context in depth, including stacktraces, session details, calls to databases, and other dependent components. APM tools even provide APIs for developers to define their own application-specific metrics.
Challenges in application performance monitoring
Modern applications are dynamic, distributed, and complex, making APM a challenge—but that shouldn’t slow you down. Here are the major hurdles businesses face:
Lack of full-stack visibility
Monitoring across microservices, containers, and hybrid cloud environments requires deep observability.
Massive data overload
Logs, metrics, and traces generate floods of data, making it difficult to extract actionable insights.
Alert fatigue overwhelms IT teams
Excessive alerts without intelligent filtering overwhelm IT teams, leading to missed critical incidents.
Lack of flexibility and customization
Every application is unique, but rigid monitoring solutions don’t always adapt to specific business needs.
So, how can businesses overcome these challenges? That’s where a powerful APM solution makes all the difference.
How application performance monitoring works?
Application monitoring is the key to proactively detecting and resolving performance issues before they impact end users. Site24x7 simplifies this process with agent-based monitoring, distributed tracing, and AI-powered analytics—ensuring your applications run smoothly at all times. Here’s how it works:
Data collection
APM gathers logs, traces, and metrics.
Performance analysis
Identify slow transactions and bottlenecks.
Intelligent alerting and troubleshooting
Detect anomalies with AI and notify teams automatically.
Continuous optimization
Fine-tune performance and optimize resources.
Why do businesses need APM?
Businesses need APM because it provides real-time performance insights crucial for maintaining a competitive edge in the digital era. APM helps reduce mean time to resolution (MTTR) through baseline performance monitoring, automated alerting, and root cause analysis. It breaks down operational silos, particularly in complex multi-cloud environments, by aligning IT with business objectives and thereby enhancing the user experience. As APM solutions evolve with advancements like observability and OpenTelemetry, they help businesses meet and exceed customer expectations while prioritizing issues that impact key business outcomes.
What can an APM solution do for you?
Reduction in response time
Reduced DB calls
Reduced calls to external components
Optimization in SQL queries
Reduced exceptions
APM best practices to improve application performance
- Ensure compatibility with your application’s architecture and tech stack.
- Define critical performance metrics for monitoring.
- Evaluate real-time monitoring and alerting capabilities.
- Assess digital experience monitoring, including RUM support.
- Confirm scalability and integration with DevOps workflows.
Start monitoring the performance of your applications for free
Struggling with slow applications, but hesitant to invest before testing the solution? Sign up for a free, 30-day trial to experience the monitoring benefits firsthand.
Start for free, scale when ready.

