Troubleshooting website connection failures with website monitoring RCA
 Searching in dark for a solution to resolve website connection failures?
Website connection failures are the most disruptive problems in web operations—not just because of the immediate revenue impact, but because of the silence that follows the alert. Downtimes drain the budgetAnd yet, the hardest part isn't the outage itself. It's the frantic, tool-switching detective work that follows: Was it DNS? A firewall rule? A routing failure? A crashed service? The answer could be any of these—and without the right diagnostic, you're searching in the dark.
Site24x7's Root Cause Analysis (RCA) feature turns the lights on. The moment your website monitor reports a Down status, RCA fires automatically—running ping analysis, checking DNS resolution, tracing the network path hop by hop, and pulling it all into a single report that tells you not just that something broke, but exactly what and where.
Understanding what a connection failure actually means
A connection failure means the monitoring station couldn't establish a connection to your website at all. The site isn't slow—it's unreachable. And the error message your users see is the first clue about which layer of the stack gave way.
"Connection Timed Out" points to the network or firewall layer—a packet that was sent but never acknowledged. "Connection Refused" means the server is reachable but actively rejecting the connection, which typically signals a crashed service or a misconfigured port. "SSL Handshake Failed" means the TCP connection was established but the encryption negotiation fell apart—usually a certificate issue or a TLS misconfiguration.
These three error types map to three disparate investigations. The RCA report's failure screenshot captures exactly which one you're dealing with before you've run a single command.
Working through the RCA report, step by step
Start with scope: Is this global or regional?
Once you log in to Site24x7, navigate to the Outages tab in the Monitor Details page, and click View RCA. The first thing to examine is the location-wise breakdown. If all monitoring locations are reporting the failure simultaneously, you're looking at a server-side or DNS-level problem—something that affects everyone, everywhere. If the failure is isolated to one region, you're likely dealing with a regional routing issue or an ISP-specific connectivity failure, which narrows your investigation considerably before you've touched a single tool.
Check DNS resolution across locations
DNS failures are one of the most common—and most quietly disruptive—causes of connection issues. They're easy to miss because browser caching can mask them from users while non-caching monitoring stations surface them reliably. The RCA report checks whether your domain resolved to the correct IP address from all monitoring locations. A mismatch here—especially after a recent DNS record change, a domain migration, or a TTL adjustment—explains exactly why some users can reach your site while monitoring stations report a failure. Cross-reference the resolved IP against your expected server IP; if they don't match, you've found your culprit.
Read the ping data for packet loss
The ping analysis in your RCA report measures packet loss and round-trip response time to your server. Complete packet loss—100%— confirms the server is fully unreachable at the network layer. Partial loss, say 30% to 50%, tells a different story: network instability that may be causing intermittent connection failures rather than a clean, consistent outage. That distinction matters because the fix for total unreachability looks very different from the fix for a flapping network path.
Follow the TCP traceroute to the breaking point
Think of the TCP traceroute as a breadcrumb trail from the monitoring station to your server. The RCA report maps each hop along the path and shows where the trail goes cold. The last hop that received a response is the last point where your connection was alive—everything beyond it is where the failure lives.
If the trail ends in the first few hops, the issue is close to the monitoring station's local network. If it ends near the final hops, the problem is near your server—check your firewall rules, your hosting provider's status page, or your server's network configuration. This single piece of information can turn a vague "something is wrong" into a precise "the connection is failing at this specific node in the path."
Add time to the picture with the MTR report
A static traceroute gives you a snapshot. The My Traceroute (MTR) report gives you a film. By running continuously and polling each hop repeatedly, MTR builds a picture of how latency and packet loss shift over time across the network path. If a specific hop consistently shows high packet loss across multiple MTR cycles, that node is the problem. If the loss appears in one snapshot but not the next, you're dealing with transient congestion rather than a hard failure—which changes both the urgency and the appropriate response.
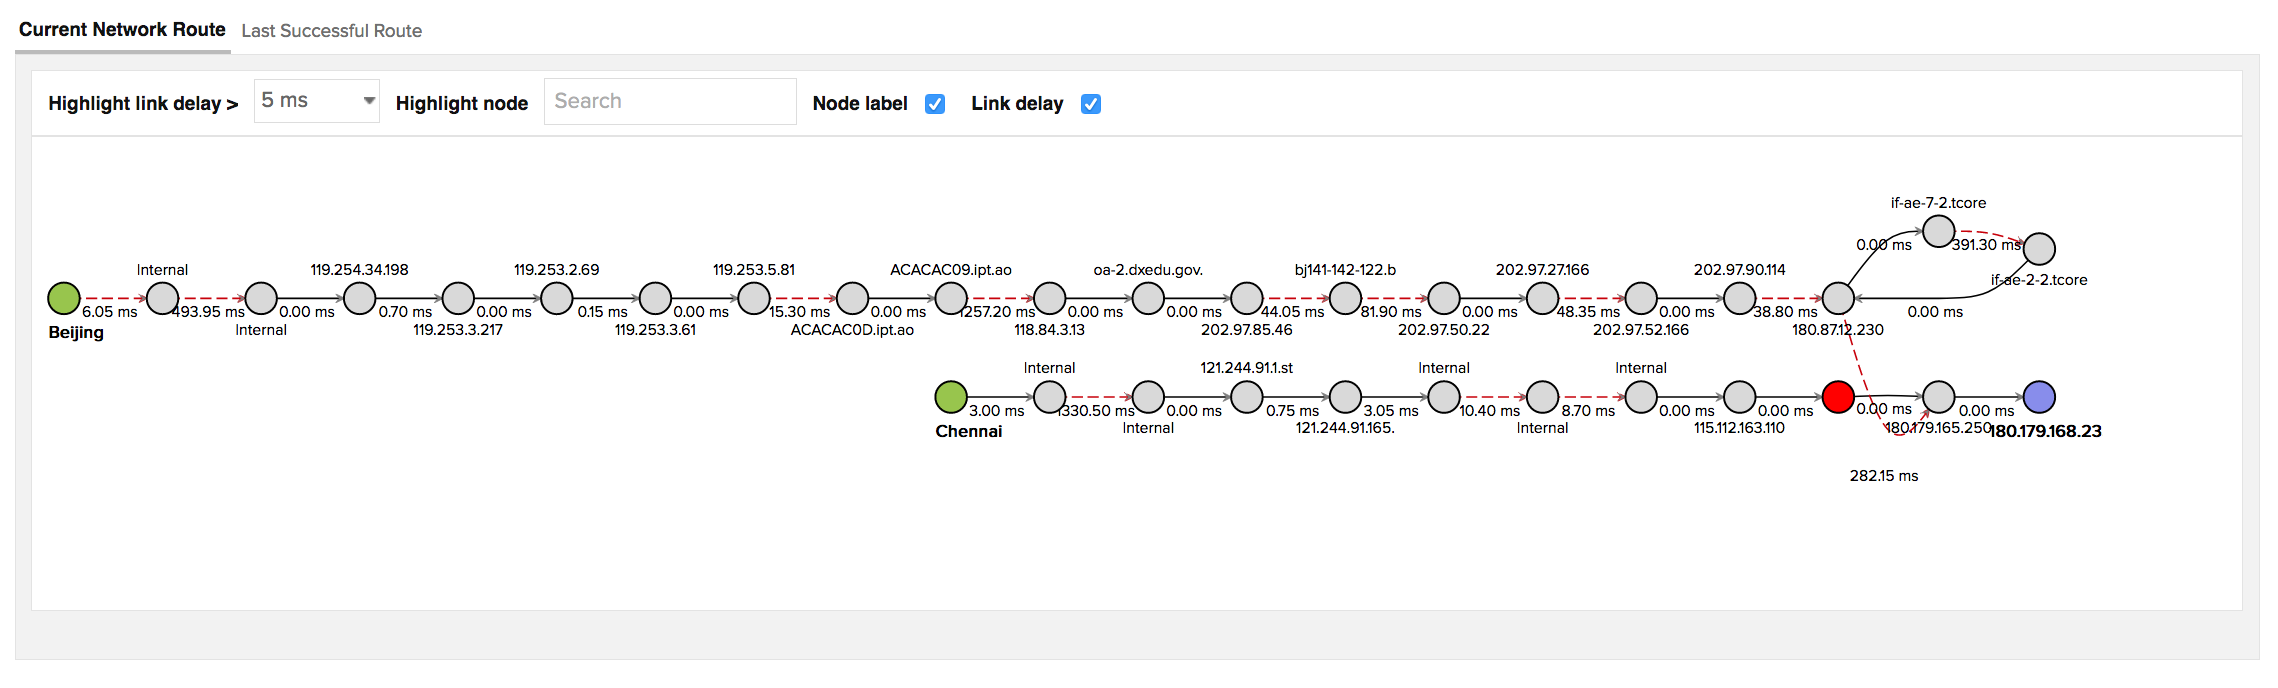
The MTR-based Network Route Map within the RCA report visualizes this as a color-coded path diagram. When you need to escalate to your ISP or hosting provider, this map is your evidence—specific, timestamped, and impossible to argue with.
 traceroute
Confirm your fix with Poll Now
Once you've applied a change—restarted a crashed service, updated a DNS record, adjusted a firewall rule, renewed a certificate—don't wait for the next scheduled poll to confirm it worked. Poll Now triggers an immediate check from all configured monitoring locations and returns a report that includes SSL/TLS handshake details, cipher suite information, HTTP request and response headers, and a fresh traceroute. If the connection has been restored, you'll know within seconds. Poll Now reports are valid for 24 hours from the time they're generated.
 Poll Now report to drill deep into granular details
The difference between a real outage and a false alarm
Not every Down alert represents a genuine outage. Network hiccups, transient routing anomalies, and momentary packet loss can all trigger a primary monitoring location to flag a failure—only for the issue to resolve itself seconds later.
Site24x7 handles this by rechecking from secondary monitoring locations after the primary location detects a failure. If multiple independent locations confirm the problem, the monitor is declared Down and the RCA report is triggered. If the secondary checks come back clean, the event is treated as a transient anomaly rather than a genuine outage. This two-step confirmation is what keeps your on-call rotation from being woken up over a blip that fixed itself before anyone could investigate.
From red to resolved
A website connection failure is the loudest alarm in web operations. But loud doesn't have to mean long. The teams that close incidents fastest aren't necessarily the ones with the most engineers—they're the ones who know exactly where to look the moment the alert fires.
Site24x7's RCA gives you that clarity when you do website downtime diagnosis. The screenshot names the error. The DNS check finds the mismatch. The traceroute marks the breaking point. The MTR report shows whether it's persistent or transient. And Poll Now tells you the moment you're back.
Would you like to explore more? Here are my suggestions, try signing up for our 30-day free trial for website monitoring or take a look at our features to learn how to assess the performance of your digital services from a user perspective.
Frequently asked questions
What is a website connection failure?
A website connection failure occurs when a client—whether a user's browser or a monitoring station—is completely unable to establish a connection to your web server. Unlike slow page loads, which indicate performance degradation, a connection failure means the site is entirely unreachable. Common causes include DNS resolution failures, network routing issues, firewall blocks, server crashes, and SSL/TLS misconfigurations. Each failure type surfaces a different error message, and each points to a different layer of your infrastructure as the source of the problem.
What is root cause analysis in website monitoring?
Root cause analysis (RCA) in website monitoring is an automated diagnostic process that triggers when a monitor detects a Down or Trouble status. Rather than simply alerting you that something is wrong, RCA collects and correlates data from multiple sources—DNS resolution checks, ping analysis, TCP traceroutes, MTR reports, and SSL/TLS inspection—and assembles it into a structured report. The goal is to answer three questions in one place: what failed, where it failed, and why. In Site24x7, RCA fires automatically without any manual trigger and is available within 150 seconds of the initial failure detection.
How does Site24x7 detect if a website is really down?
Site24x7 uses a two-step confirmation process to distinguish genuine outages from transient blips. When a primary monitoring location detects a failure, Site24x7 automatically rechecks from secondary monitoring locations before declaring the monitor Down. If multiple independent locations confirm the failure, the monitor status is set to Down and RCA is triggered. If the secondary checks come back clean, the event is logged as a transient anomaly and your on-call team is not alerted. This prevents false alarms caused by momentary network hiccups or local routing anomalies that resolve themselves within seconds.
What does "Connection Timed Out" mean in Site24x7?
A "Connection Timed Out" error in Site24x7 means the monitoring station sent a connection request to your server but received no acknowledgment within the expected time window. It indicates a network- or firewall-layer problem—the server may be unreachable due to a routing failure, a firewall rule blocking traffic, or the server being completely offline.The RCA failure screenshot captures the specific error type so you know which investigation path to take immediately.
How do I use Poll Now in Site24x7?
What is MTR and how does it help diagnose network issues?
How do I read a traceroute in Site24x7 RCA?
Can Site24x7 RCA distinguish between a server failure and a network routing issue?