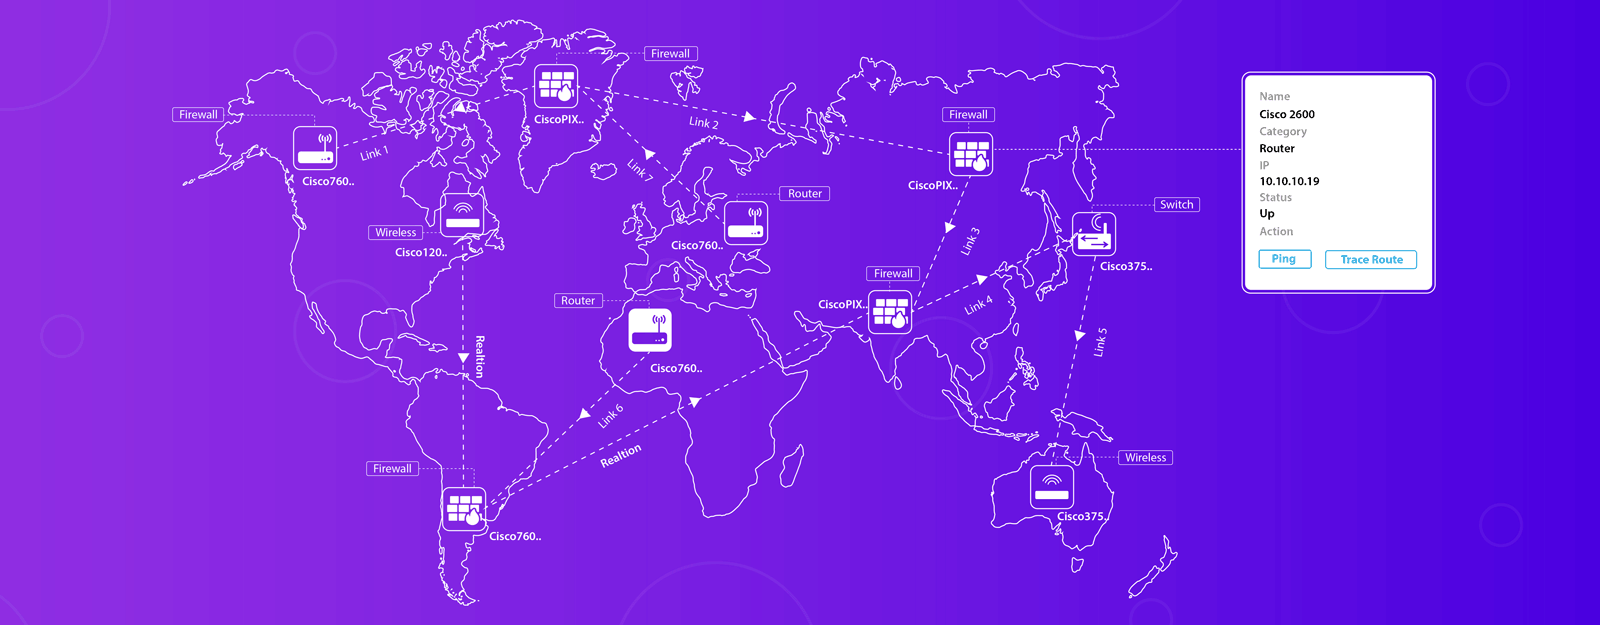
Breaking down network complexities with network mapping
Is it possible for network engineers to gain complete visibility over all the components in an enterprise network? With new devices constantly connecting and disconnecting, creating a mental image of the entire network is impossible.
This is where network mapping comes in. Using Simple Network Management Protocol (SNMP), you can see a v...
Mobile APM best practices to ensure top user experiences
Whether you are a solopreneur or the owner of a large business, think about the instances on your website or app when customers feel irritated, stuck, or frustrated on their mobile screens. Be it an app slowdown, broken flow, or irregular functionality, a mobile application performance issue can make or mar a business's reputation quicker...
Demystifying the cloud: Elasticity vs. scalability
Elasticity and scalability are essential aspects of cloud computing and crucial for optimizing resource management and ensuring seamless operations. However, despite their importance, these concepts are often confused. Understanding their distinct purposes and functionalities is essential for fully leveraging the power of cloud technology.
...
Leveraging observability to improve digital resilience
With increasing competition and a digitizing landscape, small and medium enterprises (SMEs) in Australia are being forced to level up their game using AI and modernization. This means eventually relying on cloud and AI integration to ensure agility and responsiveness.
The diversity of applications and the complexity of tech architecture pose cha...
CMDB monitoring integration: Benefits and best practices
For decades, IT organizations have benefited from the configuration management database (CMDB) as a cornerstone of IT service management (ITSM), helping ensure a resilient and reliable IT ecosystem. Though difficult to implement and even more difficult to maintain, a well-kept CMDB, whether manual or automated, serves as the canonical source of ...
What is cloud TCO? How does cloud monitoring help lower your cloud TCO?
The cloud promises agility, innovation, and virtually endless scalability. However, with great scalability comes great costs that can spiral out of control without proper oversight. Factors like over-provisioning, underutilized resources, and unexpected data transfer fees can strain budgets and reduce the overall efficiency of cloud investments....
Securing your cloud castle: Effective Amazon VPC monitoring with Site24x7
In the realm of modern business, the cloud reigns supreme. Countless organizations rely on cloud infrastructures for core operations, from storing sensitive data to running critical applications. However, with this reliance comes a vital responsibility: safeguarding your cloud environment against ever-evolving security threats.
Amazon Virtual Pr...
14 benefits of using Site24x7 in Kubernetes observability
Launched in June 2014 as an open-source container orchestration software, Kubernetes is now ten years old. Being increasingly adopted by organizations of all sizes, Kubernetes has today become an essential part of the IT landscape. Kubernetes now completes the modern IT picture, along with Linux, the cloud, and containers that form the backbone ...
Top five cloud monitoring challenges
Behind every cloud, there is exceptional monitoring. At least, there should be. However, the dynamic nature of the cloud, while its greatest strength, also poses a vulnerability by making it challenging to maintain visibility across all areas.
As the cloud becomes the backbone of many organizations' digital operations, robust and efficient monit...
Guardians of user experience: How REST API monitoring keeps your applications running smoothly
Modern web applications rely on invisible engines called REST APIs to function. These APIs handle crucial data exchanges behind the scenes, ensuring everything from login functionalities to dynamic content updates runs smoothly, handles client-server communication or communication across application services. But, just like any complex system, t...
