Memory has become cheaper and more available over the years, but that doesn’t mean developers can afford to be careless with it. Efficient memory use still matters if you are prioritizing performance, reliability, scalability, and cost. A memory-hungry application may work fine during development or small-scale testing, only to fail under real-world loads or in production environments where uptime and resource constraints matter.
One common misconception is that memory leaks are only a problem in low-level languages like C or C++. But that’s just not true. Even in high-level languages with automatic garbage collection, like Java, Python, or JavaScript, memory leaks can and do happen. They just show up in different ways and can cause different kinds of problems.
This guide goes over what memory leaks are, how they happen in different environments, what signs to look out for, and how to debug and fix them. Let’s get started!
A memory leak happens when a program holds on to memory it no longer needs and never releases it. Over time, these unused memory blocks pile up, which can slow down the system, and eventually cause the app or system to crash.
Memory leaks are a type of resource leak, which is a broader term that refers to any situation where a program does not properly free system resources such as memory, file handles, database connections, threads, or network sockets.
Back in the early days of programming, developers had to manage memory manually. In languages like C, you had to explicitly allocate memory with functions like malloc() and free it with free(). Forgetting to free memory was a common cause of memory leaks, and debugging such issues was painful.
Today, many languages come with automatic memory management through garbage collectors. These systems are designed to track which parts of memory are still in use and clean up the rest. This has made life easier, but not leak-proof.
If your code keeps references to unused objects, or holds on to listeners, caches, or closures longer than needed, the garbage collector won’t clean them up. That’s how memory leaks still happen in modern apps.
Before going into the specific causes, it helps to understand how memory is managed in most programming environments.
In most systems, memory is divided into two main areas: the stack and the heap. The stack is used for storing variables with short lifetimes, like function arguments and local variables. It follows a strict order (last in, first out) and memory is automatically cleaned up when a function exits.
The heap, on the other hand, is used for dynamically allocated memory. This is where objects, arrays, and other data structures live if they need to stick around beyond a single function call.
In high-level languages like JavaScript or Python, the garbage collector (GC) watches the heap and automatically frees memory that is no longer in use. But the GC only cleans up memory that’s unreachable. If something is still referenced, even if it’s no longer needed, the GC won’t touch it. That’s where memory leaks creep in.
With that understood, let’s look at some of the most common causes of memory leaks and how they happen in real-world code.
This happens when your code holds onto memory that it no longer needs. Maybe it's a large array, a file handle, an object, or some temporary data you forgot to clear.
let cache = {};
function loadData(key, value) {
  cache[key] = value; // never cleared
}
If this cache keeps growing and old entries are never removed, memory usage will keep going up.
If you attach event listeners to DOM elements or system resources and don’t remove them when they’re no longer needed, it can lead to leaks, especially if the element gets removed from the page but the listener stays in memory.
const button = document.getElementById('submit');
button.addEventListener('click', handleClick);
// Later, the button is removed but listener stays attached
The listener keeps a reference to the function and possibly the element, which prevents both from being garbage collected.
This is when two or more objects reference each other in a way that forms a loop. In some older garbage collectors, this would cause leaks because reference counting couldn’t detect the cycle.
function createCycle() {
  let objA = {};
  let objB = {};
  objA.ref = objB;
  objB.ref = objA;
}
Modern GCs can usually handle this, but in some cases (especially involving DOM nodes and closures), cycles can still cause problems.
If your code uses system resources like file handles or database connections, and you forget to close or release them, it’s a form of memory/resource leak.
def read_file():
  f = open('data.txt')
  data = f.read()
 # forgot to call f.close()
Even though the memory used here might be small, the number of open files can grow quickly.
Global variables are another common source of memory leaks. Since they stay alive for the entire lifetime of the app, any data stored in them will also stay in memory unless explicitly cleared.
var bigData = new Array(1000000).fill('data');
// bigData stays in memory until the page is refreshed or manually cleared
In large apps or long-running processes, uncontrolled use of global variables can slowly bloat memory usage and make leaks harder to track down.
Here are the key reasons why modern apps can’t afford to have memory leaks:
Next, let’s explore some common symptoms of memory leaks and how you can spot them:
Memory leaks often don’t cause immediate problems. Instead, the application becomes slower over time as more memory is used but never released.
You’ll notice:
If leaked memory adds up over time, the app may eventually hit system memory limits and crash or get killed by the OS.
You’ll notice:
Some leaks only show up after users perform certain actions many times, like opening and closing a modal or switching between views.
You’ll notice:
In garbage-collected languages, memory leaks can cause the GC to run more often as it tries to free up space, even if it doesn’t succeed.
You’ll notice:
Memory leaks can limit how well your app scales, especially in environments where many users or requests are served in parallel.
You’ll notice:
Memory leaks often go hand in hand with other resource leaks, especially when external objects like file handles or database connections aren't released.
You’ll notice:
Now that you know how important memory leaks are, and how they manifest, you are ready to start resolving them. Here’s a step-by-step approach that works across most languages and platforms.
The first step is to choose a memory profiling or analysis tool that fits your environment. Each language has its own ecosystem of tools designed to detect memory usage patterns and leaks.
Once you’ve selected a tool, the next step is to configure your app or environment to work with it. For example, you may:
Some tools may require you to compile with debugging symbols or run in a special mode to get accurate results.
Leaks often show up only after certain actions are repeated or the app has been running for a while. Trigger the suspected behavior while monitoring memory usage:
This helps surface leaks that only appear after repeated usage or under load.
Once the data is collected, look for signs of memory that was allocated but never released:
Focus on objects that grow over time or are still in memory long after they should be gone.
Use the stack traces or reference chains provided by the tool to pinpoint where objects are being held unnecessarily. For example, if you’re using Valgrind and you see output like this:
==1234== 20 bytes in 1 blocks are definitely lost in loss record 1 of 1
==1234== at 0x4C2FB55: malloc (vg_replace_malloc.c:299)
==1234==  by 0x4005B3: allocate_buffer (main.c:12)
==1234==  by 0x4005D1: main (main.c:25)
It means 20 bytes were allocated in allocate_buffer() at line 12 of main.c and never freed. Looking at the code:
char* allocate_buffer() {
 char* buffer = (char*)malloc(20);
 // forgot to free or return it
  return buffer;
}
int main() {
    allocate_buffer();
 return 0;
}
You can tell that the memory allocated inside allocate_buffer() is never freed, and the pointer is not stored or used later. Since nothing frees that memory, Valgrind flags it as definitely lost, a clear sign of a memory leak at this point in the code.
Once you’ve identified the leak, apply the fix:
In our previous example, the fix would be to make sure the memory allocated inside allocate_buffer() is either freed or properly returned and later freed by the caller. Here’s a corrected version of the code:
char* allocate_buffer() {
 char* buffer = (char*)malloc(20);
 return buffer;
}

int main() {
  char* data = allocate_buffer();
 // use the buffer...
    free(data);  // properly free the memory
  return 0;
}
This way, the memory is explicitly released when it's no longer needed, and Valgrind will no longer report it as leaked.
After fixing the leak, run the app again under the same conditions and compare memory usage:
Finally, here are some best practices that will help you avoid most memory leaks:
Memory leaks represent a critical class of performance issues that can silently degrade application performance, increase infrastructure costs, and ultimately impact user experience. Whether you're developing in C++, Java, Python, Node.js, or any other language, understanding the mechanisms behind memory leaks—from unreleased references and event listeners to circular dependencies and unmanaged resources—is essential for building stable, scalable applications.
The debugging process we've outlined—choosing appropriate profiling tools, reproducing issues systematically, analyzing output carefully, and validating fixes—provides a structured methodology that applies across different technology stacks. By combining proactive best practices with reactive debugging techniques, you can significantly reduce the occurrence and severity of memory-related issues in your applications.
However, manual debugging and isolated testing can only catch leaks during development. In production environments, continuous monitoring becomes essential. This is where Application Performance Monitoring (APM) and comprehensive observability solutions play a critical role. Real-time monitoring of memory consumption patterns, garbage collection behavior, heap utilization trends, and process-level metrics enables you to:
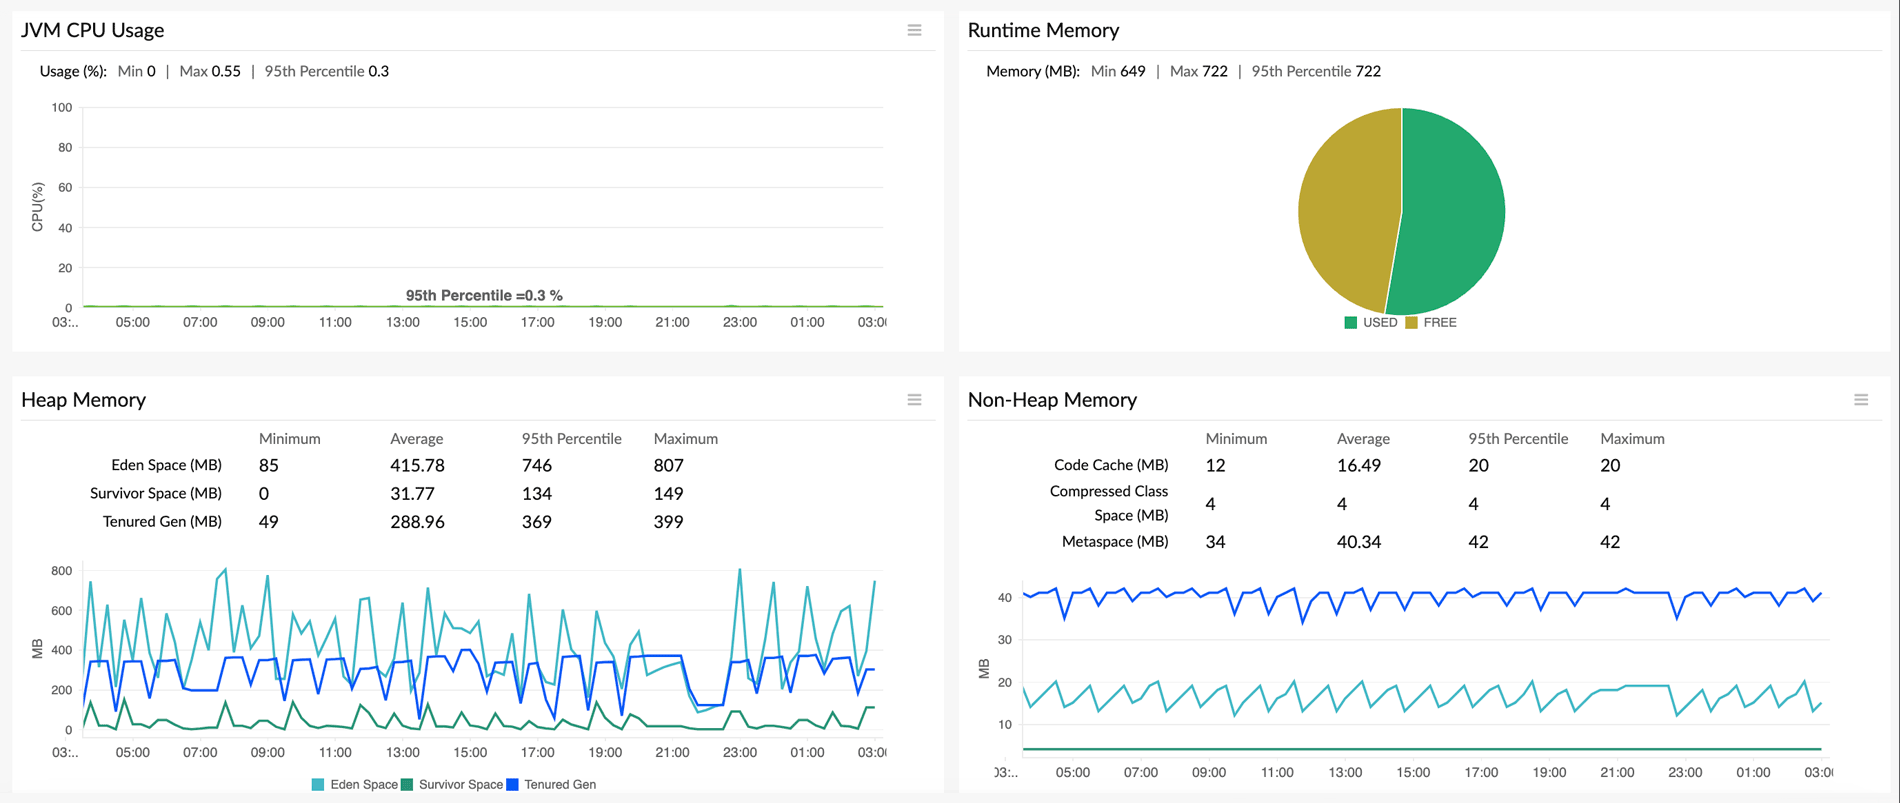
Site24x7's application performance monitoring platform provides end-to-end visibility into memory behavior across your entire stack, with dedicated language-specific solutions Site24x7's full-stack observability approach goes beyond memory metrics alone, integrating log management to correlate memory metrics with application logs for tracing leak root causes, distributed tracing to understand which transactions and code paths consume the most memory, and real user monitoring to see how memory issues manifest as latency spikes, slowdowns, or errors for actual users. By combining the debugging and prevention techniques outlined in this guide with continuous monitoring through APM, you can build applications that maintain stable memory usage throughout their lifecycle, even under production load and unexpected usage patterns.
Site24x7 Application Performance Monitoring (APM) provides real-time visibility into memory consumption, heap usage, and garbage collection activity, helping you identify anomalous memory growth before it causes crashes.
Yes, you can configure custom IT automation and threshold alerts in Site24x7 to notify your team via SMS, email, or third-party integrations when memory utilization exceeds acceptable limits.
Yes, Site24x7 offers dedicated APM agents for Java, Node.js, .NET, Python, and Ruby, allowing you to track language-specific memory metrics and perform deep dive diagnostics.