
SNMP and WMI Server Monitoring (Agentless)
Site24x7 monitors servers using the Simple Network Management Protocol (SNMP) and Windows Management Instrumentation (WMI) protocol. This type of server monitoring doesn't require any agent to be installed on your servers.
Prerequisites
When monitoring a Windows environment using the On-Premise Poller, keep the following requirements in mind:
- The On-Premise Poller must be installed on a Windows machine that is on the same network as the device being monitored. Secondary On-Premise Pollers in an On-Premise Poller Group must meet this requirement for continuous monitoring. WMI monitoring is not supported when On-Premise Pollers are installed on Linux servers.
- The Network Module must be up and running.
- WMI, RPC, and DCOM services must be enabled on both:
- The machine where the On-Premise Poller is installed
- The remote Windows devices being monitored
- For WMI-based authentication, use:
- A domain user account with administrator privileges, if the device is part of a domain.
- The local system username and password, if the device is part of a workgroup.
Configuring SNMP
- Configure SNMP on Windows
- Configure SNMP on Linux (Ubuntu, CentOS, FreeBSD, Red Hat Enterprise Linux, Debian, Fedora)
- Configure SNMP on Oracle Solaris for Solaris monitoring
- Configure SNMP on macOS for macOS monitoring
Configuring WMI
Site24x7 also supports the following:
- Dell iDRAC monitoring
- IBM AIX monitoring
- HP iLO monitoring
- HP UX monitoring
To get started with monitoring, simply install and configure SNMP agents on your servers. If you face any trouble, please contact our support team at support@site24x7.com to help you get started.
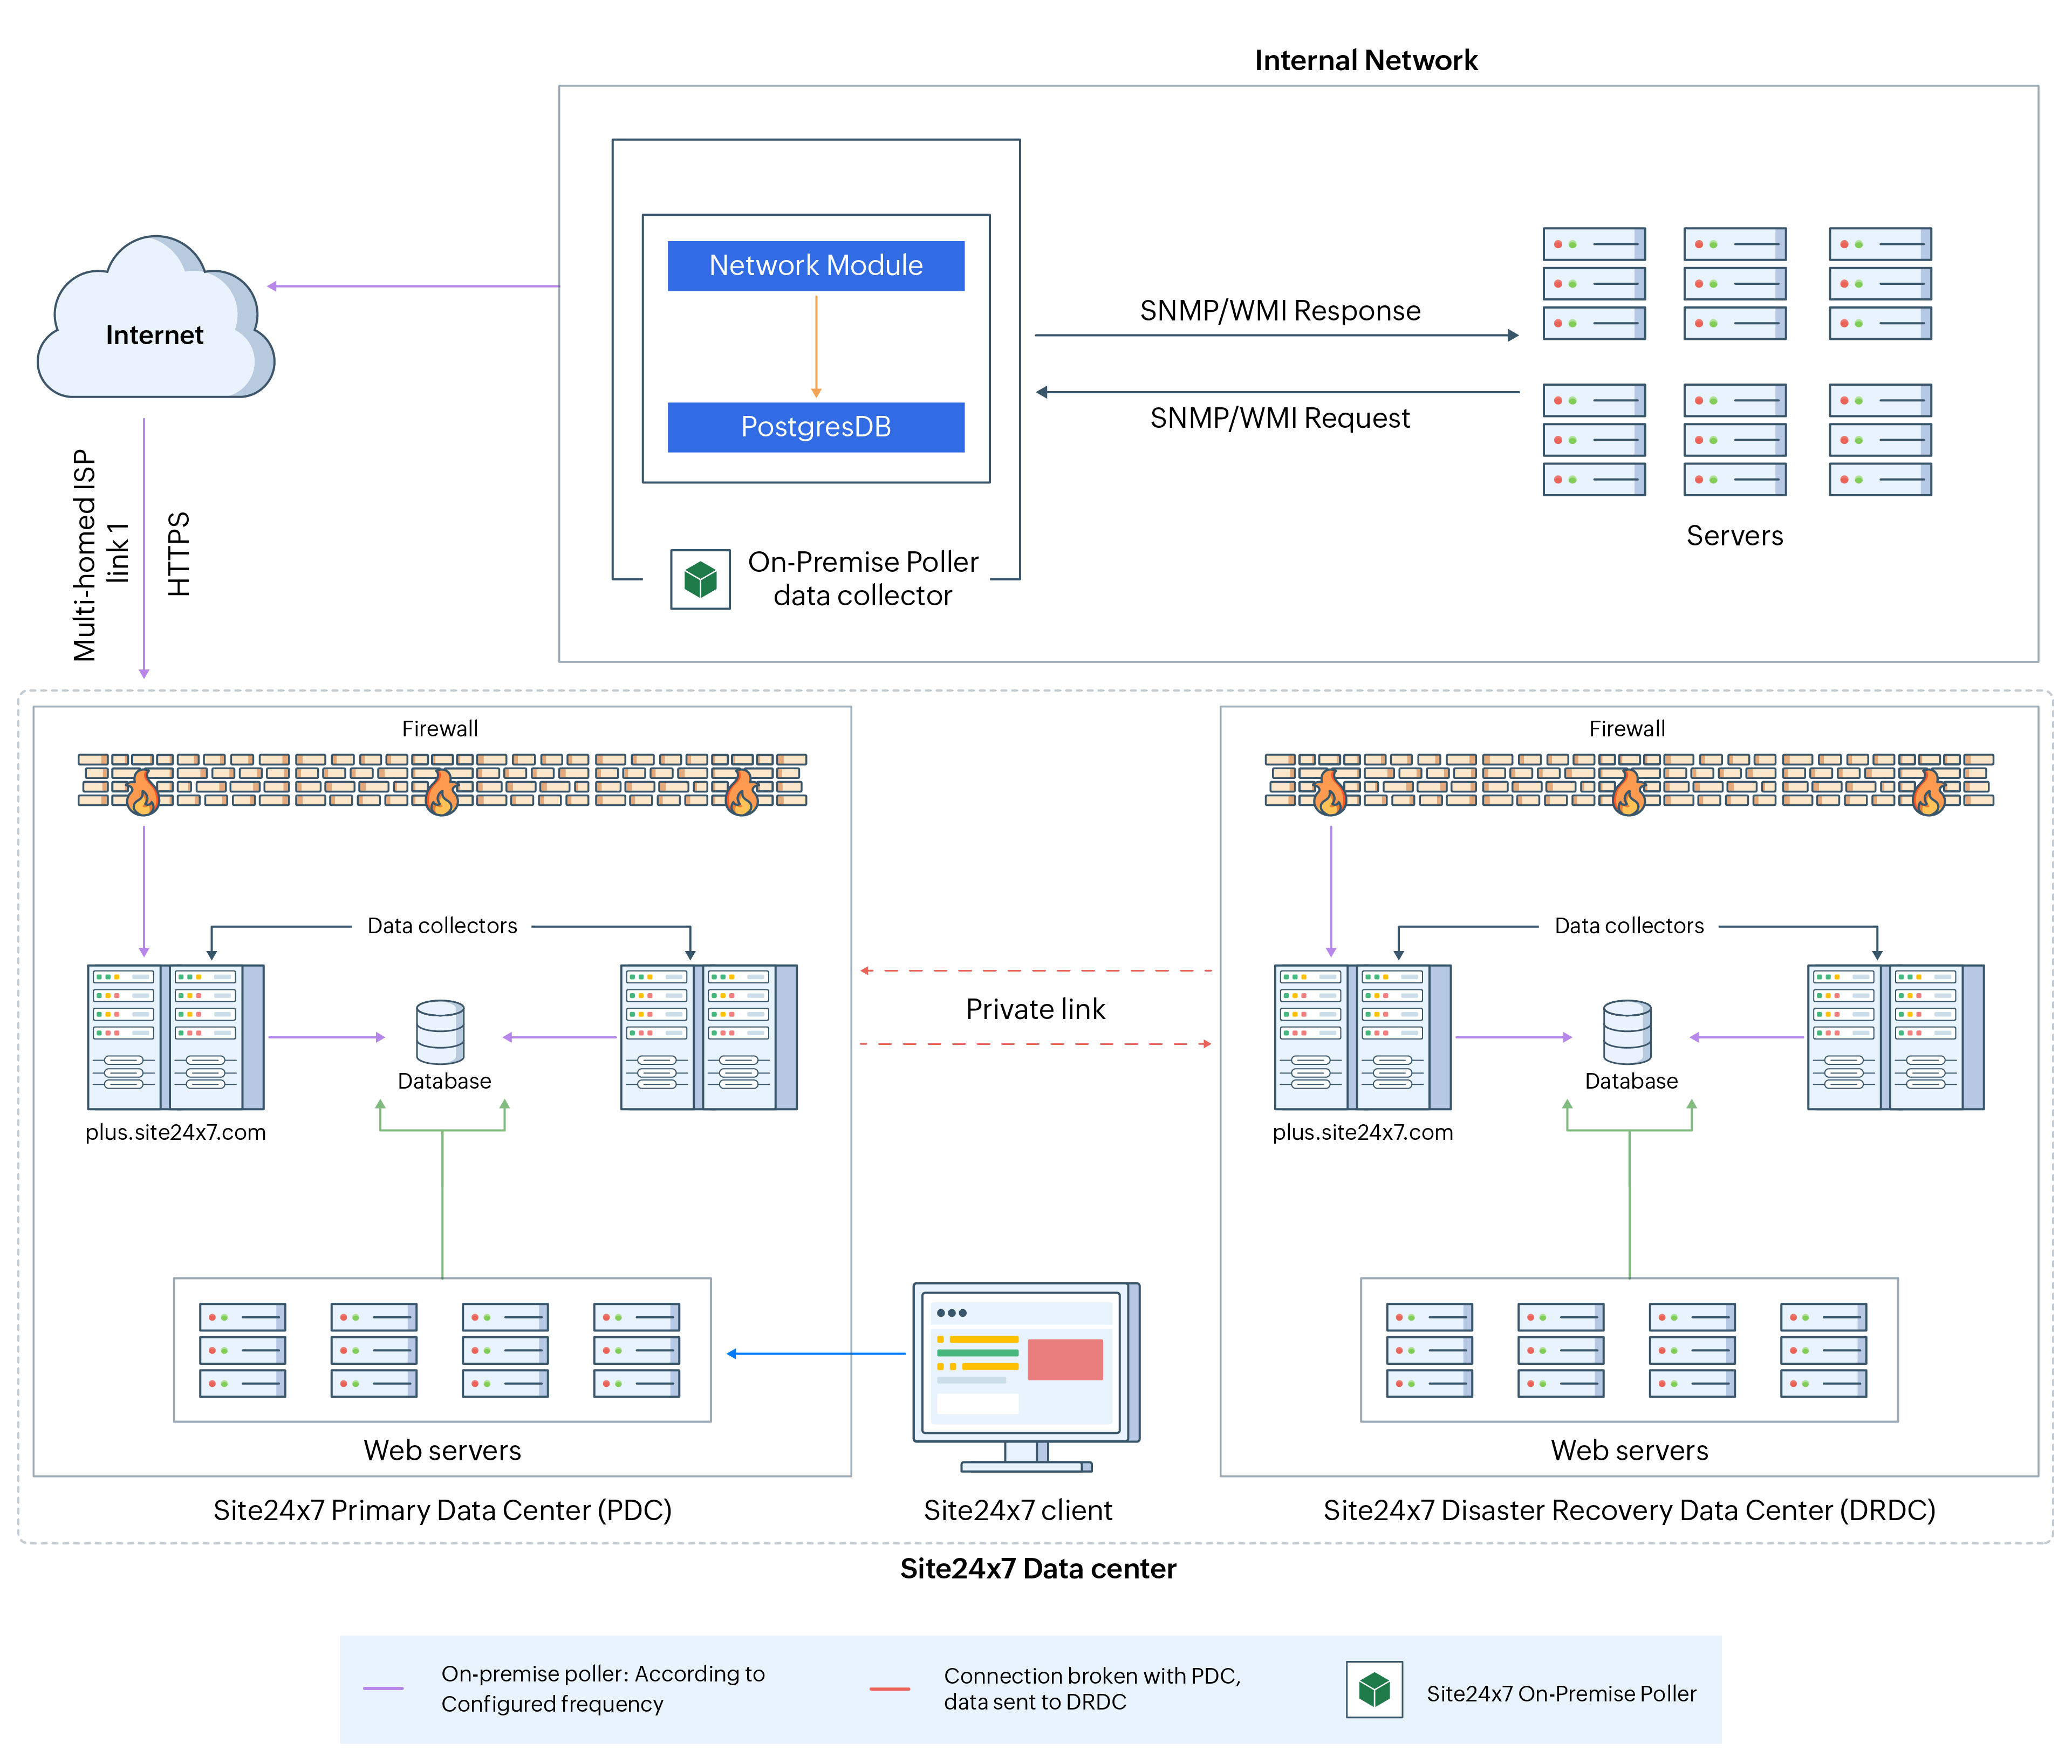
Figure 1. SNMP and WMI Server Monitoring Architecture.
System requirements
| Number of servers | Processors | RAM | Hard Disk |
| 1- 100 | 4 | 8 GB | 20 GB or more |
| 100 - 500 | 8 | 16 GB | 20 GB or more |
In order to use this feature, Linux users must start the On-Premise Poller as a root user while Windows users must have Administrator privileges.
You can either choose to add a particular server or discover servers and add them for monitoring.
Add a server
Follow the steps below to add a server for monitoring:
- Log in to your Site24x7 account.
- Go to Admin > Inventory > Add Monitor.
- In the Add Monitor page, click Agentless Server Monitoring under Servers.
- On-Premise Poller: Select an On-Premise Poller from the list or add a new one by clicking Add a new On-Premise Poller below the list of On-Premise Pollers.
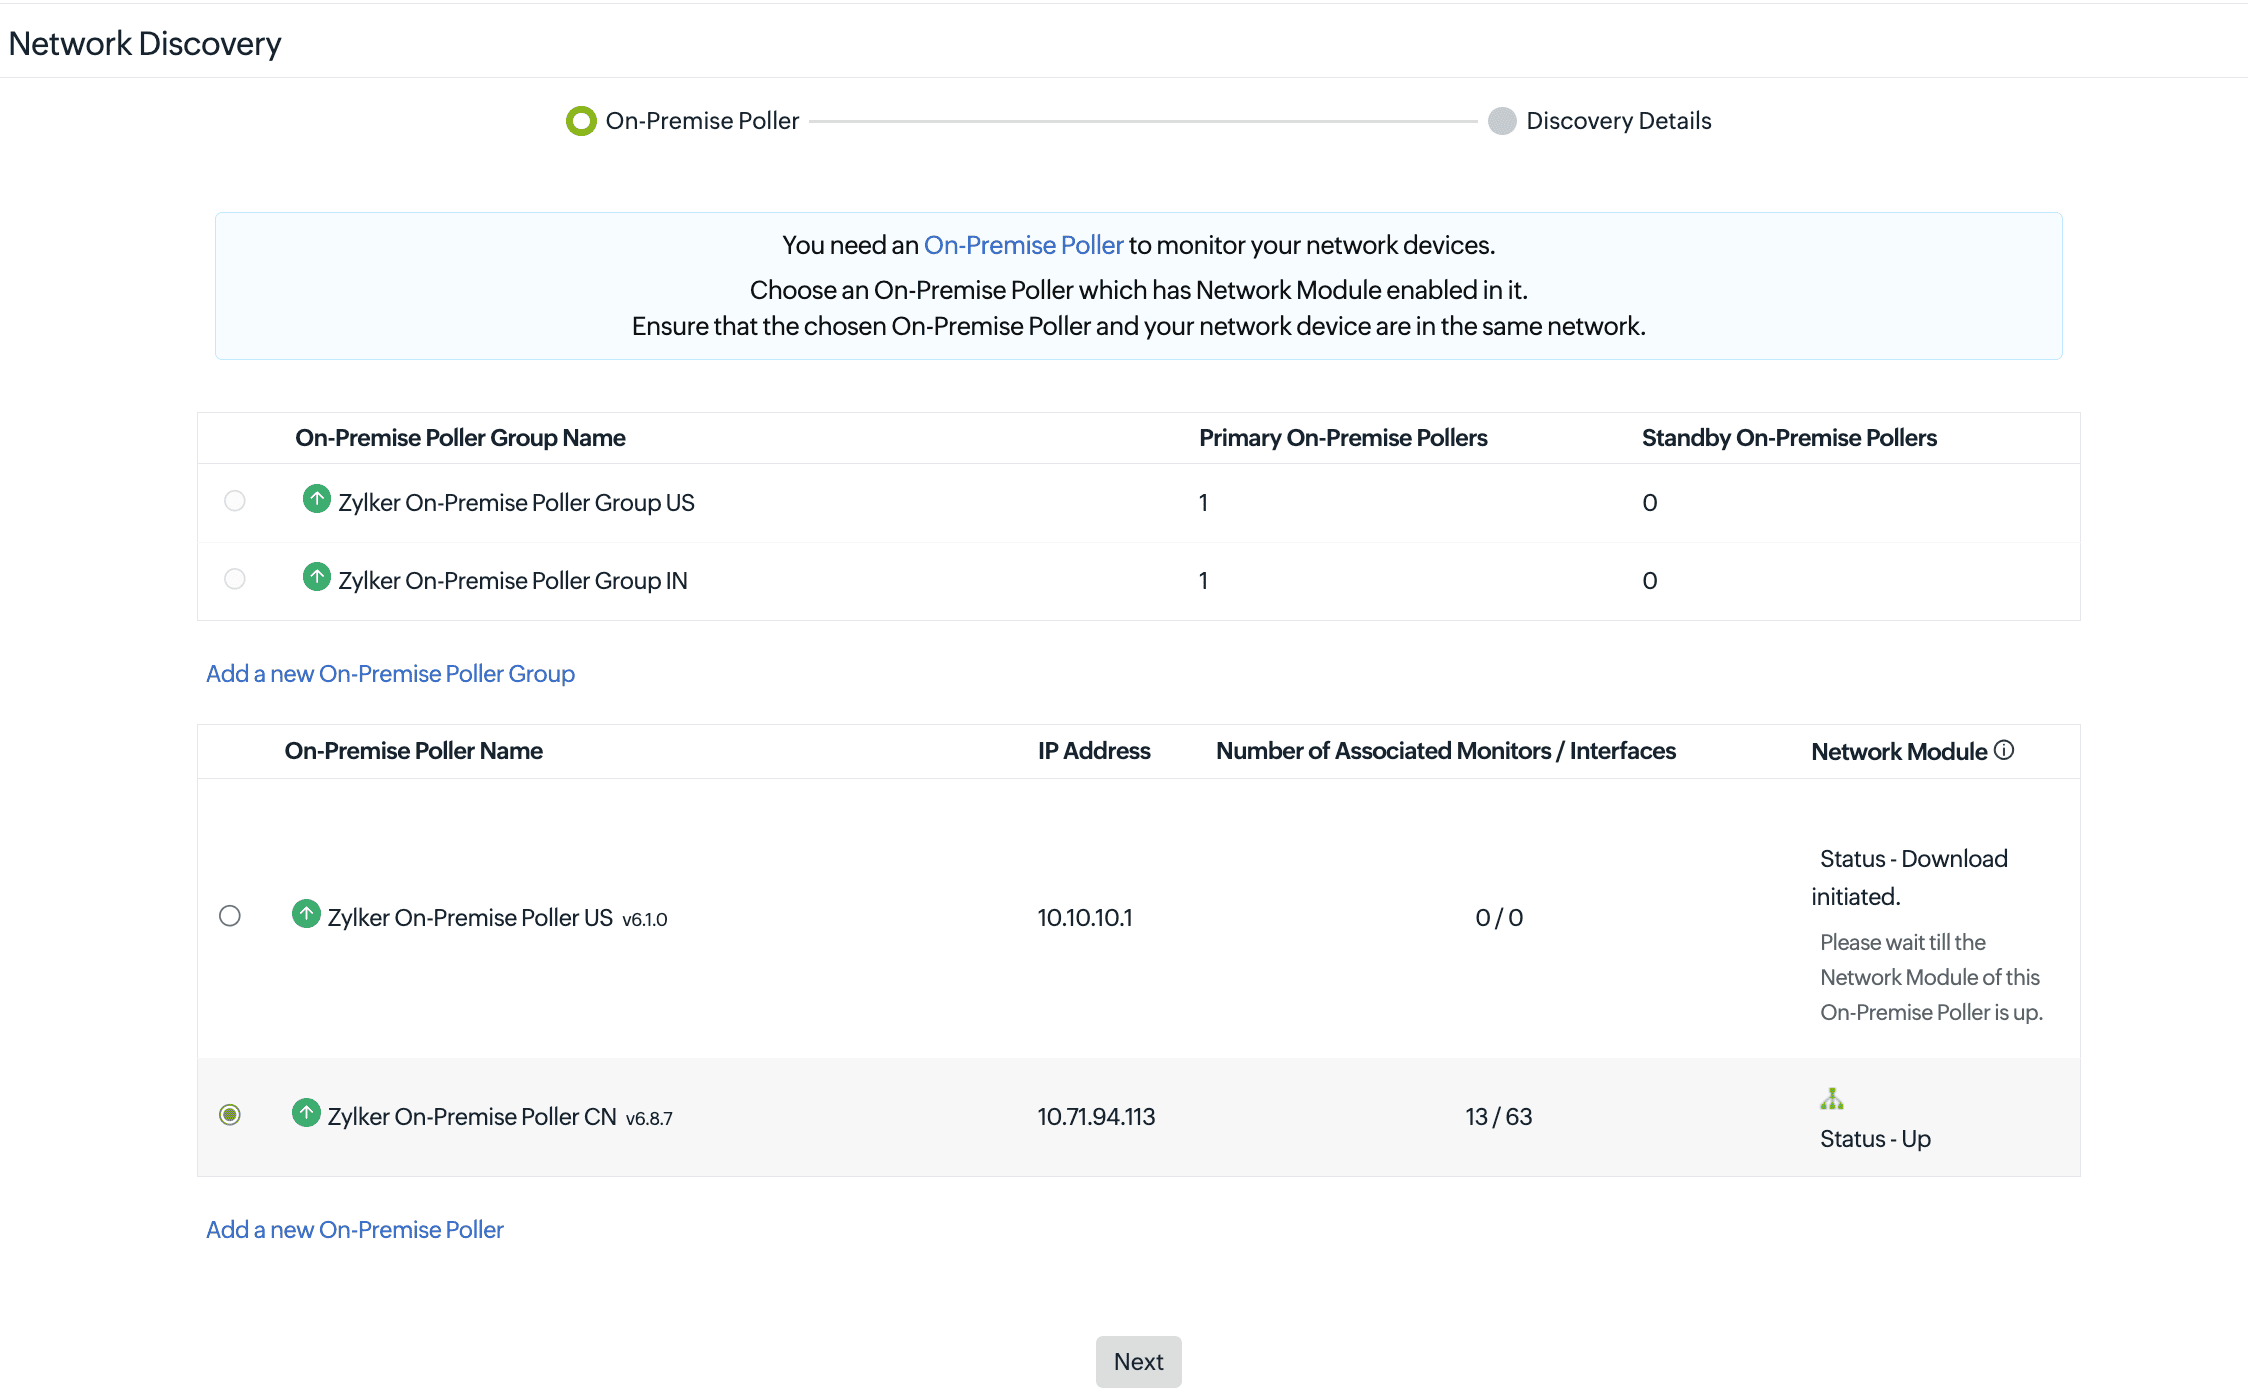 NoteThe Network Module should be enabled in the On-Premise Poller that you select. If not, it must be manually enabled.
 - Click Next.
- Provide the following details:
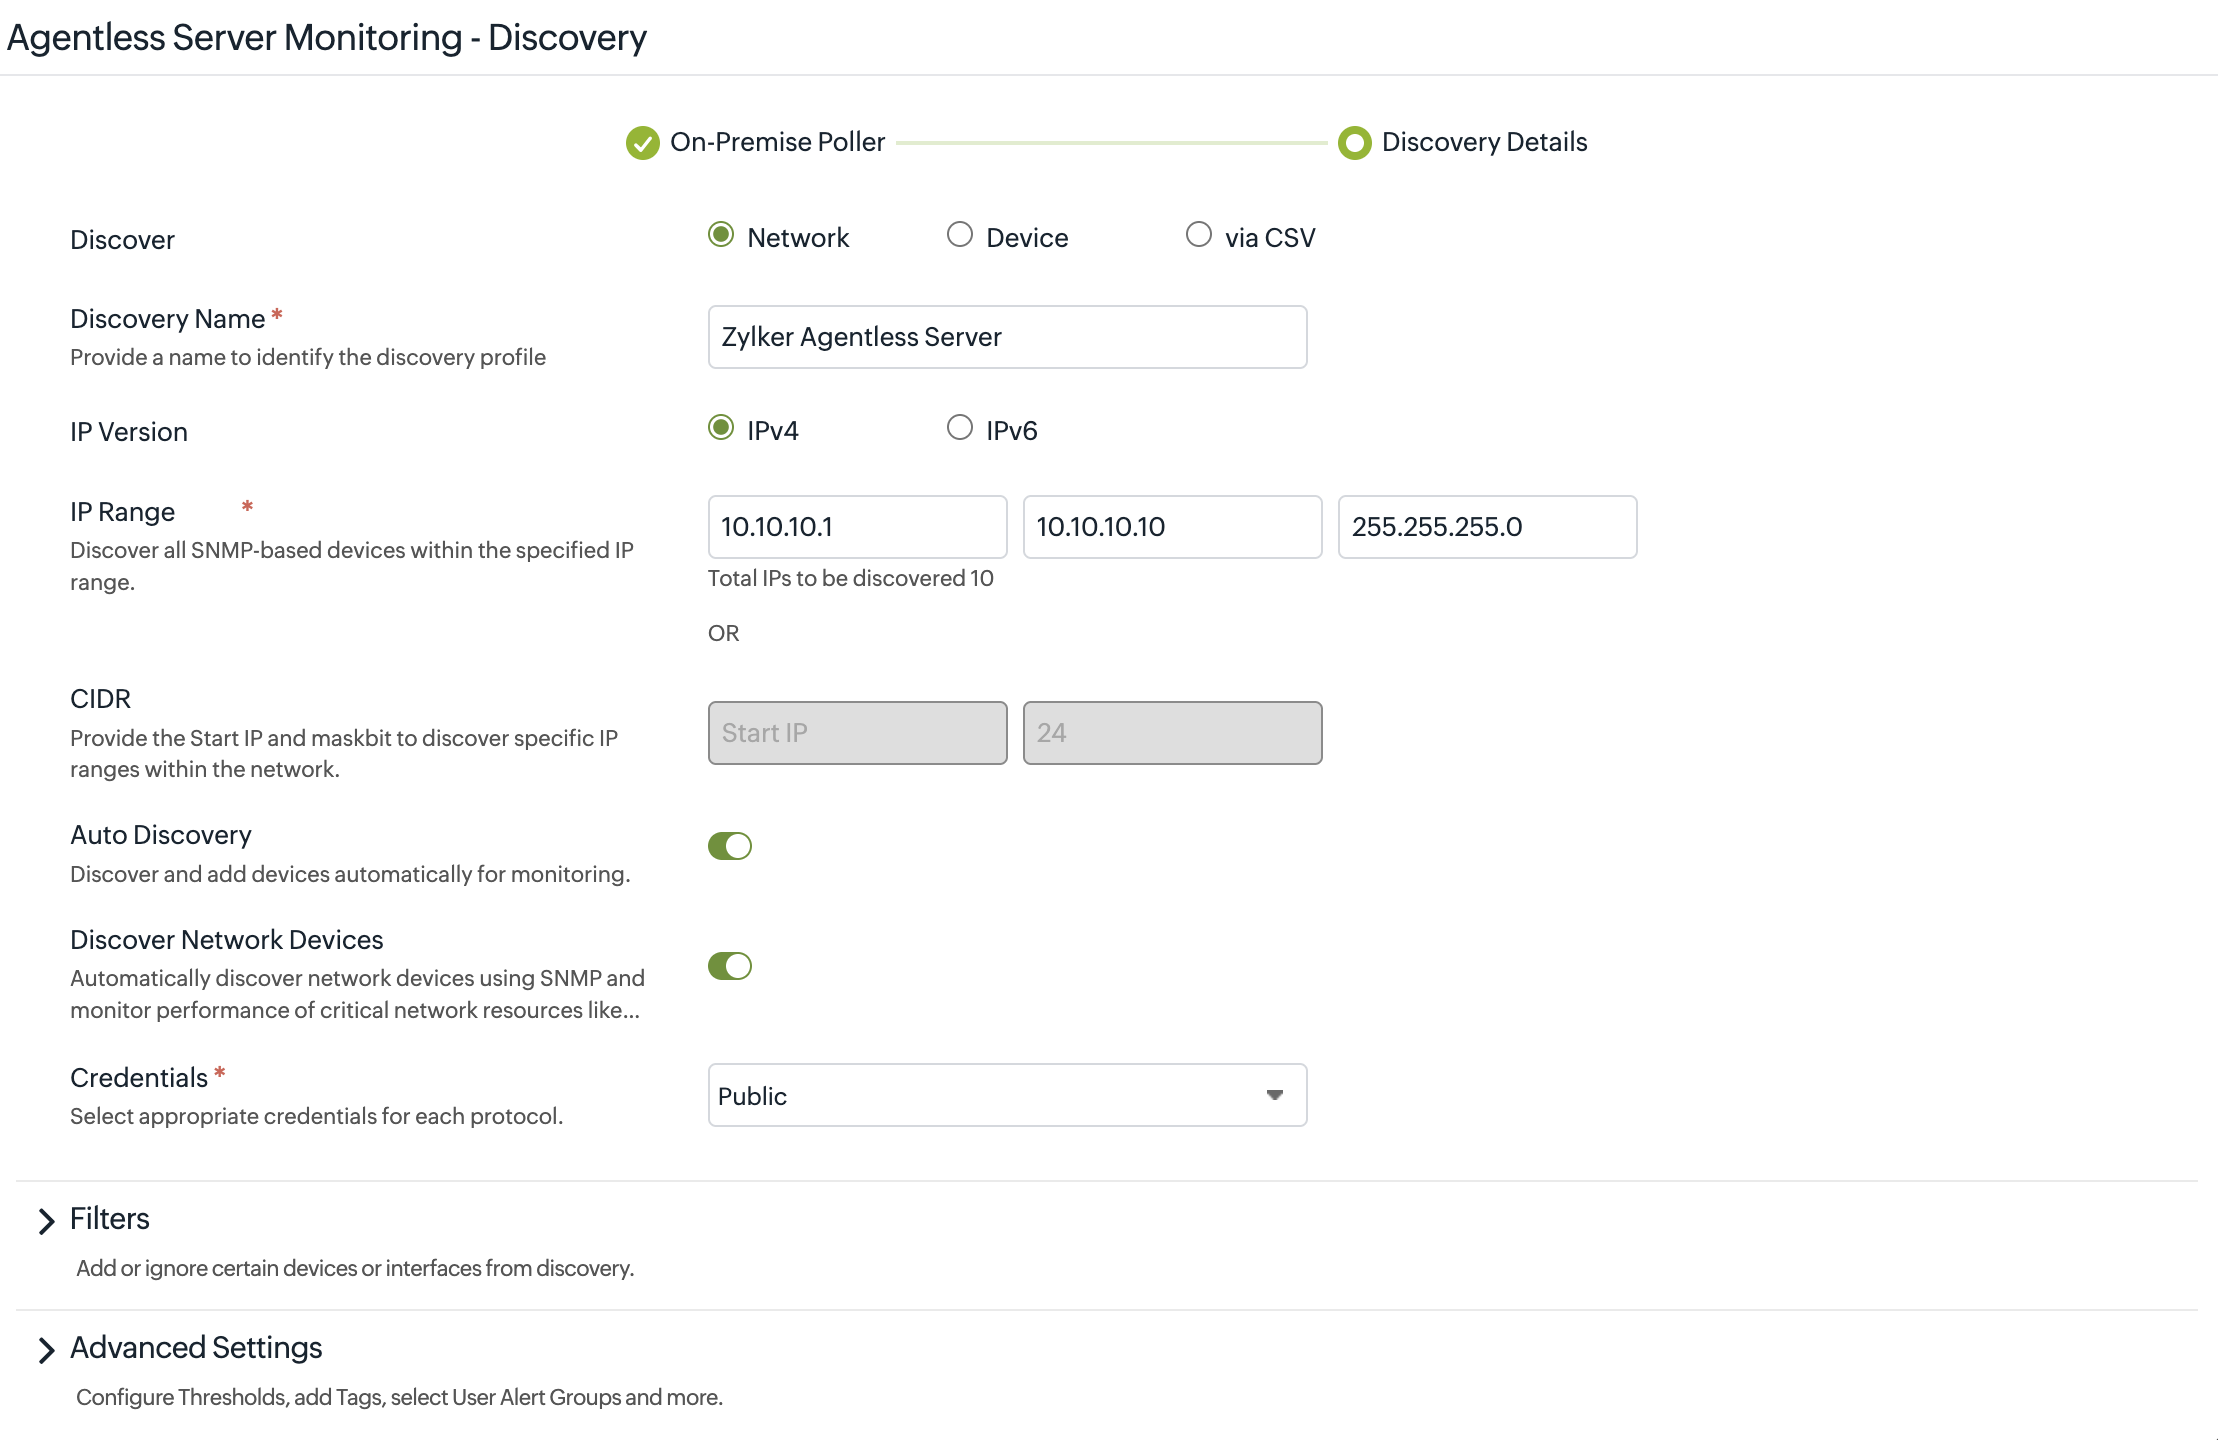
- Discover: Toggle to select Network, Device, or via CSV as needed.
- Discover Network: If you have selected Discover Network in the first step, enter the following values:
- Discovery Name: Provide a unique name to identify the Discovery Profile.
- IP Version: Toggle between IPv4 and IPv6, as required.
- IP Range: Provide the start and end IP addresses with the network mask, or provide the CIDR value in the subsequent field.
- CIDR: Provide the network IP address and the mask bit value.
- Auto Discovery: Toggle to discover servers in the provided range.
- Discover Network Devices: Automatically discover network devices using SNMP and monitor the performance of critical network resources.
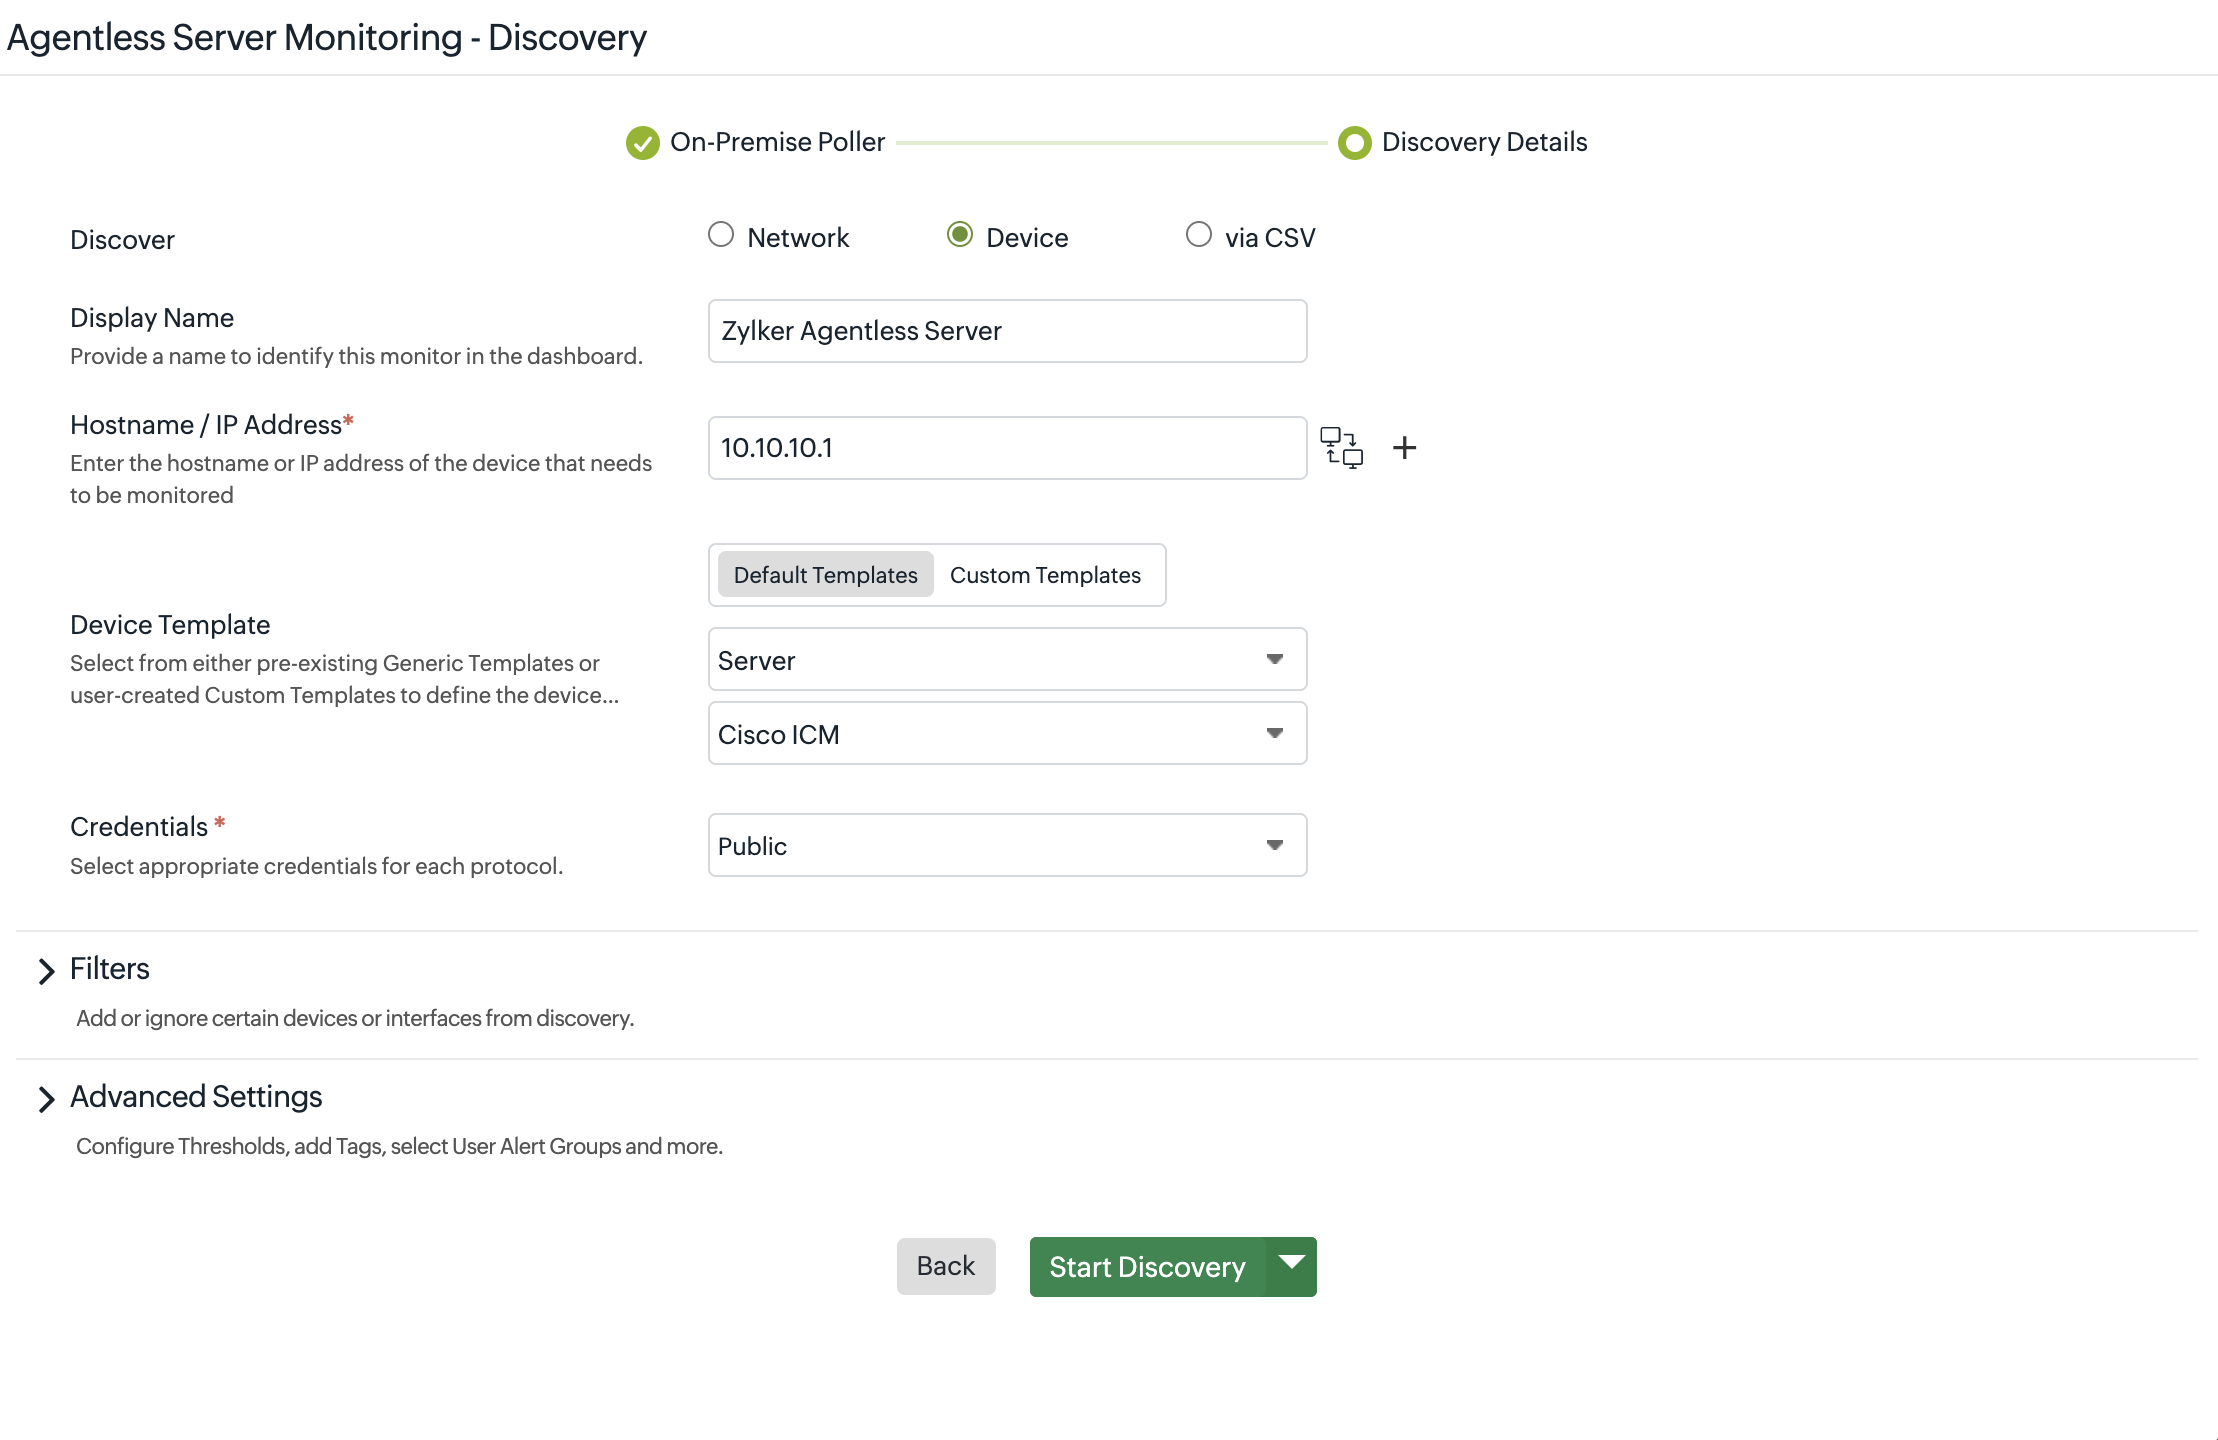
- Discover Device: If you have selected Discover Device in the first step, enter the following values:
- Display Name: Provide a name to identify the device.
- Hostname/ IP Address: Enter the hostname or IP address of the device that needs to be monitored. You can also perform a ping test to check whether the device responds to ICMP by clicking the network communications icon
 . Click the plus icon + to include more devices.
 - Device Template: Toggle between preexisting Default Templates or user-created Custom Templates. Then Select Category of the device. Then, Select Template.
- Discover via CSV: If you have selected Discover via CSV in the first step, enter the following values:
- Discovery Name: Provide a unique name to identify the Discovery Profile.
- Upload File: Click Browse to select a TXT or CSV file that contains the details. You can also download a sample file to check and review the format by clicking the Download Sample File option below the field name.
- Auto-discovery: Toggle to discover and add devices automatically for monitoring once the discovery profile is executed.
- Discover Network Devices: Toggle to start monitoring SNMP-enabled network devices within your network.
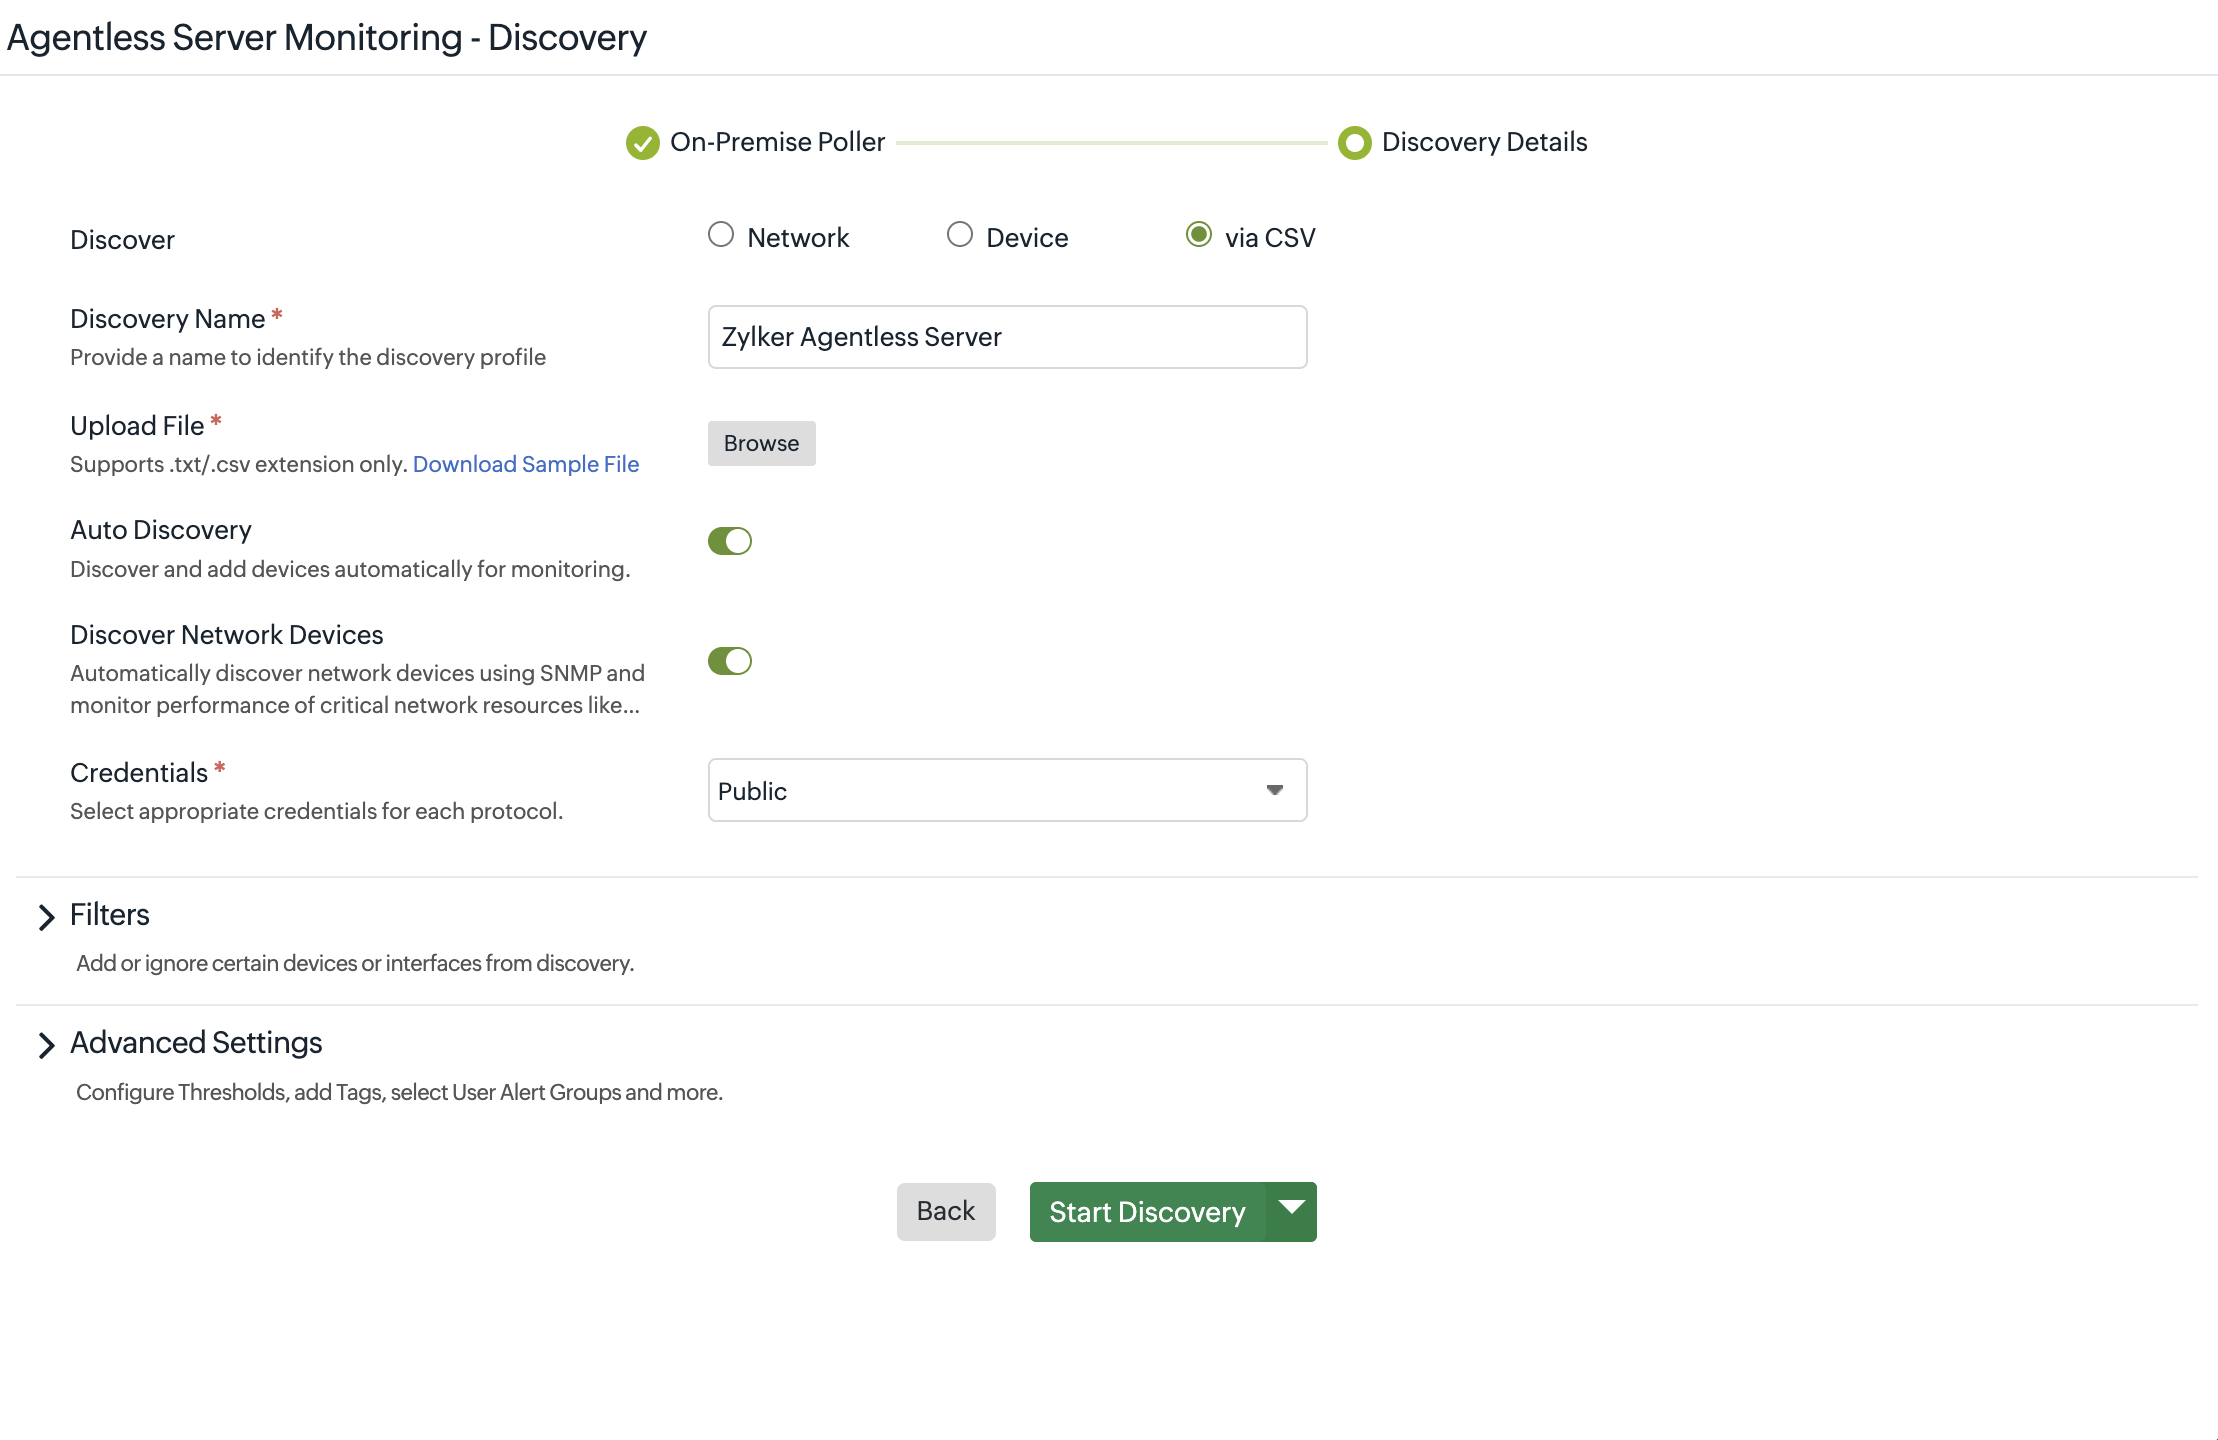
- Credentials: Select credentials that will be used for monitoring the network using various protocols such as SNMP, and WMI, as needed. You can also Add New Credential from the drop-down menu.
NoteFor successful data collection, the right credentials with the correct values must be selected.
- In the Filters section:
- Select an existing filter and edit it by clicking the pencil icon, or delete it by clicking the trash icon
 .
. - In Interface Filters, add a new one by clicking Add Filter. In the Add Network Discovery Rule pop-up, enter the following details:
- Rule Name: Provide a unique name for the rule.
- Description: Provide a description to explain the rule.
- Interface Type(s): Select a value from the drop-down menu.
- Admin State: Select one or more options from Up, Down, or Testing in the drop-down menu.
- Operational State: Select one or more options from Up, Down, Testing, Unknown, or Dormant in the drop-down menu.
- Interface Name: Toggle between Any of these Conditions (OR) or All of these Conditions (AND). In the drop-down menu, select a condition, and in the field beside it, provide a value. Click the plus icon + to add more conditions.
- Click Save Rule.
NoteIf you have selected Device or via CSV, then only Interface Filters will be displayed. However, if you have selected Network, then Device Filters will also be displayed along with Interface Filters.
- If Device Filters is available,
- Provide values for:
- Action: Select Add or Ignore in the drop-down menu.
- Type: Select an option from IP Range, IP Address, Category, Device Type, and Device Name in the drop-down menu.
- Condition: Select between Equals or Contains. The options vary based on the Type selected in the previous step.
- Value: Provide a value according to the selected Type.
- Click the plus icon + to add a new filter.
- Click the trash icon to delete a filter.
- Provide values for:
- Select an existing filter and edit it by clicking the pencil icon, or delete it by clicking the trash icon
- In the Advanced Settings section, the default values will be selected. Expand the form to edit the existing values for the following fields:
- Threshold and Availability: Select a Threshold and Availability Profile from the drop-down menu.
- Monitor Groups: Select a monitor group if needed or add one by clicking the plus icon +.
- Tags: Select zero or more existing tags or add a new one by clicking the plus icon +.
- User Alert Group: Select zero or more user alert groups.
- On-Call Schedule: Select an on-call schedule to alert users in specific shifts; edit an existing one by clicking the pencil icon
 or add a new one by clicking the plus icon +
 - Notification Profile: Select a notification profile from the drop-down menu; edit an existing one by clicking the pencil iconor add a new one by clicking the plus icon +
- Services: Select an option if you wish to integrate Site24x7 alarms to a preferred third-party service.
- Click Save to save the profile and run it as required. You can also select Save and Start Discovery or Save and Schedule from the drop-down menu.
Adding a server usually takes around five minutes, after which you can view the monitor by navigating to the Server tab.
-
On this page
- Prerequisites
- System requirements
- Add a server