Web Transaction (Browser) - Import Selenium Script
The Import Selenium Monitor option enables you to create a Web Transaction (Browser) monitor by uploading a Selenium IDE script. This is useful when you already have an automated browser test script and want to reuse it to monitor the availability, performance, and functionality of key user flows in your web application.
Selenium IDE is an open-source tool that records user actions in a browser and converts them into an executable script. These scripts capture interactions such as clicks, navigation, form submissions, and field inputs. By importing this script into Site24x7, you can simulate real-user actions and monitor transactions from more than 130 geographic locations.
How it works
Here are the steps that explain how the monitor works:
- Record a transaction using Selenium IDE (Edge/Firefox extension) and export the script from Selenium IDE in .side, .txt or .json format.
- Upload the file in the Import Selenium Script tab.
- Site24x7 will parse the script, validate the steps, and convert it into a Web Transaction (Browser) monitor.
- You can modify the configuration settings such as location, frequency, timeout, alert conditions, etc.
- Save the monitor to begin synthetic monitoring.
Supported file formats
You can upload any of the following Selenium IDE script formats:
- .side
- .json
- .txt
Use case
A company wants to ensure its login flow works 24/7. The QA team already has a Selenium IDE script that records steps like opening the login page, entering credentials, and verifying successful login. They import this script into Site24x7 as a Selenium Monitor. The script now runs at regular intervals in real browsers, alerting the team instantly if any step fails. This helps them detect authentication issues early and ensure uninterrupted access for users.
Adding a monitor with import Selenium script
- Log in to Site24x7.

- Navigate to Admin > Inventory > Add Monitor > Web Transaction (Browser).
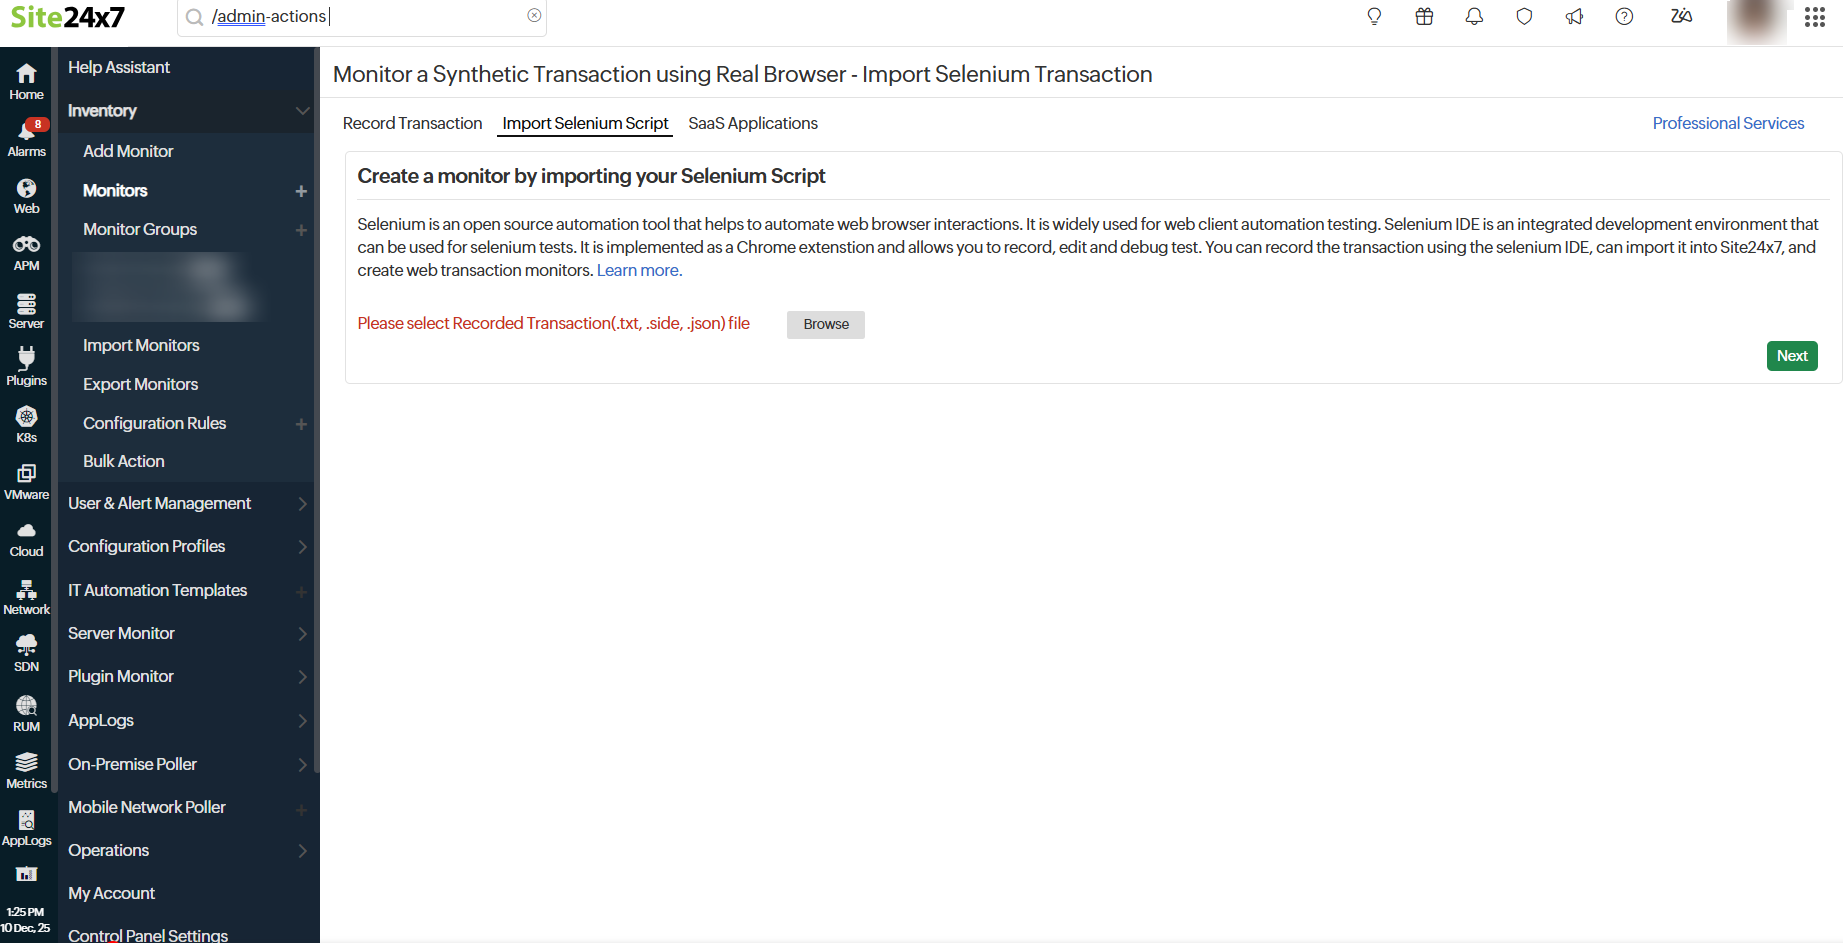
- Go to the Import Selenium Script and upload the .side, .json, or the .txt file by clicking the Browse button.
- Click the Next button and the page will be redirected to the Add Web Transaction (Browser) page.
- Provide the details in the Add Web Transaction (Browser) monitor and click the Save button.
Add Web Transaction (Browser) monitor
Provide these details after uploading the Selenium script.

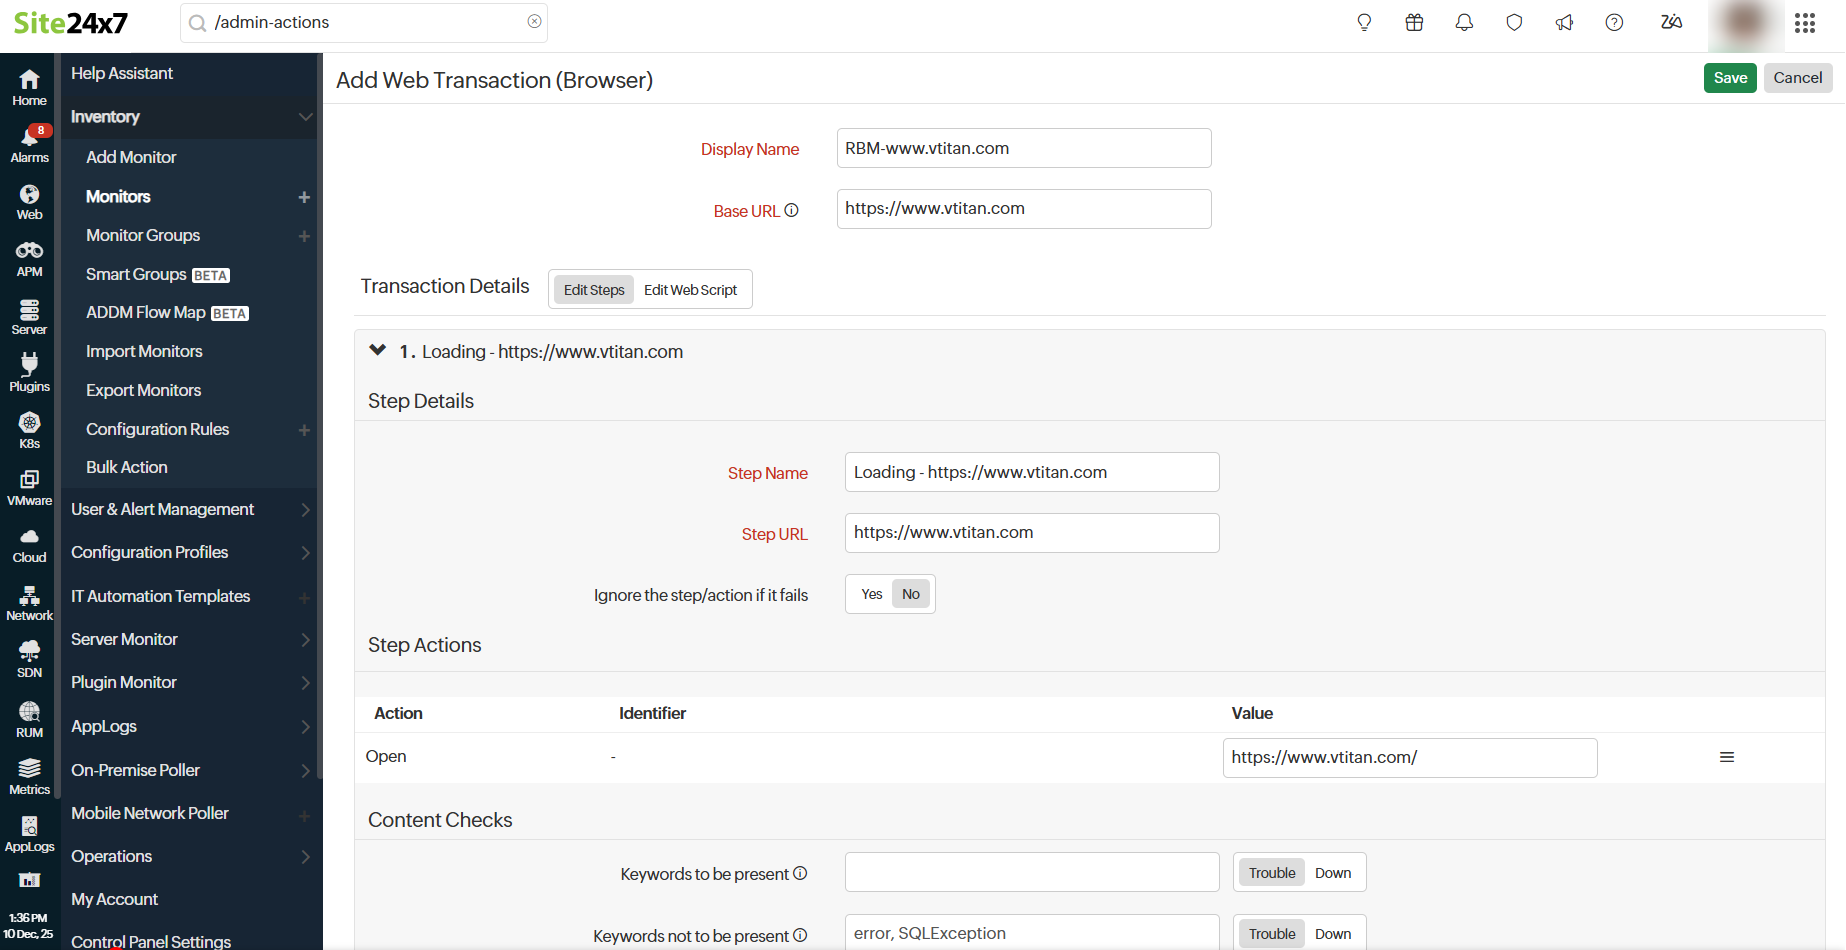
- Display Name: Provide an appropriate name for the monitor.
- Base URL: The URL for which you're creating the monitor.
- You can edit the steps of the transactions under the Edit Steps :
- Step Details: Provide the Step Name, Step URL, and toggle the button for Ignore the step/action if fails to Yes if you want to ignore this step. By default, the toggle is set to No.
- Step Action: Provide the Action, Identifier, and Value. Clicking the hamburger icon
 lets you add a Wait Time or Delete the action.
Wait time is the duration that each action is required to pause for. - Content Checks: Modify the Content Check settings as per your requirements.
- Keywords to be present: Get alerted when the specified keywords are not present in the website. Mention the keywords in the Content Check text box and toggle the button to trigger a Trouble or Down alert when the keyword check fails. To check multiple keywords or a phrase, specify these inside double quotes (""). Example: "searching the keyword".
- Keywords not to be present: Get alerted when the specified keywords are present in the webpage content. Mention the keywords in the check box and use the toggle button to trigger a Trouble or Down alert when the keyword check fails.
NoteYou must adhere to the following conditions while adding keywords in the given field:
- A single string or keyword can be configured with or without any double quotes (for example, HTML).
- If there are two strings, which comprise a single keyword, add a space in between the two strings and enclose it with double quotes (for example, "HTML response").
- If you have more than two individual keywords configured, you will have to separate them with a space and also use double quotes for each of them (for example, "monitor" "HTML").
To learn more, refer to Content Checks.
- Should match regular expression: Configure your alert based on whether a particular pattern matches with the website content.
For example: For the expression ^[a-z0-9_-]{3,15}$ , your website content should contain alphabets from a to z, numbers from 0 to 9, underscore, and a hyphen. Also, there should be a minimum length of three characters and a maximum length of 15 characters. When it is not matched, your website will be reported as "Regular expression"^[a-z0-9_-]{3,15}$" does not match" as a reason. - Click Save to save the changes in the Edit Script.
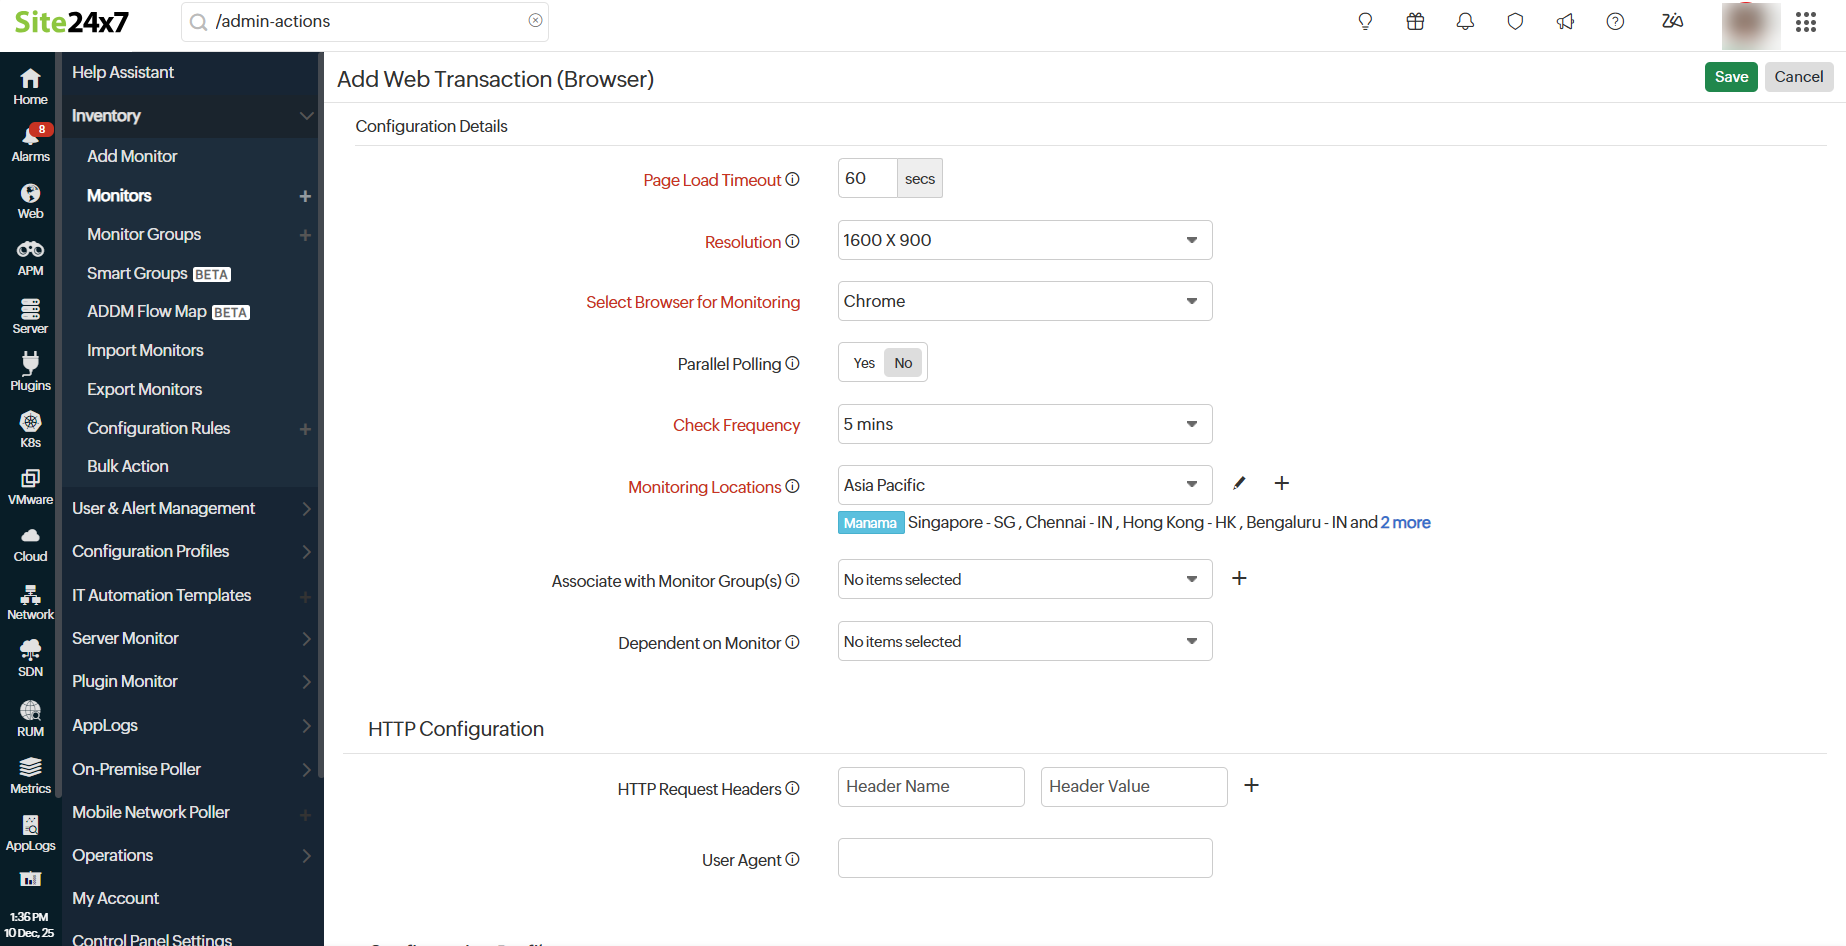
- Provide the following details under Configuration Details:

- Dependent on Monitor: Select a monitor from the drop-down list to choose it as your dependent resource. Alerts to your monitor will be suppressed based on the Down status of your dependent resource.
Note
- Configuring a dependent resource and suppressing alerts based on the dependent resource's status provides you with better false alert protection. Learn more about alert suppression at the monitor level.
- If you select None in the dependent resource field, alerting will proceed as per your normal configuration settings. No alerts will be suppressed in this case as the monitor doesn't have a dependent resource.
- Multiple monitor group support for monitors allows a monitor to be associated with multiple dependent resources in different monitor groups. If during a normal monitor status check, any one of these dependent resources' status is identified as Down, the alert for the monitor will be suppressed automatically. However, the dependency configuration at the monitor level is always given the higher priority over any other monitor group-level dependency configuration for suppressing alerts. To learn more, refer to dependency configuration.
- Page Load Timeout: The total estimated time taken to load the HTML and all its associated components, including javascript and images. This time can be anywhere between one and 60 seconds.
- Resolution: The screen resolution that will be used during the monitor playback.
- Select Browser for Monitoring: Choose Firefox, Chrome, or Edge for test playback.
- Parallel Polling: Enable parallel polling to initiate data collection from all the configured monitoring locations simultaneously during hourly polls. Polling will be handled asynchronously, by default.
NoteFor session-based applications, if the polling occurs simultaneously across multiple locations, it will create concurrent sessions and affect the monitoring, leading to monitor failure. This is why it's important to restrict parallel polling during hourly polls alone.
- Check Frequency: Choose the required polling frequency. The frequency can be set from five minutes to one day.
- Monitoring Locations: Choose a global location or private location from the drop-down list to set up monitoring of your website transaction from this location. Choose your on-premise poller from the drop-down to customize your private location. Additionally, customize Monitoring Locations and create location profiles based on your requirements. To know more, refer to Location Profile.
- Associate with Monitor Group(s): You can associate your monitor with multiple monitor groups by selecting the relevant monitor groups from the drop-down list. This allows for logical grouping of your monitors.
NoteTo learn how to create a monitor group for your monitors, refer to Monitor Groups.
- Dependent on Monitor: Select a monitor from the drop-down list to choose it as your dependent resource. Alerts to your monitor will be suppressed based on the Down status of your dependent resource.
- Provide the below details for the HTTP configurations:
- HTTP Request Headers: If you want to customize the default HTTP request header information, the additional header name and header value can be added here.
NoteTo use a credential profile in HTTP Configurations, type $ and a list of available credential profiles will appear—select the desired one from this list. Learn more about credential profiles.
- User Agent: Configure a customized user agent (web browser) for sending your request and the HTTP headers to data collection.
Learn more about browser versions used in the Synthetic Web Transaction (Browser) monitor.
- HTTP Request Headers: If you want to customize the default HTTP request header information, the additional header name and header value can be added here.
- Provide the below details for the Configuration Profiles:
- Threshold and Availability: Select a threshold profile from the drop-down list or choose the default threshold set available and get notified when the resources cross the configured threshold and availability. Learn more about creating a customized threshold and availability profile.
- Tags: Associate your monitor with predefined tag(s) to help organize and manage your monitors creatively. Learn how to add tags.
- IT Automation Templates: Select an automation to be executed when the website status is Down, Trouble, Up, or any status change or any attribute change. The defined action will be executed when there is a state change, and selected user groups will be alerted. Learn more about IT Automation.
- Execute IT Automation during Scheduled Maintenance: Configuring a scheduled maintenance window allows you to suppress alerts for select IT resources during routine maintenance tasks. Select the check box to enable the option to execute IT Automation, including script executions, server commands, and more, during this period.
- Specify the details under the Alert Settings :
- User Alert Group: Select the user group that need to be alerted during a outage. To include multiple users in a group, refer to User Alert Group.
- On-Call Schedule: This option ensures that notifications are sent to assignees during specific shift hours, helping them respond quickly to alerts or incidents. Choose the on-call option of your preference from the drop-down menu.
- Notification Profile: Choose a notification profile from the drop-down or select the default profile available. Notification profiles help to configure when and who needs to be notified in case of downtime.
- Third-Party Integrations:
- Associate your monitor with a preconfigured third-party service. This capability lets you push your monitor alarms to selected services and facilitates improved incident management.
NoteTo set up an integration, navigate to Admin > Third-Party Integration. To learn more, refer to Third-Party Integrations.
- Associate your monitor with a preconfigured third-party service. This capability lets you push your monitor alarms to selected services and facilitates improved incident management.
- Click Save to save the transaction.
- You can also edit the web script by choosing your saved monitor using the import Selenium script and click the hamburger icon
 and select Edit. Learn more about editing the monitor.
 - Learn more about the various performance metrics of a Web Transaction (Browser).
