Threshold and Availability for Application Performance Monitor
Follow the steps listed below to add Threshold and Availability for APM Monitor:
- Login to Site24x7.
- Click Admin > Configuration Profiles > Threshold and Availability.
- Click "Add Threshold profile" on the top right corner in Threshold and Availability screen.
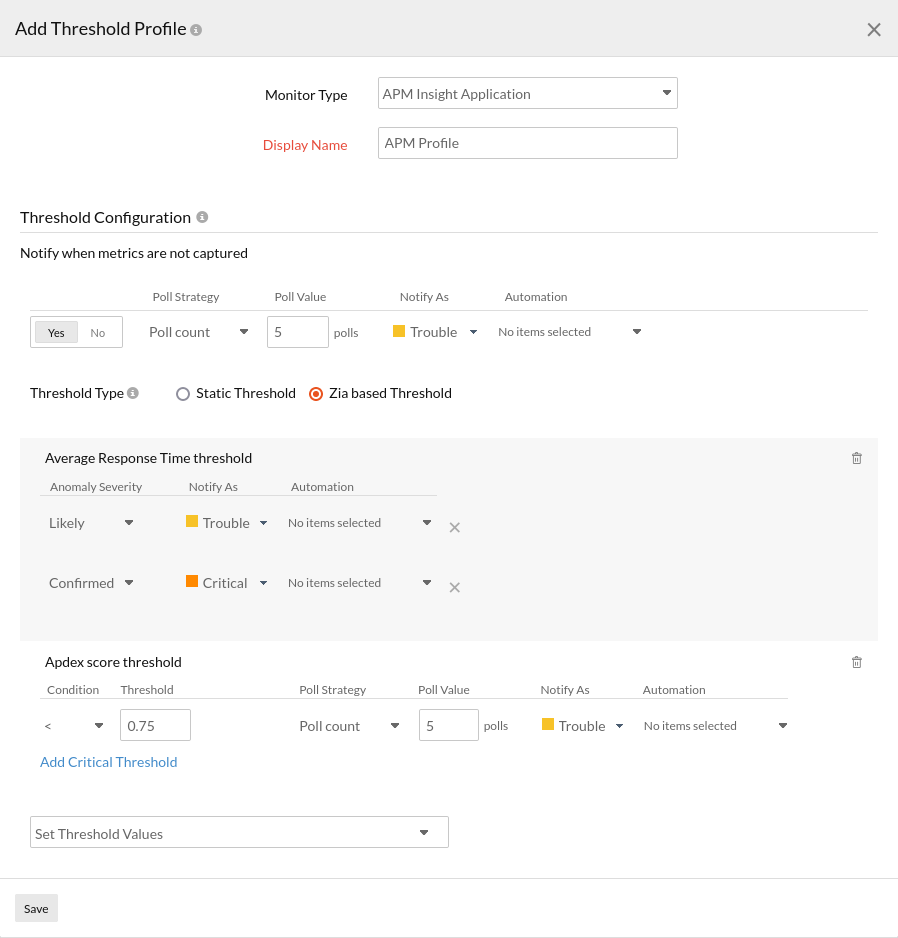
- Choose "APM Insight Application" in Monitor type in Add Threshold Profile screen.
- Threshold Type
- Static Threshold: From the drop-down menu, choose the desired metrics for which thresholds need to be configured. Enter a value specific to the unit, and set the threshold conditions (<, <=, =, >, or >=) and the monitor state (to be notified as) for each metric. You'll receive alerts when these threshold conditions are violated.
- Zia-based Threshold: The Zia-based Threshold tracks the abnormal spikes using anomaly detection and offer a dynamic threshold that will be updated accordingly. If you choose the Zia-based threshold, select the associated anomaly severity and the status accordingly.
- Specify the following parameters:
- Display Name: Provide a label for identification purpose.
- Apdex Score: Value of Apdex score ranges from zero to one, with one denoting maximum user satisfaction and zero denoting frustrated levels of satisfaction. You can configure trouble or critical alerts when the Apdex score goes below the configured value.
- Average Response Time: Get notified with status trouble or critical when the Average Response Time exceeds the configured threshold value. By default, the average response time is set to 2000 ms.
- Error Count: Get notified with status trouble or critical when the error count exceeds the configured threshold value. For instance, you can set to receive alerts when your error count exceeds 50 or whatever value you deem fit for your application.
- Error rate: Get notified with trouble or criticial status when your error rate exceeds the specified threshold value. For example, if ten percent of your total transactions are errors, you can choose to get alerted.
- Exception Count: Get notified with status trouble or criticalwhen the exception count exceeds the configured threshold value.
- JVM Metrics: For Java applications, you can configure trouble or critical alerts for key metrics like JVM CPU Usage, Heap memory usage, GC count, and GC time.
- Active instance count: Get notified with trouble or critical status when the number of instances for which the agent actively communicates, breaches the configured threshold.
- Notify when metrics are not captured: Get notified with trouble or critical status when the agent is actively communicating, but the metrics were not captured and shown in the client.
- Request count deviation: Get notified with trouble or critical status when the request count of the instance deviates from the average request count of the application.
- NodeVM Metrics: For Node.js applications, you can configure trouble or critical alerts for key metrics like NVM CPU usage, heap memory usage, GC Pause Time, and GC Pause Frequency.
- Instance Count: Get notified with trouble or critical status when the number of critical/trouble/down/suspended instances exceeds the configured threshold value. For example, you can configure your application to receive alerts when the number of critical/trouble/down/suspended instances exceeds 20 or whatever value you deem fit for your application.
- Instance Percent: Get notified with trouble or critical status when your critical/trouble/down/suspended instance rate exceeds the specified threshold percent value. For example, if you have 100 instances and set the instance percent threshold to 10, you will be notified if more than 10 instances are in critical/trouble/down/suspended status.
NoteAdvanced Threshold Settings (Strategy):
Poll count serves as the default strategy to validate the threshold breach. You can validate threshold breach by applying multiple conditions (>, <, =, >=, <=) on your specified threshold strategy. The monitor’s status changes to ”Trouble” when the condition applied to any of the below threshold strategies hold true:- Threshold condition validated during the poll count (number of polls): Monitor’s status changes to trouble or critical when the condition applied to the threshold value is continuously validated for the specified “Poll count”.
- Average value during poll count (number of polls): Monitor’s status changes to trouble or critical, when the average of the attribute values, for the number of polls configured, continuously justifies the condition applied on the threshold value.
- Condition validated during time duration (in minutes): When the specified condition applied on the threshold value is continuously validated, for all the polls, during the time duration configured, monitor’s status changes to trouble or critical.
- Average value during time duration (in minutes): Monitor’s status changes to trouble or critical, when the average of the attribute values, for the time duration configured, continuously justifies the condition applied on the threshold value.
- Multiple poll check strategy will not be applied by default. During the conditions where no strategy could be applied, the threshold breach will be validated for a single poll alone.
Note
To make sure the condition applied on the strategy “Strategy-3: Time duration or Strategy-4: Average value during time duration” for threshold breach detection works as intended, you must ensure that you specify a time duration which is at least twice the applied check frequency for that monitor.
- Click Save.
Note
To configure the threshold parameters for single Instance, click on APM > Application > Instance in Monitor Type in Threshold and Availability screen.

Edit Threshold and Availability for APM Application/Instance
- Click the profile to be edited.
- Change the parameters in Edit Threshold Profile screen.
- Click Save.
Delete Threshold and Availability for APM Application/Instance
- Click on the profile to be deleted.
- Click on " Delete " in Edit Threshold Profile screen.
