Public Reports
Use this option to make your reports accessible to customers without a login. You can share various reports with your customers viz., Availability Summary Report, Summary Report, Health Trend Report, Busy Hours Report, Top-N-report, Performance Report, Executive Summary SLA Report, and Step Summary Report of your monitors and monitor groups. Explore more about the monitor reports and monitor groups report.
Add Public Reports
- Click Admin > Share > Public Reports
- Click (+) Publish Reports in Public Reports screen.
NoteA Custom Report is disabled if it has already been published.
- Specify the following details to publish reports:
- Display Name: Provide a name for the public report which is to be created.
- Description: Provide an appropriate description which will appear on the public report.
- Report Type: Select the required report type from the dropdown list.
- Include Subgroups: Enable this option to include subgroups of the selected Monitor Groups. Otherwise, only the selected Group will be considered.
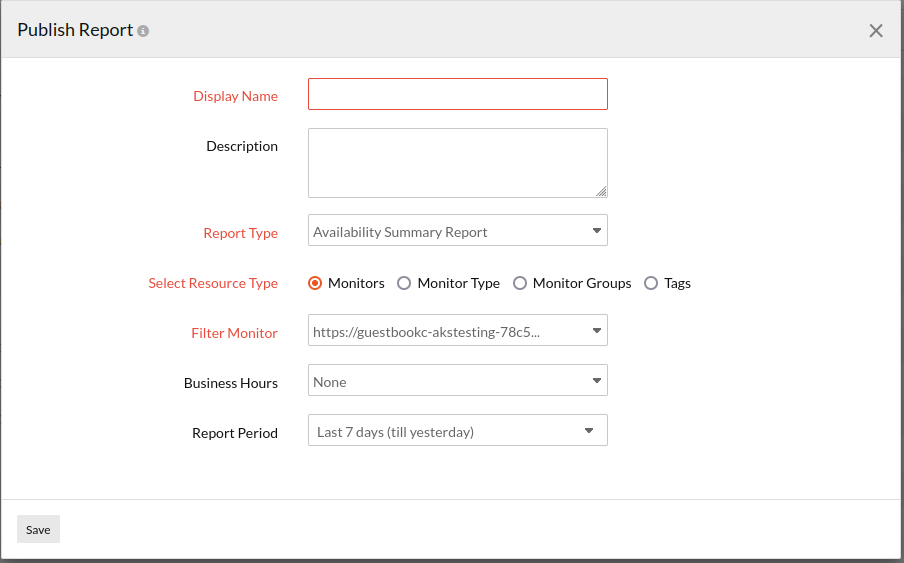
Mention the following details when either Summary Report and Availability Summary Report is selected:
- Select Resource Type: Select the required monitors, monitor groups, or tags radio button to make the reports public. Specify the relevant Monitor(s), Monitor Group(s), Monitor Types, or Tag(s) for which the reports are to be published.
- Attribute: When you select a Metrics monitor, upon choosing the monitor, you'll be provided with an option to choose the associated attributes from the drop-down menu.
- Template Name: Templates are where the attributes to be monitored are defined and every plugin will have a template associated with it. This option will be available only if you choose the monitor type as plugin monitors.
- Business Hours: Select the time period that is most critical to your business.
- Report Period: Specify the time period from the dropdown list. This can be selected from the last 24 hours to as long as a year back.
- Unit of Time: Choose the relevant Unit of Time based on the chosen Report Period.
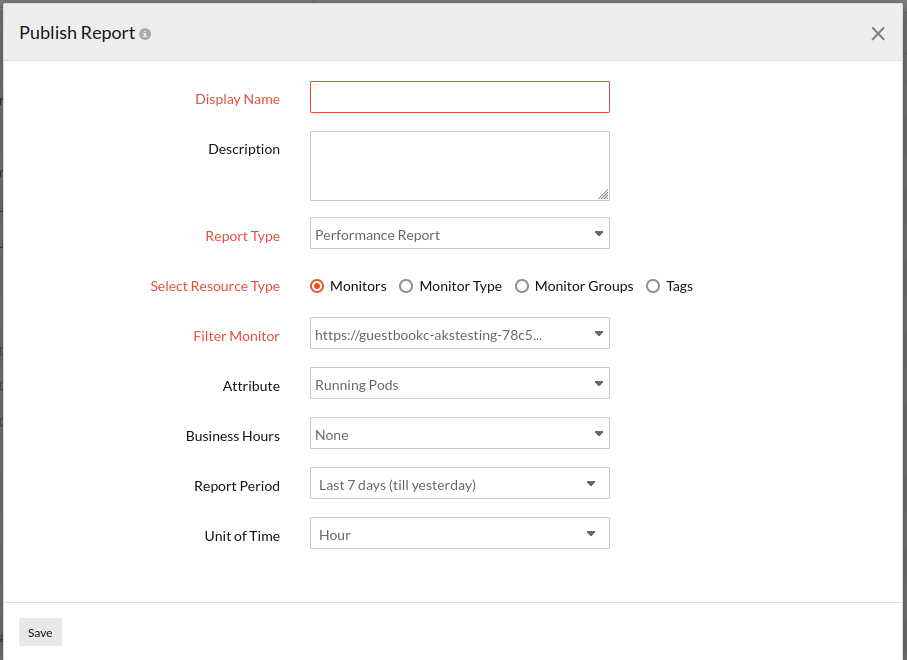
Mention the following details when Performance Report is selected:- Select Resource Type: Select the required monitors, monitor groups, or tags radio button to make the reports public. Specify the relevant Monitor(s), Monitor Group(s), Monitor Types, or Tag(s) for which the reports are to be published.
- Attribute: When you select any monitor with Attribute, upon choosing the monitor, you'll be provided with an option to choose the attributes from the drop-down menu.
- Template Name: Templates are where the attributes to be monitored are defined and every plugin will have a template associated with it. This option will be available only if you choose the monitor type as plugin monitors.
- Business Hours: Select the time period that is most critical to your business.
- Metric Aggregation: You can share the average or 95th percentile value of the captured data in your report. This option will only be shown when the resource type selected is Monitor Groups, Tags, or Monitors (with multiple monitor selection).
- Report Period: Specify the time period from the dropdown list. This can be selected from the last 24 hours to as long as a year back.
- Unit of Time: Choose the relevant Unit of Time based on the chosen Report Period.
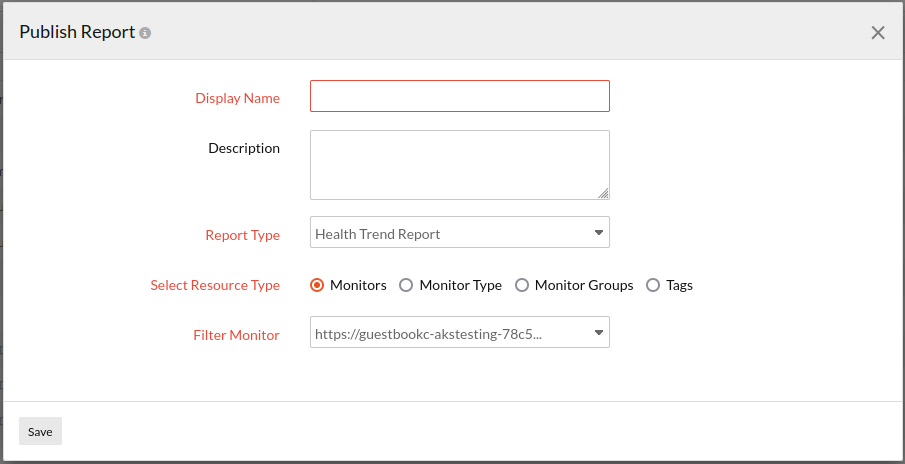
Mention the following details when Health Trend Report is selected:
- Select Resource Type: Select the required monitors, monitor groups, or tags radio button to make the reports public. Specify the relevant Monitor(s), Monitor Group(s), or Tag(s) for which the reports are to be published.
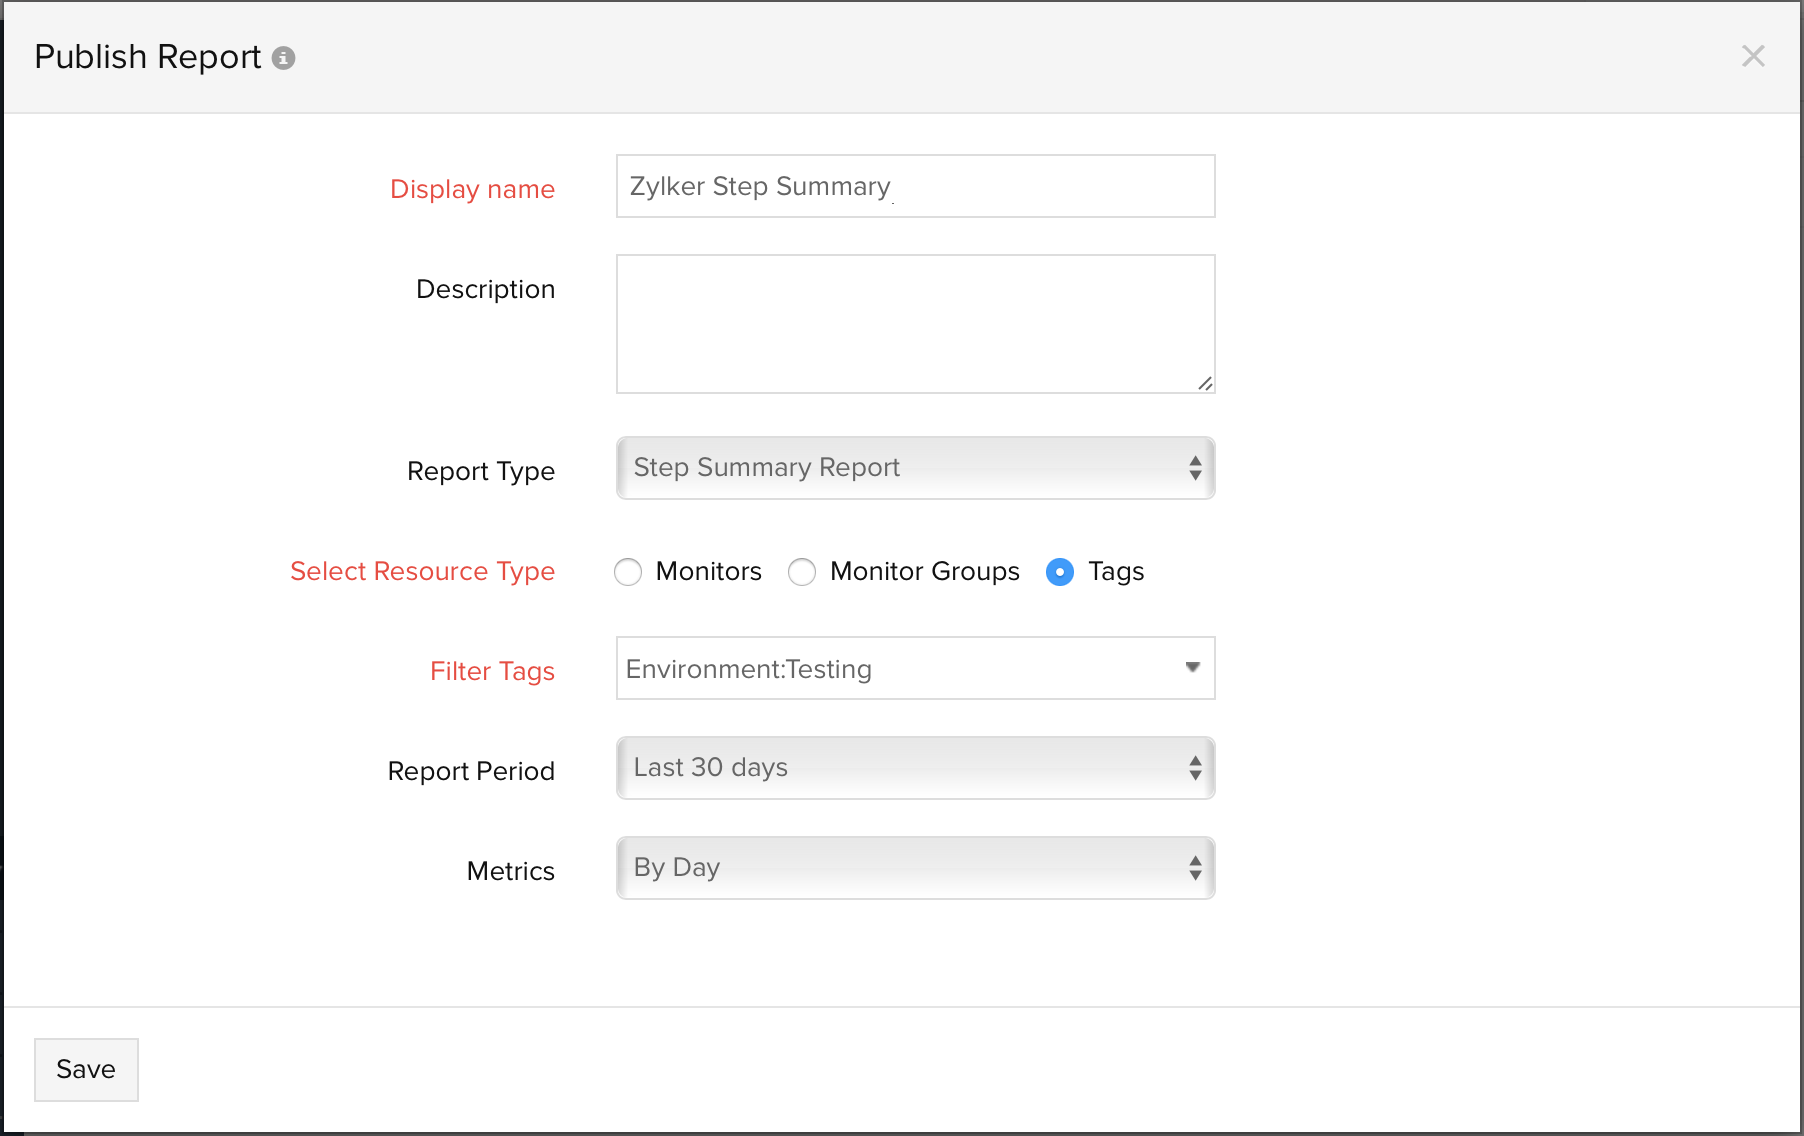
Mention the following details when the Step Summary Report is selected:
- Select Resource Type: After selecting the radio button, specify the required Web Transaction (Browser) monitor(s), Monitor Group(s) (the report will only capture data with regards to all Web Transaction (Browser) monitors in the selected Monitor Group) or the Tags (associated to the Web Transaction (Browser)) from the drop-down list to make the reports public.
- Filter Monitor: You can sort and choose a relevant Monitor or Monitor Group.
- Report Period: Choose the required time period for which the report needs to be generated.
NoteYou can generate reports for time periods ranging from last 1, 6, 12, 24 hours, today, yesterday, This week (Sunday-Today), Last week (Sun-Sat), Last 7 days, This month, Last Month, Last 30 days, and This year. You can also select a custom date range to create the report.
- Data: You can decide to render the report based on a By Day basis or an Overall basis.
- Data - By Day: You can generate a By Day report if you've selected a time range from among (This week (Sunday-Today), Last week (Sun-Sat), Last 7 days, This month, Last Month, or Last 30 days). A By Day report gives the availability % and average response time (seconds) values of the individual transactions during every single day in your specified time range.
- Data - Overall: You can generate an Overall report if you've selected a time range from among (last 24 hours, today, yesterday, This week (Sunday-Today), Last week (Sun-Sat), Last 7 days, This month, Last Month, Last 30 days, This year or Custom Period). An Overall report gives the consolidated availability % and average response time (seconds) values of the individual transactions for your specified time.
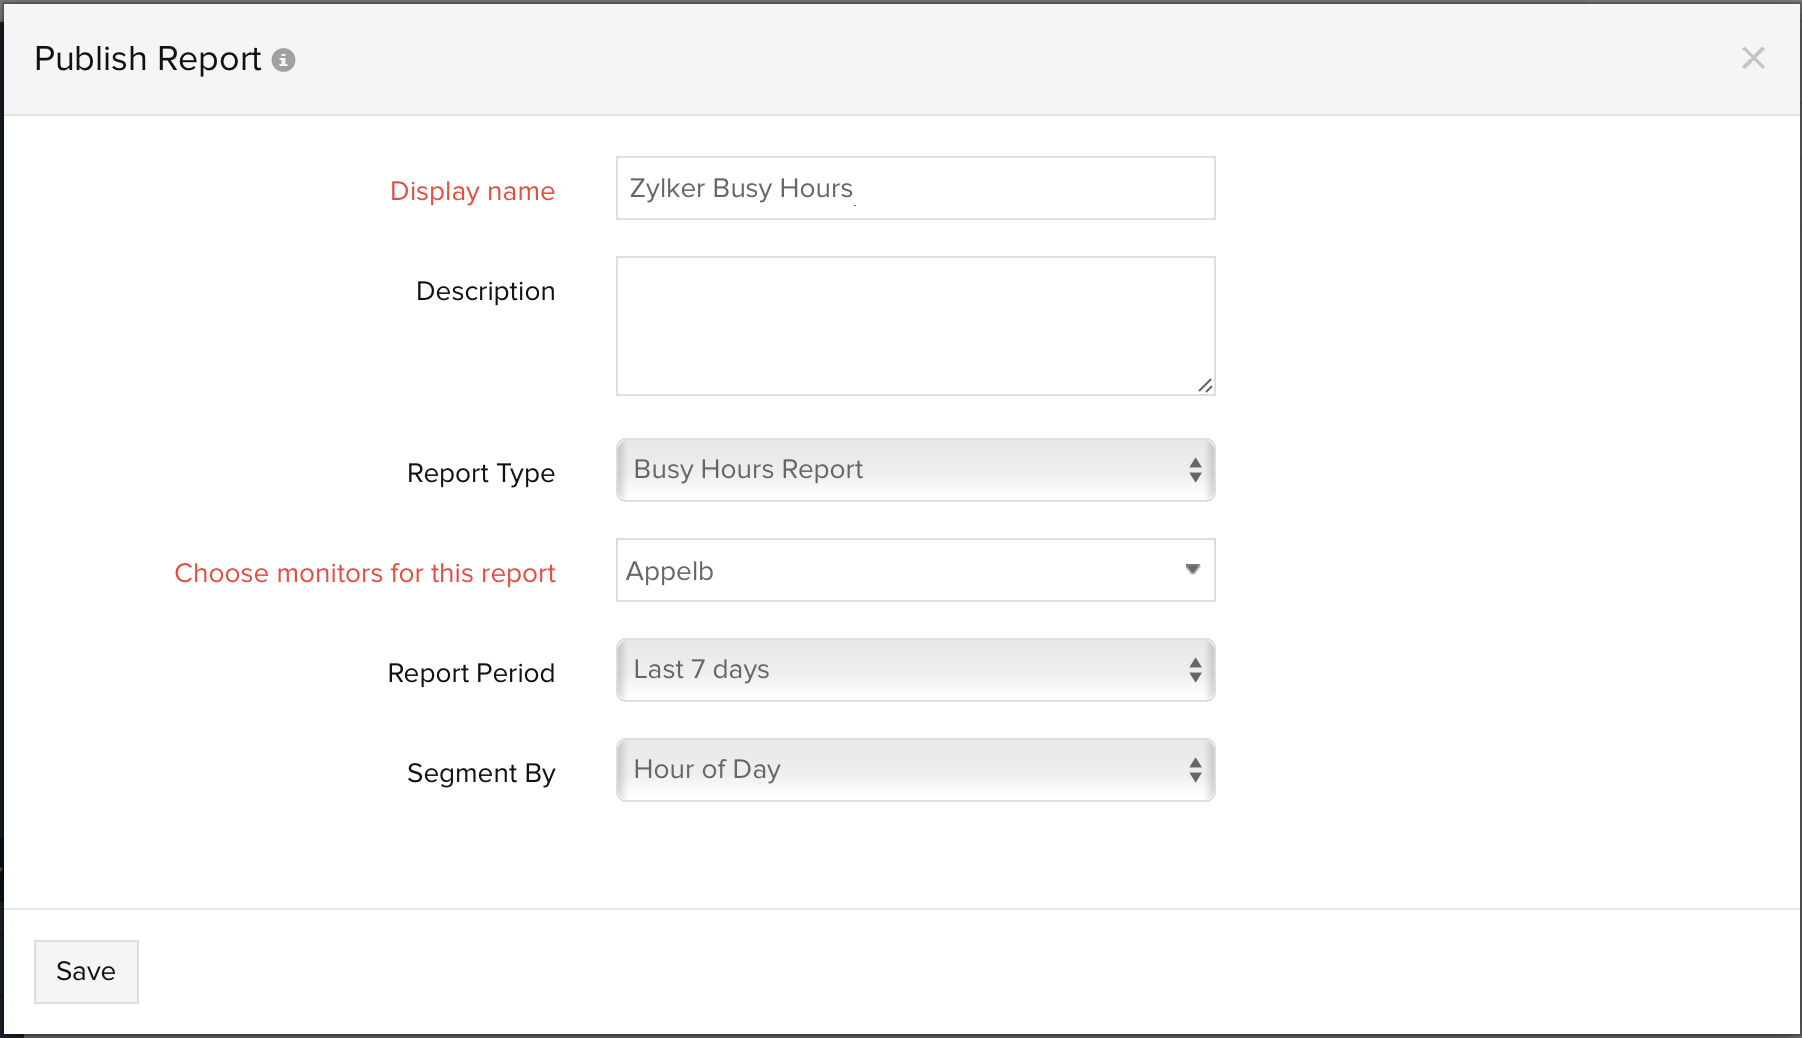
Mention the following details when Busy hours report is selected: - Choose monitors for this report: Select the required monitor from the dropdown list for to make the reports public.
- Report Period: Specify the time period from the dropdown list.
- Segment By: You can categorize the report by either by hour of the month, day, week or month.
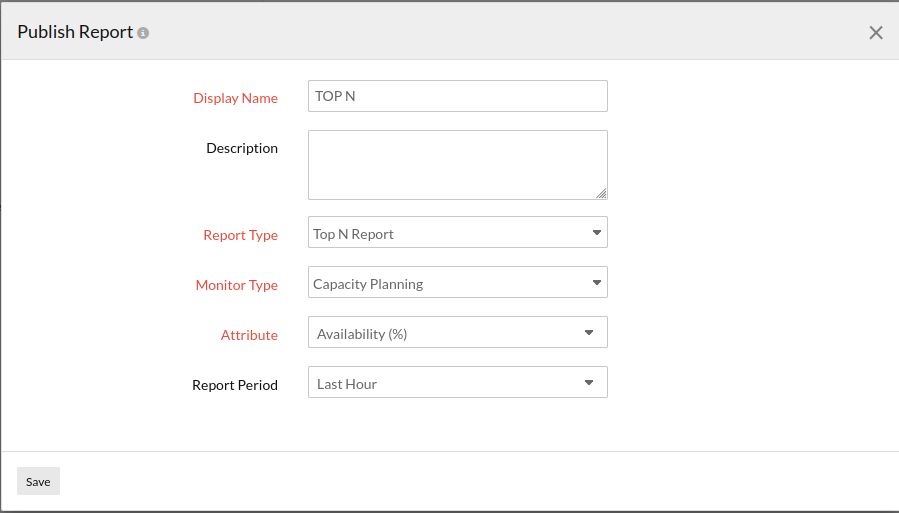
Mention the following details when Top N & Bottom N Report is selected: - Monitor Type: Select the required monitor type from the dropdown list for which the Top N Report needs to be populated.
- Attribute: When you select any monitor with Attribute, upon choosing the monitor, you'll be provided with an option to choose the attributes from the drop-down menu.
- Template Name: Templates are where the attributes to be monitored are defined and every plugin will have a template associated with it. This option will be available only if you choose the monitor type as plugin monitors.
- Report Period: Specify the time period from the dropdown list.
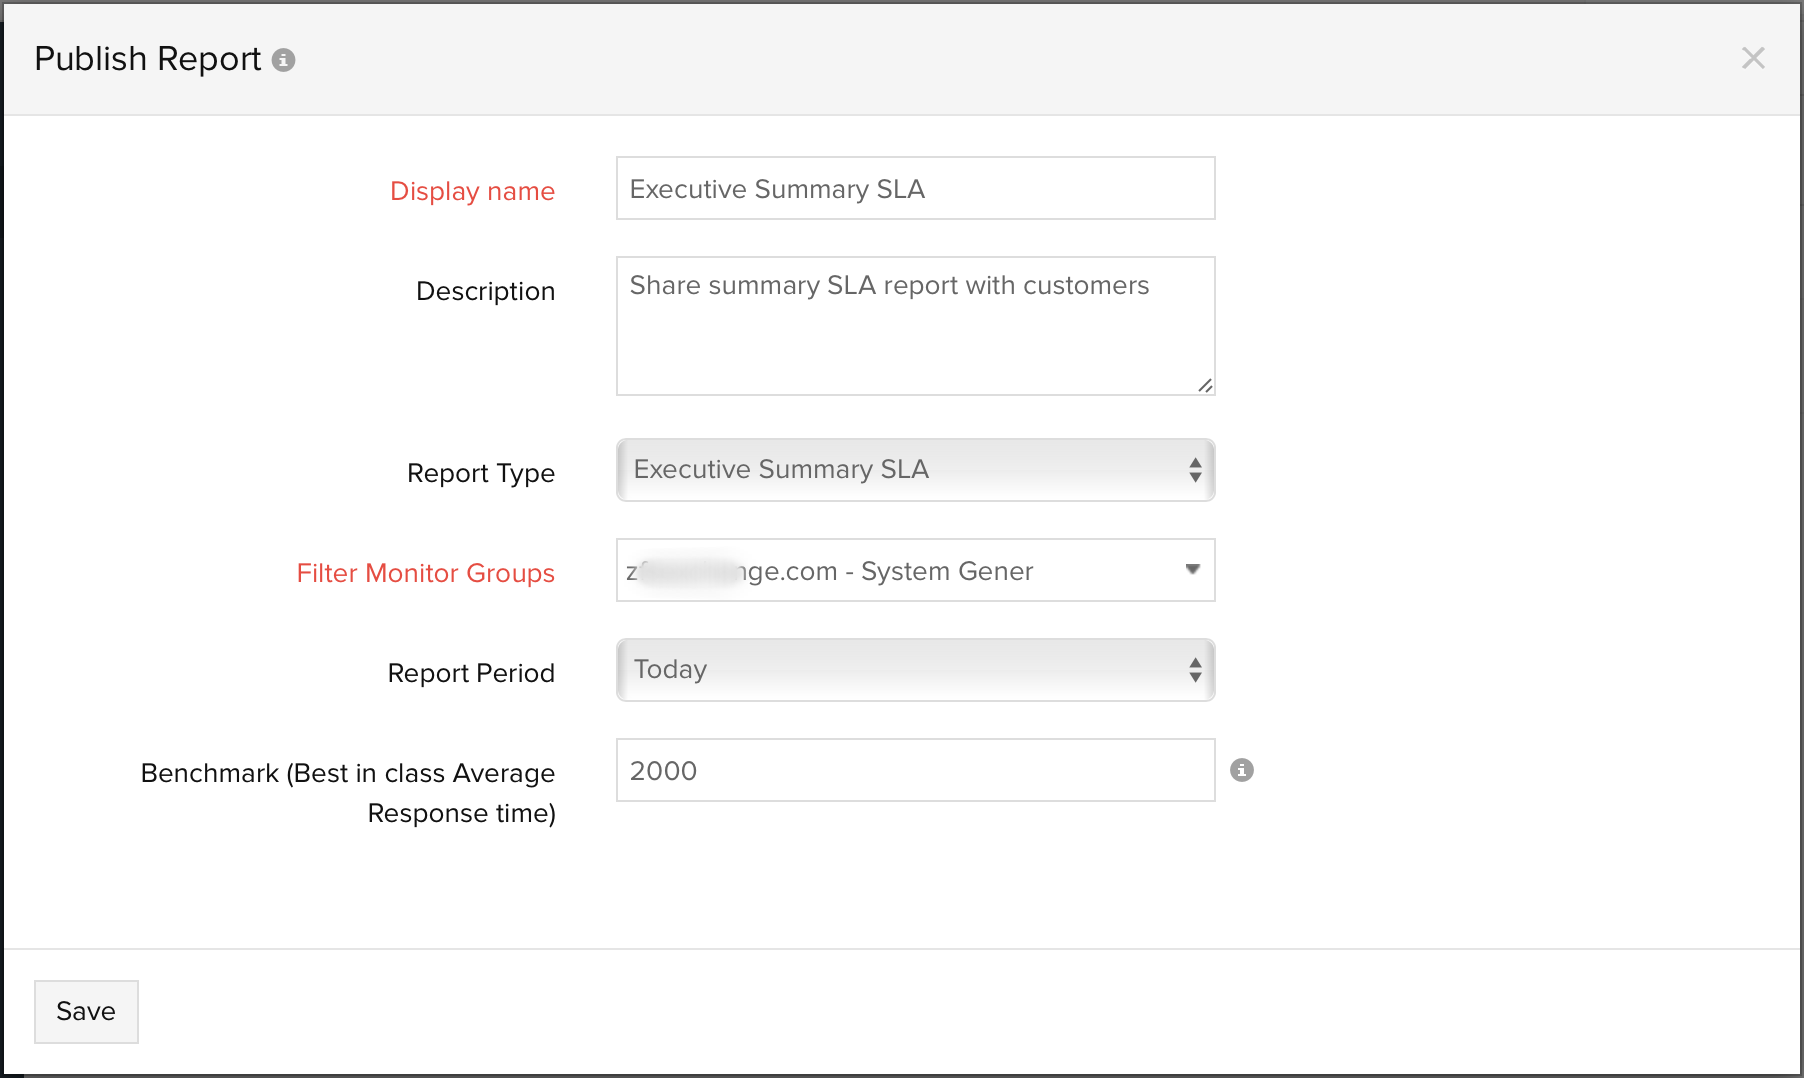
Mention the following details when Executive Summary SLA Report is selected - Filter Monitor Groups: Select the required monitor group from the dropdown list for which the Executive Summary SLA Report needs to be generated.
- Report Period: It will automatically list the preset time period, which has been defined in the Executive Summary SLA report. However, you can always modify the time period by choosing the intented period from the dropdown.
- Benchmark (Best in class Average Response Time): Specify the Response Time (in milliseconds). This value will be used as a benchmark for comparison of other monitors based on performance.
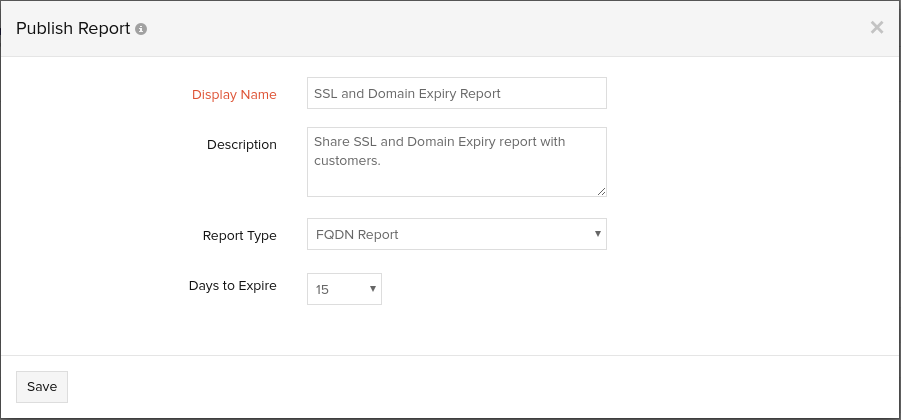
Mention the following details when SSL and Domain Expiry Report is selected:
-
Days to Expire: Choose the number of days remaining for expiry, from the range provided, to filter the monitors.
- Click Save.
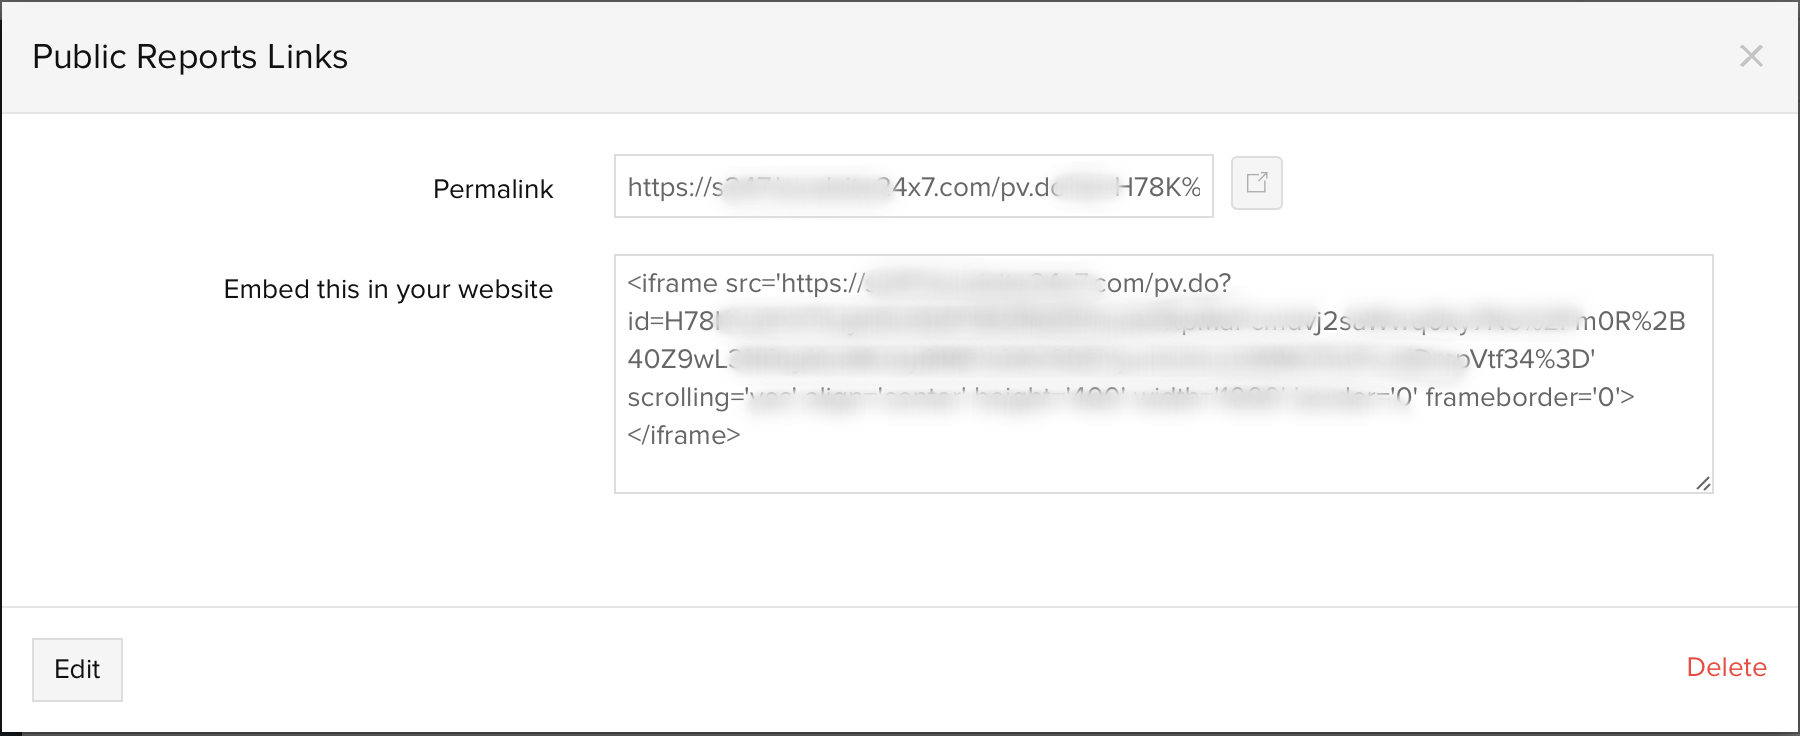
- Once saved, this will navigate to Public Reports Links window.
- To view the Public Report Links, do the following:
- Permalink: A default permalink is provided for the users. You can use this link to publish the reports.
- Embed this in your website: You can use the IFrame code and embed inside any other HTML document.
The public report created will be automatically added in Public Report screen with those already created.
A default Public Report view is also provided for the users in Public Reports screen where they can edit and publish their reports in public.
Edit Public Reports
- Click on the Public Report View which you want to edit.
- Click Edit in Public Reports Links window.
Delete Public Report
- Click on the Public Report View which you want to delete.
- Click Delete in Public Reports Links window.
-
On this page
- Add Public Reports
- Edit Public Reports
- Delete Public Report
