Site24x7 Alert Mails
Alert emails will be sent to the user group associated with the monitor status when:
- Site24x7 identifies the monitor as down.
- An attribute related to the monitor crosses the configured threshold. For instance, when the CPU usage of the server crosses 75 percent and the configured threshold is 57 percent.
- Site24x7 confirms that the identified errors have been rectified and themonitor has come back to a perfect state.
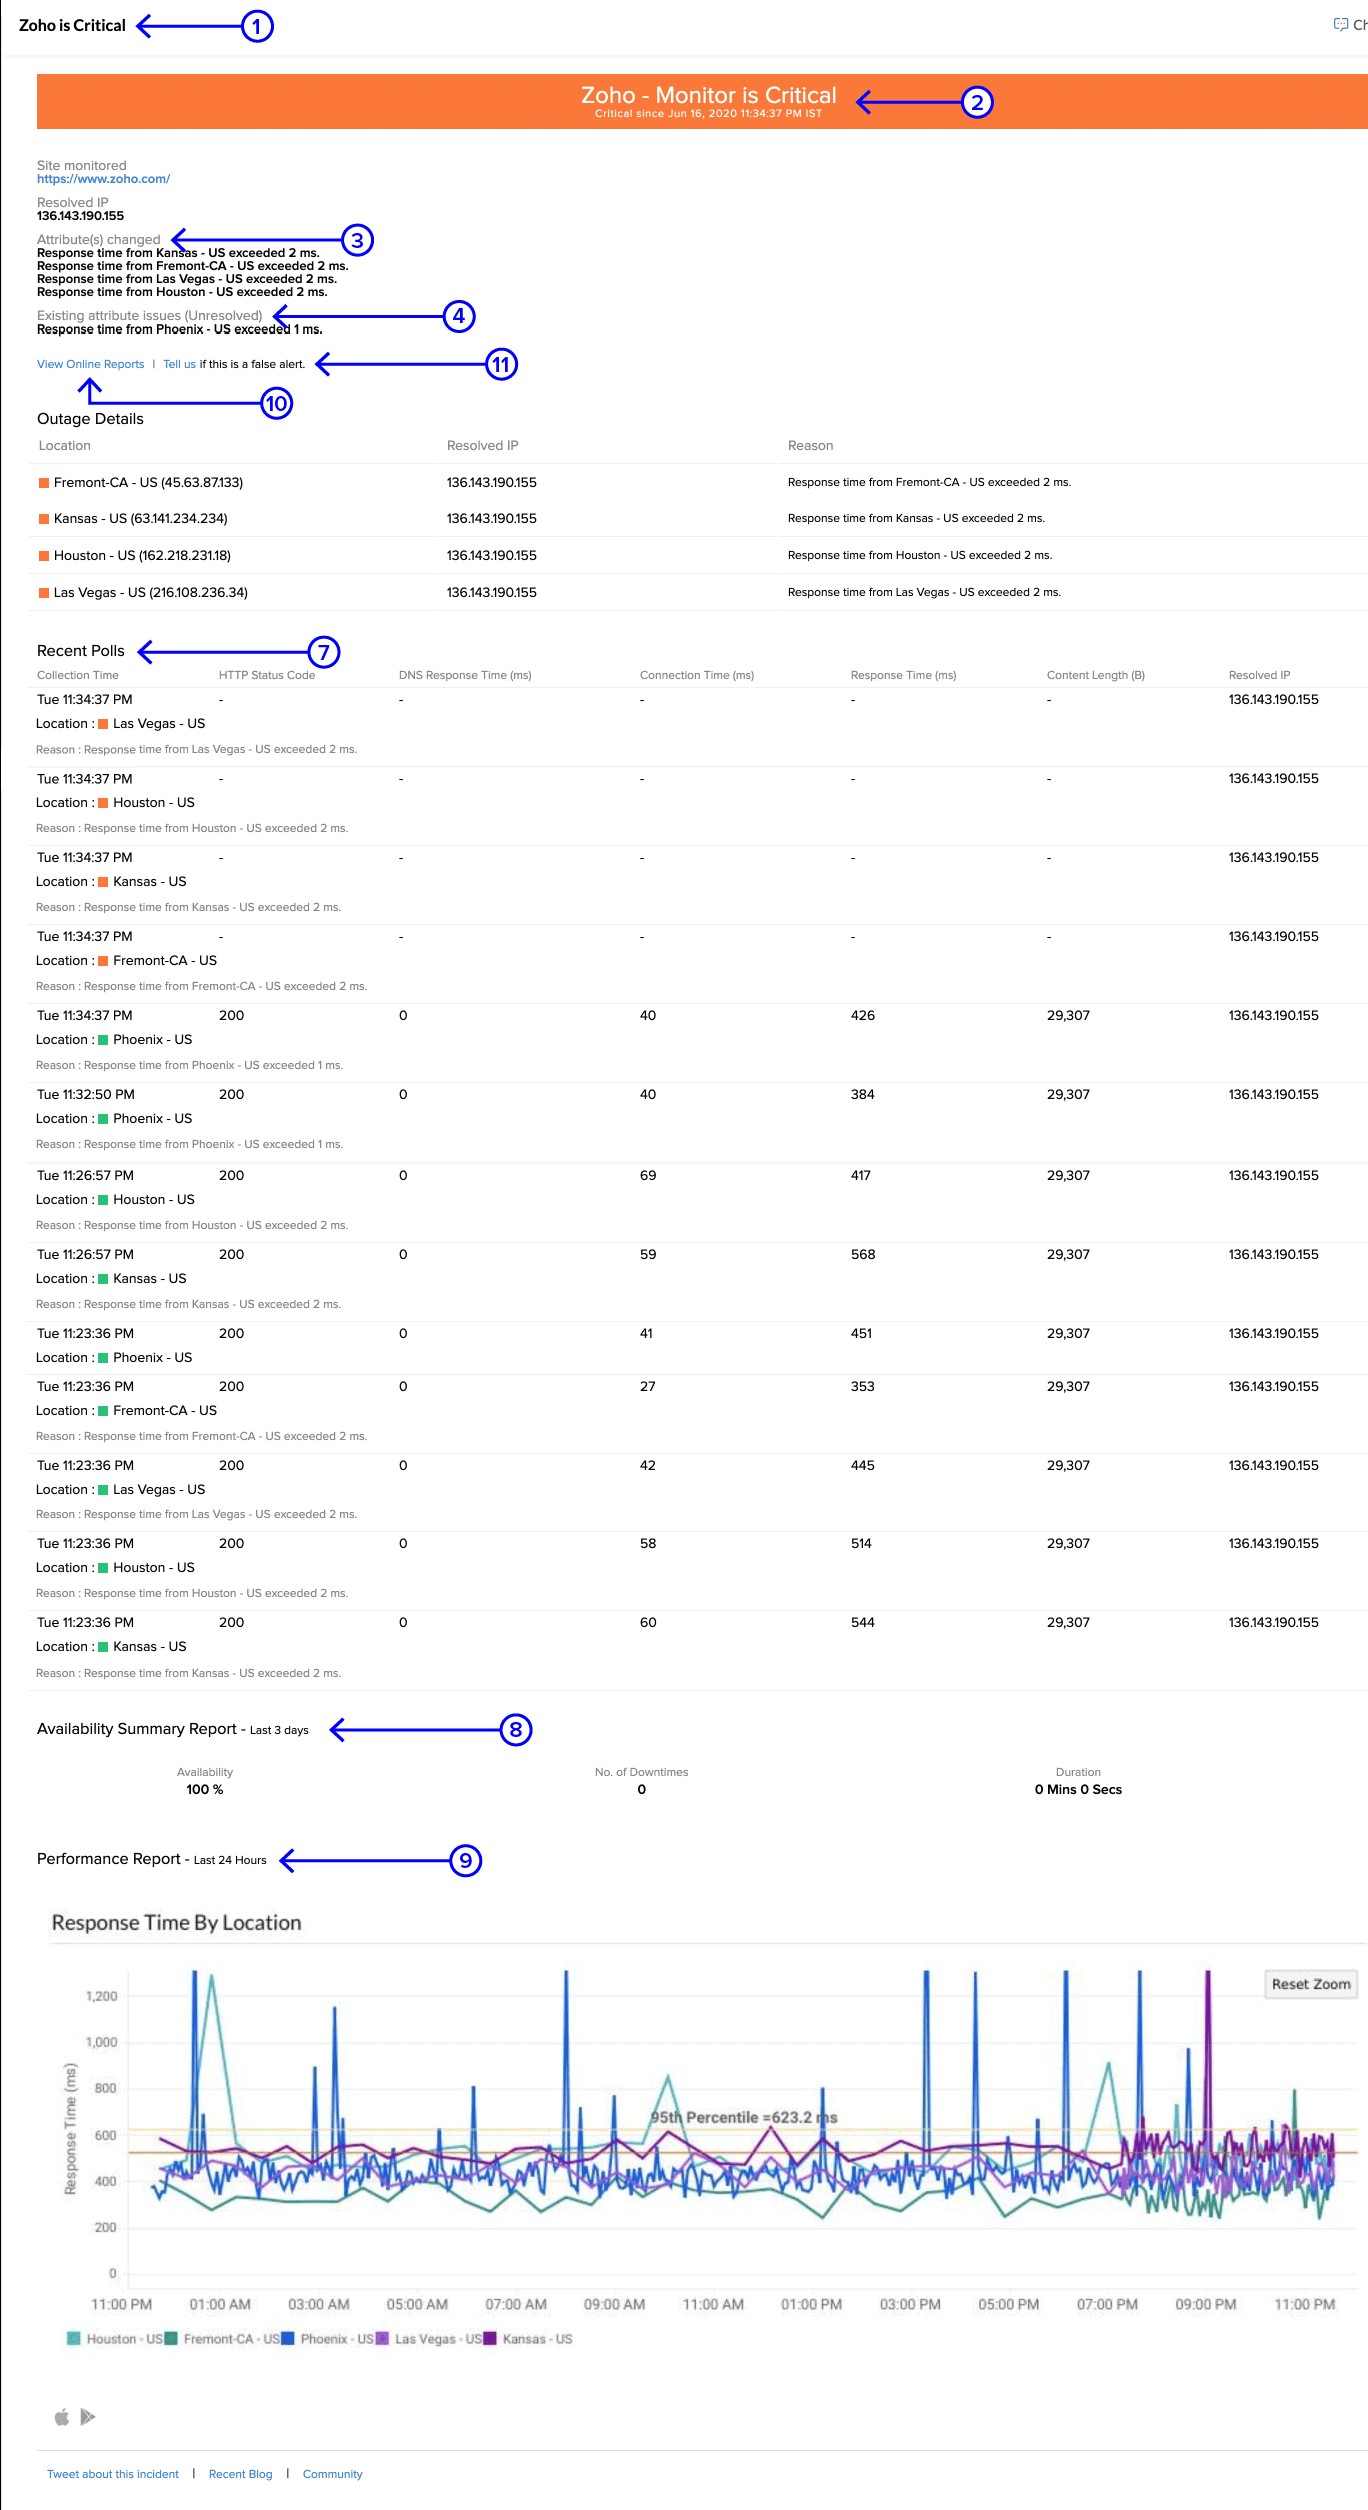
To get notifications via email, you can configure alert email settings. An alert email from Site24x7 will contain the following details:
1. Subject: The subject of the alert email will include the name of the monitor, the reason the email is being sent,and the status of the monitor.
2. The top band will have:
-
- Monitor name: The name of the resource being monitored and the reason the alert email has been triggered. Example: For APM monitors, the application name will be mentioned for application-level alert emails, and both the application name as well as the instance name will be mentioned for instance-level alert emails in place of the monitor name.
- Monitor status: The current status of the particular monitor.
- Time and date: The data collection time during which the issue was identified.
3. Attribute changed: The reason for the current failure of the monitor. For instance, when the CPU utilization of a server monitor crosses a threshold value of 90 percent, an alert email will be triggered with CPU utilization exceeds 90% as the attribute changed.

4. Existing attribute issues (unresolved): Previously identified unresolved issues will be listed as existing attribute issues. For example, say the memory usage of a server exceeds the given threshold of 90 percent, and the CPU utilization has already breached the configured value of 80 percent and has been left unresolved. In this case, the alert email sent will have Memory utilization exceeds 90% as the attribute changed, and CPU utilization exceeds 80% as the existing attribute issues(unresolved).
5. Monitor Group: The monitor group to which the particular monitor belongs to. Both the parent monitor group as well as subgroups will be listed here.
6. Tags: Tags associated with the monitor will be listed. For instance, in the case of AWS monitors, the Tags associated with the monitors will be mentioned in alert emails.
7. Recent polls: Data collected from the five recent polls, along with the time of each individual poll. This data will reflect the trend of performance metrics from the monitor to identify whether it's a slowly advancing issue or a sudden one.
8. The Availability Summary Report for the last three days. This data can be used to understand whether the status was fluctuating frequently or whether it's a new issue.
9. The Performance Report for the past three hours. This data can provide insights on whether any other associated attribute of the same resource has been raising issues recently, which might have resulted in the current performance issue or downtime.
10. View online reports: Click this option to view the public report of the monitor summary dashboard. You don't have to log in to view this.
11. Tell us if this is a false alert: You can also submit a report if you feel that the current alert is false. This page will also provide data available from Site24x7 to substantiate why the resource was confirmed as down.
The View AppLogs option will be provided in the alert email if the monitor type supports logs and if the user has enabled AppLogs.
Application Performance Monitoring (APM)
In alert emails from APM, the instance name or application name will be used instead of the monitor name.
AWS Monitoring
Alert emails related to AWS Monitoring will also include:
1. Status checks: Status checks will be included in alert emails for EC2 Instances, EC2 Auto Scaling groups, and Lightsail Instances. These help check the availability of resources.
2. Health checks: Health checks will be included in alert emails for Elastic Beanstalk. These help to verify the health of instances mapped with resources after the alert is raised.
3. Events and Cloudwatch logs: Only applicable to log-supported monitors. These help analyze the logs.
4. AWS Uptime Monitoring suggestion: If the resource is terminated within 24 hours of the monitor being added, an Uptime Monitoring suggestion will be sent along with the termination alert email.
5. IT Automation suggestion: An appropriate IT Automation suggestion will be sent along with the monitor down alert email.
Server Monitoring
In the case of alert emails for server monitors, the top process based on the CPU, service and memory usage during downtime will be included.
In alert emails related to process status change, the subject will include the process status, service and the top band will include the date and time the status changed. It will also include recent poll-related metrics for that process.
URL Monitoring
In the case of alert emails for URL Monitoring, the email will include the URL being monitored, resolved IPs, a screenshot, or the HTML response (if the monitor is down due to any anomaly in content check).
Learn how to modify the alert email content.
