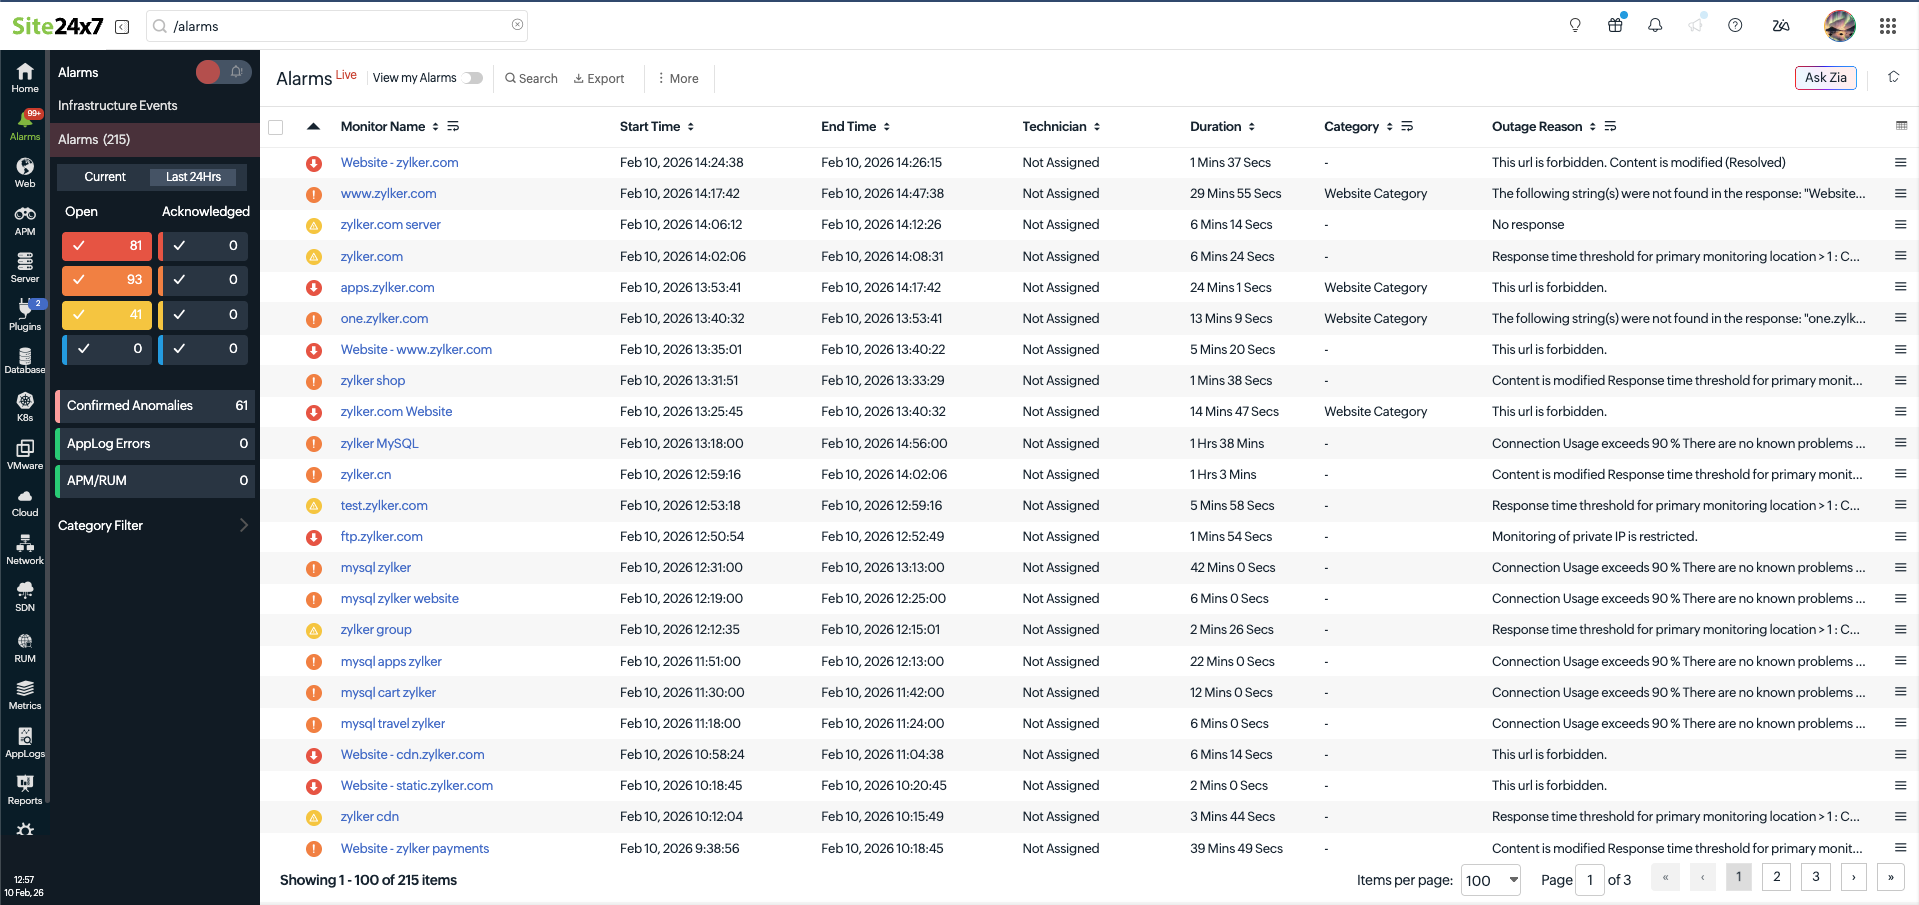
Alarms View
Alarms view in Site24x7 lets you keep a tab on all the monitor issues in your configured account by grouping all alerts by monitor name and severity. Based on the selected toggle button, i.e, Current–you can view all monitors that are currently in Down/ Critical/ Trouble status. Alternatively, you can also track all the individual monitor outages during the past 24 hours by picking the Last 24 Hours . You can manually manage the Alarms View when you've selected the Current View. Whereas, the Last 24Hrs Alarms View doesn't offer this flexibility. Incase the issue is resolved automatically or the monitor is deleted from your list–the monitor status will render itself as UP inside the monitor details page, until the next poll and the alarm will be removed from the Alarms list. Individual alarms listed in the alarms dashboard will have links to their corresponding alarm specific details page, where information is grouped into Alarm Summary, Outage history, Inventory, log report, and Alert logs for the monitor. The alarm classification based on the severity levels help you to pin-point alarms that need utmost priority and should be addressed first. Additionally, you can assign alarms to any technician according to your need.
The Operations Summary section on the left tab will give you a bird's eye view of all the important alarms you need to track. Moreover, the alarm badge count icon will help you to learn about the number of open alarms. Clicking on the card will take you to the anomaly dashboard. You can perform column selection by choosing from various available options like Last Polled, Technician, Alarm Since, Message, Tags, and Monitor groups.
In addition to all these, the alarms can also be filtered based on the alarm acknowledgement status by technicians. If you are aware of an issue in your setup for which you don't want any alerts from Site24x7, you can use 'Mute alerts' to temporarily disable alerting for a specified time duration. You can suppress alerts for a specific set of monitors, monitor groups, or even for all the resources in your account. Any outage during this time slot will have no alerts triggered (including voice, SMS, email, alerting integrations) for it. All alerts will be suppressed automatically. Nevertheless, the reason for the alerts can be still obtained from the Alert Logs control panel. You can choose Trigger Test Alerts option to receive alerts through all the notification modes you've configured for a monitor. You can also add old outages by using the Add outage option in monitor details page.
An alarm will be added when the status of a monitor changes from Up to Down/Critical/ Trouble/ Configuration error.
Access Alarms List
- Log in to your Site24x7 account.
- Click the Alarms icon listed on the dock.
NoteYou must have a Super Admin, Admin, or Operator role in your Site24x7 account, in order to be able to access and edit the Alarms tab. A Spokesperson role will have a limited view only permission. Other user roles will not have any access to the Alarms tab.
- A table list of all monitors in your account that currently shows Down/ Critical/ Trouble/Configuration Errors status alone are listed here.
- View details like individual monitor's Name, Message, Designated Technician's name, and the exact time since when the alarm is active for the monitor.
- Hover over a preferred alarm in the listing page to click on the
 icon and navigate to the respective monitor's dashboard.
 - Click the
 icon on an alarm ribbon to execute the following actions:
- Assign Technician: Choose a technician (User) from the drop-down list to designate the alarm to that user. Once this is done, click Save.
Note-
Inorder to have the technician (user) name listed in the drop-down, you must have pre-configured user profiles with relevant roles in your Site24x7 account. Learn how to create a user profile in your Site24x7 account.
-
As and when an alarm gets assigned to a technician, an email will automatically be triggered to the User Alert Group informing about this. This can be disabled and email can be sent only to the technician. Learn more.
-
When an alert gets assigned to a technician, persistent alerting (part of the notification profile) for that monitor will be automatically suppressed, unless the technician unpicks the alarm.
-
Operator role will only have options to assign a technician and schedule a maintenance. There will be no option to delete the alarm.
-
- Schedule Maintenance: If the downtime is a recurring activity due to some pre-planned maintenance, you can schedule this downtime as maintenance for a specified period. Learn how to schedule a downtime as maintenance.
- Delete: Submit Delete to remove the alarm from the list. Once the alarm is deleted, the monitor status will render itself as UP inside the monitor details page, until the next poll.
NoteAn Operator role does not have an option to delete the alarm.

- Assign Technician: Choose a technician (User) from the drop-down list to designate the alarm to that user. Once this is done, click Save.
Mute/Unmute Alerts
If you do not wish to receive alerts for an issue in your setup for a specified time duration, you can temporarily disable the alerts by selecting the relevant resources and clicking the "Mute" button. Toggle Yes to notify Super Admin and Admin users about muting the alarms.
You have the complete freedom to customize alerts muting. You have to pick the relevant resources (selected monitors, monitor groups, or all the resources in the account), select a time frame ranging from five minutes to a day and then finally provide the relevant reason for suppressing alerts before clicking the Mute button. At any point of time, you can decide to extend the mute period or even decide to unmute all the alerts. Only a Super Admin/Admin user will have the rights to mute alarms.
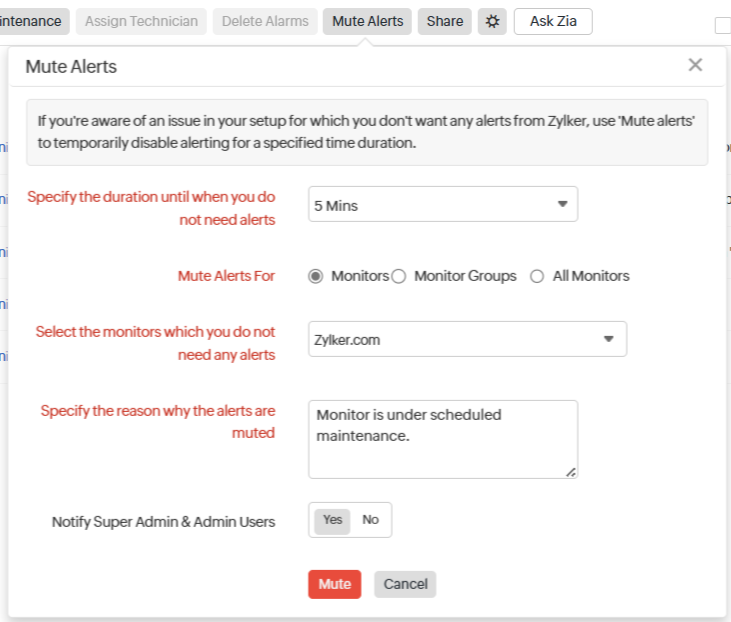

Even when all the alerts are muted, you can still view the alerting details from the Alert Logs Control Panel.

Whenever alerts are muted, the respective resources that were muted can be quickly identified using the  symbol. Additionally, the Alarms symbol in the control panel dock will also be highlighted as
  .
.
Operations Summary:
Get a holistic view of the Confirmed Anomalies, App log errors, APM / RUM, Configuration Errors, On-Premise pollers, SLA breaches, and open Incidents in StatusIQ with Operations Summary.

Actions on Alarms:
Bulk actions is aimed at saving your time by letting you schedule maintenance/assign to a technician/delete multiple monitor outages in bulk. Follow the steps below to perform bulk actions in Alarms View:
- Click the Bulk Actions > Open Bulk Actions button.
- Select all the Site24x7 monitors on which the bulk actions are to be performed. Click the checkbox listed against each Site24x7 monitor.
- Once the monitors are selected, perform any of these actions in bulk; Schedule a maintenance, Assign technician, or Delete selected monitor alerts.

Features in the alarms page:
- The alarms page can now be exported as a csv file or as PDF
- In the Alarms list, view monitor groups, tags, and configuration errors.
Filter Alarms
Quickly view the total number of alarms in your account; simultaneously, Filter alarms based on their acknowledgment and severity status. Additionally, you can filter your APM/ RUM alarms or Configuration Errors. Based on your filter selection–the alarms list will reflect the relevant set of alarms in the dashboard. Users with Super Admin, Admin, Operator, MSP Admin, or MSP Operator roles can filter your alrms using the View my Alarms option.
Current and Alarms During the Last 24 Hours
Alarms View offers two separate views based on time; you can pick the respective toggle button to view outages.
- Current : You can view all real time alarms in your account. All monitors that are in trouble/ critical/ down status are listed here. You can manage all alarms, including bulk actions, schedule maintenance, assign to technician, delete alarms, and more.
- Last 24 Hours : This view allows you to view all the individual outages for monitors that were active and resolved during the past 24 hours. You can only perform the following actions; mark as maintenance and delete the outage from the list.

Acknowledge Alarms
In addition to Current /Last 24 Hours toggle view, you can filter the real-time alarms based on their "Acknowledgement Status". All alarms those were "designated to/accepted by" Technicians are marked as Acknowledged Alarms. When an alarm gets acknowledged by a technician, all persistent notifications (configured in Notification Profile) for that monitor gets suppressed until the monitor turns UP again. However, all escalation alerts (configured in Notification Profile) wouldn't get suppressed, irrespective of being acknowledged by the technician. Those alarms that are not yet assigned to any technicians are marked as Open Alarms.
There are two different ways to acknowledge an Alarm. Below we've discussed the same:
Assign Technician:
- Click the icon on an alarm ribbon and select "Assign Technician".
- Choose a technician (User) from the drop-down list to designate the alarm to that user. Once this is done, click Save. This will assign the alarm to the technician.
Note-
Inorder to have the technician (user) name listed in the drop-down, you must have pre-configured user profiles with relevant roles in your Site24x7 account. Learn how to create a user profile in your Site24x7 account.
-
As and when an alarm gets assigned to a technician, an email will automatically be triggered to the User Alert Group informing about this. This option can be disabled and an email can be sent only to the technician. Learn more.
-
When an alert gets assigned to a technician, persistent alerting (part of the notification profile) for that monitor will be automatically suppressed, unless the technician unpicks the alarm. However, no escalation alerts will be suppressed during the same action.
-
Operator role will only have options to assign a technician and schedule a maintenance. There will be no option to delete the alarm.
-
Pick this Alarm:
- Choose a specific alarm from the alarms list and click on that alarm ribbon.
- You'll be navigated to the relevant Alarm details page.
- Press the Pick this Alarm button listed on the top of the details page to auto-designate the alarm to your name.
- Later you can click Un-pick this Alarm to remove this alarm from your list and re-delegate it to another technician by selecting a user from the Select Technician drop-down list.
Note-
Inorder to have the technician (user) name listed in the drop-down, you must configure the user profile in your Site24x7 account. Learn how to configure a user profile in your Site24x7 account.
-
As and when you pick an alarm, an email gets automatically triggered to the User Alert Group informing about this.
-
When you pick an alarm, persistent alerting (part of the notification profile) for that monitor will be automatically suppressed, unless you decide to unpick the alarm. However, no escalation alerts will be suppressed during this action.
-
Interpret Alarm Details
If you decide to click on a specific Alarm ribbon in the Alarms list, you'll be redirected to the alarm details page of that monitor, where you can gather indepth information about the downtime. The Alarm details page displays the critical reports and logs related to the monitor's downtime in a tab-like interface. Using these tabs, you can easily navigate through various sub-pages of the monitor and view your monitor's Alarm Summary, Outage history, Inventory, log report, and Alert logs for the monitor.
Press the relevant buttons listed on top of the dashboard to perform the actions listed below:
- Pick/Un-Pick this Alarm: Click this button to assign an alarm to your name. Learn how to pick up alarm.
- Mark as Maintenance: Click the Mark as Maintenance button to convert the downtime to maintenance period. On marking a specific downtime as maintenance, the alarm will be automatically removed from the Alarms list and grouped under the maintenance list in the monitor details page, until the next poll.
- Schedule Maintenance: If the downtime is a reccuring activity due to some pre-planned maintenance, you can schedule the downtime as maintenance by simply clicking this button. However, after the schedule maintenance period has ended, Site24x7 will recheck the status of the monitor. Learn how to schedule a downtime as maintenance.
- Delete: Submit Delete to remove the alarm from the list. The alarm is automatically marked as UP, and will not trigger any more notifications, until the next poll.
NoteAn Operator role does not have an option to delete the alarm.
Category Filter
Filter active alarms based on the configured categories using Category Filter. Here, you can filter, search, or add alarm categories. It shows only the categories linked to currently active alarms, not all configured ones. If you wish to add more alarm categories, click +Add Alarms Category. Learn more about alarm categories.
When you add a new category, the changes will reflect from the next data collection cycle.
Alarm Summary
Alarm Summary offers insight into your specific monitor's Alarm details, Root Cause Analysis report, and Ping Analysis report. If you've associated your monitor with a Tag, then the tag details will be listed in the summary page. Further, you can add comments or even associate your alarm to create tickets in a third-party helpdesk tool. Once integrated with the third-party tool, you can even close your tickets remotely. Under the Alarm Detailssection, you can assign Alarms to a technician by clicking the pencil
Notification Settings
Manage your notification settings by enabling or disabling the toggle button.
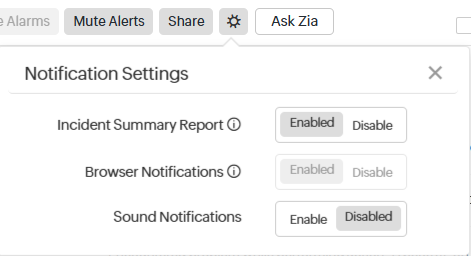
Incident Summary Report
An email, Incident Summary Report, consolidating the summary of all the incidents for the monitor along with comments added by the users will be automatically sent out to the technician and all contacts in the User Alert Group.If you do not wish to receive this email, click on the settings icon beside the Mute Alerts button and disable this preference. Disabling this preference would trigger an email only to the technician. On the other hand, if this option is enabled, an email would be sent to the technician and all the contacts in the User Alert Group. This preference can be set only by a Site24x7 Super Admin or Site24x7 Admin.
Note: There needs to be atleast one monitor incident recorded to have this mail triggered.
Browser Notifications
Enable the toggle button to receive browser notifications.
Sound Notification
Enable the toggle button to receive sound notifications.
Ask Zia
Click the Ask Zia button to connect with Zia in Site24x7.
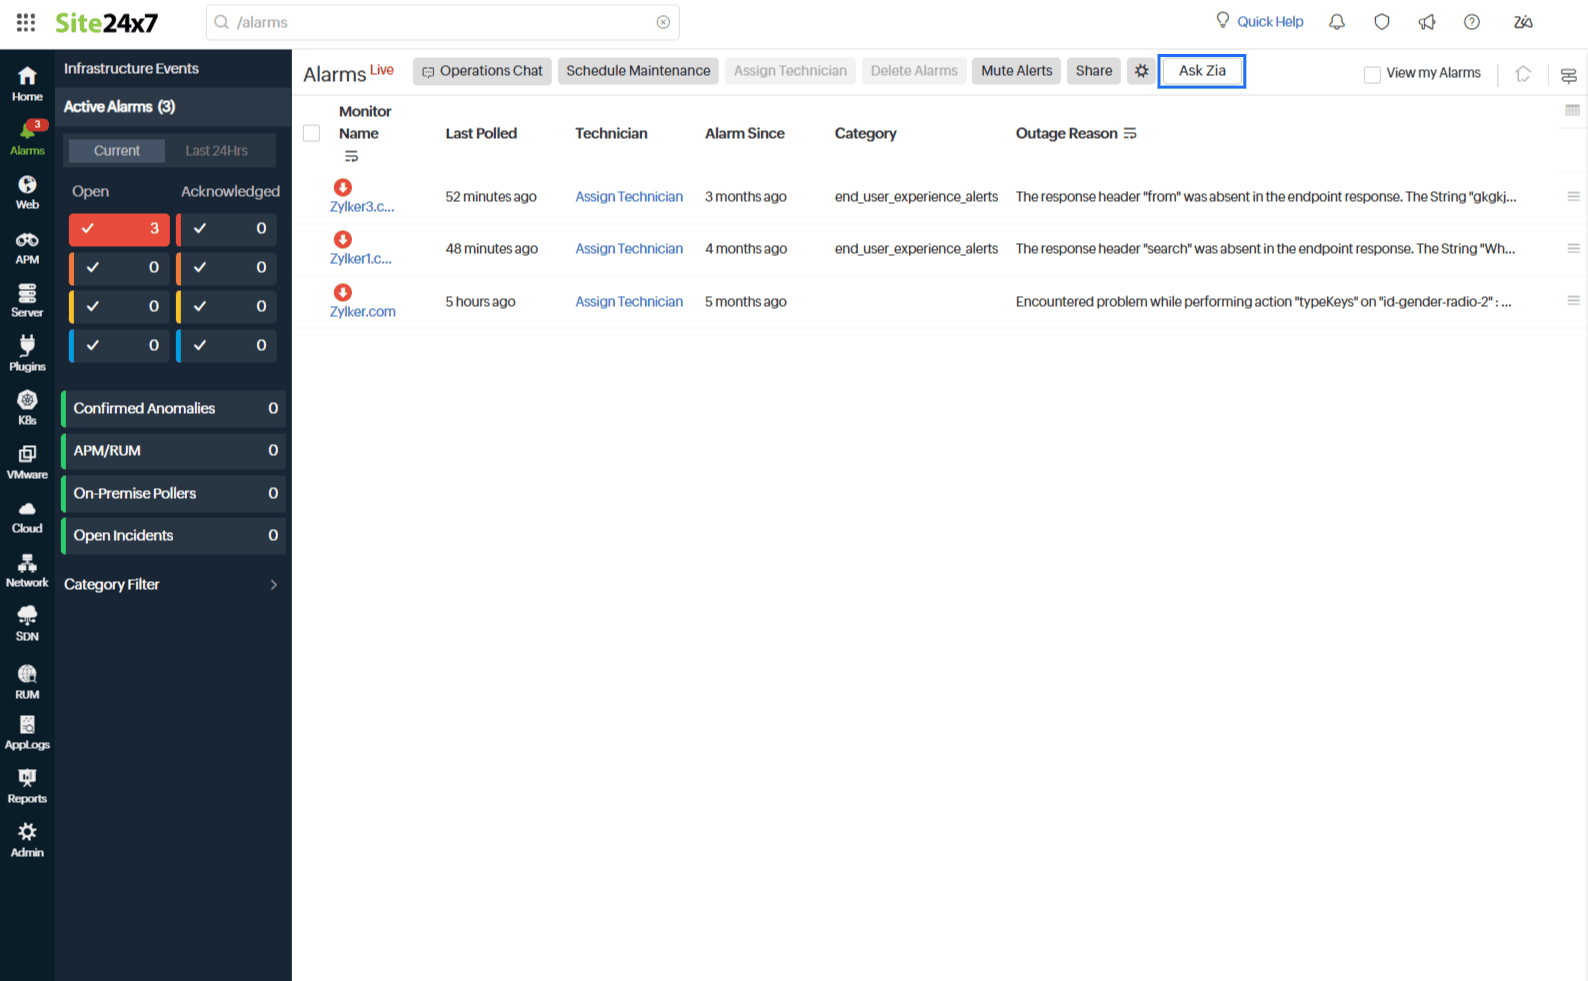
The Alarms page provides a comprehensive summary of the alarms for your monitors. It enables you to view the number of alarms for a specific monitor, analyze alarms over a specific time period, check the frequency of critical alarms for a monitor, and even access root cause analyses for past alarms. Zia consolidates this data directly from Site24x7 into a clear, actionable report.
Outage History
It offers detailed insight into the outage history of your monitor. You can view the real-time status, the exact downtime period and duration, and specific reason for the down status. You can also view detailed downtime RCA details. You can access the ![]() to edit comments and share privately, mark a maintenance as downtime, or even delete an alarm.
to edit comments and share privately, mark a maintenance as downtime, or even delete an alarm.
Inventory:
This section captures the basic monitor information and also its various configuration settings including polling locations, poll interval, associated monitor groups, threshold configurations, licensing type, and more.
Log Report:
With our integrated log records for individual monitors, you can get an indepth knowledge about the various log details for the configured monitor, over a custom time period. You can also filter the log based on location and availability. Various data including availability status, HTTP status codes, DNS response time etc. are captured here. You can also export the log report in CSV format.
Alert Logs:
Alert logs help you pip-point the exact reason for a monitor's downtime, and provide details about alert emails sent to your contacts.
Incident Collaboration
Site24x7 Incident Collaboration helps you track, discuss, and take action on incidents related to your resources monitored by Site24x7. To resolve incidents faster and make decisions instantly, you can add users and create chat groups or chatlets for any of the monitors or monitor groups.
You can make your incident collaboration process easier with:
- Incident Chats
- Site24x7 bot
Incident Chats
Incident chats let you discuss and take action for ongoing incidents related to your resources. Site24x7 provides three options under Incident Chats at, monitor and monitor group level, account level, and in alarms page:
1. Monitor and Monitor Group level
Incident chats will be created at monitor group level by default, when the monitor is associated with any group. If the monitor isn't associated with any group chat will be created at monitor level. When a Monitor is in Trouble, Critical, or Down status, a card will be created in the chat window with the date and time of the incident.
You can create Monitor Groups to logically group related monitors in your environment. When a monitor is associated with more than one monitor group, the first monitor group will be picked and an incident chat will be opened for that.

Figure 1: Click on the incident chat button to open the monitor group associated with the monitor.
2. Account level or Operations Chat
Operations chat allow Site24x7 super admins, admins, operators, and especially NOC Teams or IT Operations Managers to interact with each other at Site24x7 account level anytime from anywhere. To access the Operations chat, navigate to Alarms > Operations Chat.
When an Operations chat is clicked for the first time all the available users with Super Admin/Admin/Operator roles will be added as participants to the chat. When a new user is added with any of the above mentioned roles, the user will be automatically added as a participant in the operations chat.

Figure 2: In Operations Chat, account level discussions can be carried out.
You can use audio, video calls, or the conference option to communicate by navigating to the Incident Chat > Actions > Open in Cliq > Audio call, video call / Broadcast.

Figure 3: To initiate an audio, video, or conference call in an Incident group use the option Actions and choose Open in Cliq.

Figure 4: Make audio or video calls, or conference calls via Zoho Cliq.
3. Anomaly Dashboard
You can also access Incidents chats in the Anomaly History section, by navigating to Home > Anomaly Dashboard.

Figure 5: Use incident chats in the Anomaly Dashboard to discuss anomalies.
Site24x7 Bot
Zoho Cliq extension for Site24x7 is a bot that helps you to keep a track of the availability and performance of your resources in Site24x7 from Cliq. It uses natural language processing (NLP) technology. By enabling Site24x7 Bots, you can easily interact with Site24x7's monitoring services using dialogue inputs and fetch monitoring results with ease without actually having to access the Site24x7 web client. You can interact with bots in private chats and channels within a team.
The actions available in the card are Assign technician and Mark as Maintenance. You can assign an issue to a technician from the Alarms page as well, by clicking on the Assign technician link next to an alarm. A notification will be sent to the technician once an issue is assigned. You can perform the associated actions only if you've enabled the bot.
1. Monitor Status
After logging into your Site24x7 account, you can query the Site24x7 bot to find the actual operational status, (i.e., UP, DOWN, TROUBLE) of the monitors. You can ask the current status for all monitors, monitor names, and monitor group name.
2. Availability Summary
You can use the conditions to ask and fetch the availability summary details of your monitor names or monitor group names for a specific time period of your choice.
3. Outages
You can ask the Site24x7 bot to fetch the outage of monitors, monitors in specific monitor groups and monitor types for a specified time. The response will contain all the monitor outages for the day.
4. Performance Report
You can ask the bot to fetch the performance of monitors, monitor groups, or monitor type for a specified time period. When you haven't specified the time period, the response will showcase the last hour data, by default.
5. Root Cause Analysis (RCA) Report
When you ask the Site24x7 bot to view the RCA report for a monitor name, the response will include RCA details and an RCA permalink.
6. SLA Report
Ask the Site24x7 bot to fetch the SLA settings of all the monitors, monitor name, and monitor group name. Only availability and response time SLA details are supported and not the composite SLA details. The SLA details will additionally show the business hours selection, if associated with the monitor.
7. Alarms
You can request Site24x7 bot to remotely perform actions such as gather information of the top 10 acknowledged or unacknowledged alarms.
Learn more about Zoho Cliq integration.
You can avail Incident chat option in Site24x7 mobile application too.
If you wish to disable incident chat, navigate to Admin > Control Panel Settings in Site24x7 web client. Choose No using the toggle button next to Activate Incident Chats to stop viewing the incident chat option in all supported places. When the Site24x7 bot is disabled, you'll not be able to receive alert notifications via Cliq or perform any related actions provided in the alert card or use the bot commands, but will still be able to interact with your team using incident chats.