APM Insight Alerts
Configure APM Insight alerts to get notified when the status of your monitor changes to Trouble/Critical/Down. Threshold values can only be configured at the application level and cannot be configured separately for each instance. Configurations made at the application level are also applied to instances. Click here to know more.
Classification of alerts
APM Insight alerts are classified as Trouble, Critical, and Down. When your application exceeds specified threshold values, you will receive alerts based on the threshold configuration of the respective application.
Example:
Let's say your application has four instances.
- Your application will be marked as Down only if all four instances are down.
- Your application will be marked as Trouble/Critical on comparing the configured threshold value with the aggregation of all of your application's instances.
- You will also receive an Up alert when the corresponding application/instance is up.
Note
- Down alerts are applicable only for non-cloud monitors. By default, the Down alert is disabled. You can enable Down alert by changing it in the configuration profile. Learn more.
- The Up alerts will be triggered only if the down alert configuration is enabled.
To configure threshold values
- Log in to your Site24x7 account.
- Navigate to Site24x7 control panel > APM.
- Hover over the application's hamburger icon (
 ) and click Edit.
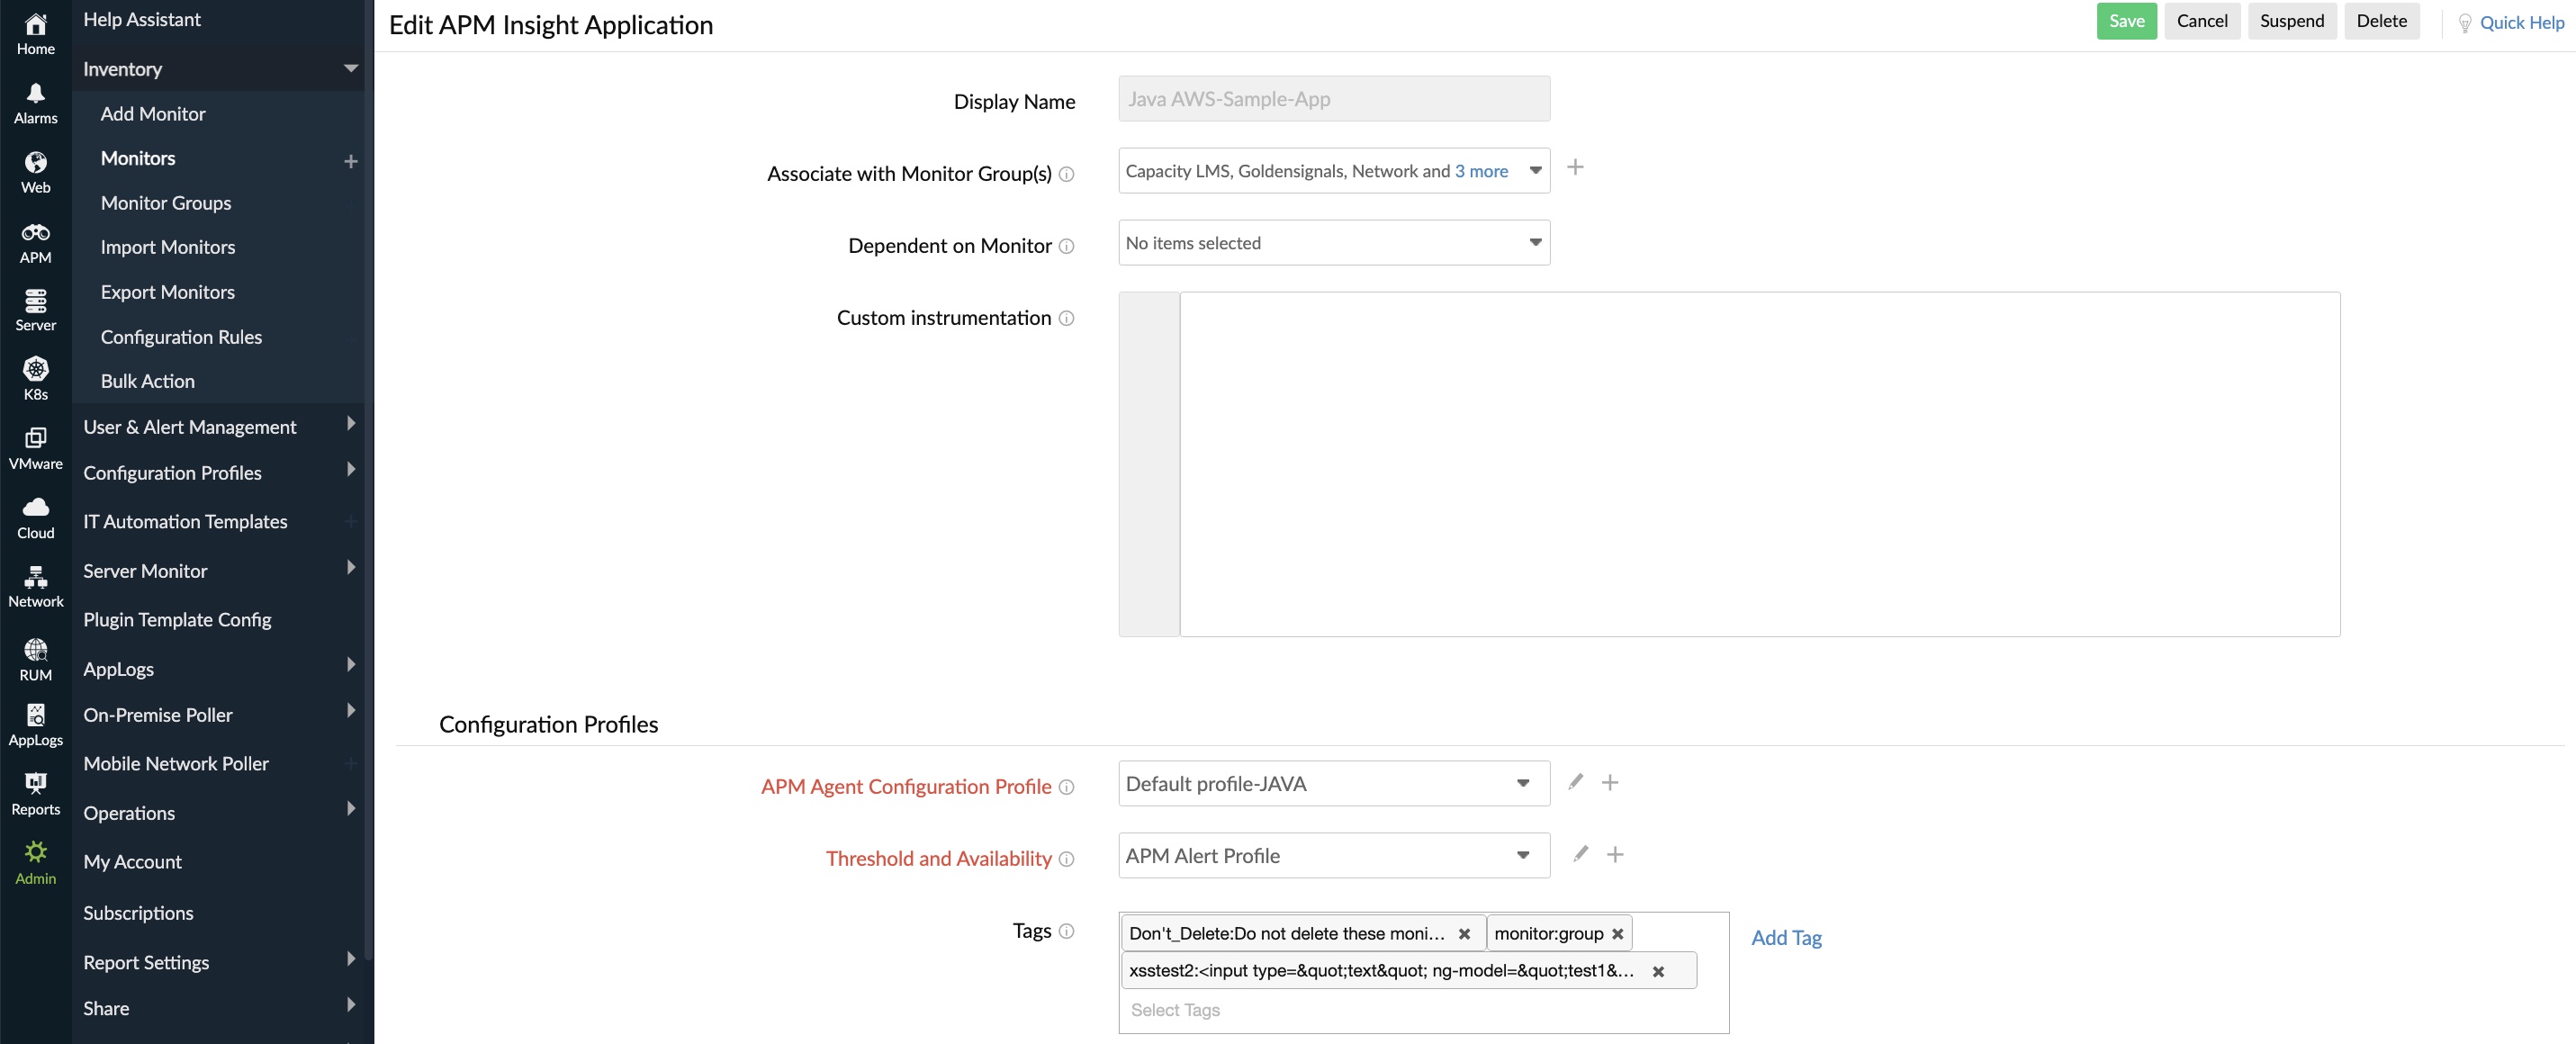
- Threshold and Availability:
Note
- To modify the existing threshold values, click on the edit icon.
- To associate a new threshold profile to an application/instance, click on the (+) icon.
- Static Threshold: From the drop-down menu, choose the desired metrics for which thresholds need to be configured. Enter a value specific to the unit, and set the threshold conditions (<, <=, =, >, or >=) and the monitor state (to be notified as) for each metric. You'll receive alerts when these threshold conditions are violated.
- Zia-based Threshold: The Zia-based Threshold tracks the abnormal spikes using anomaly detection and offer a dynamic threshold that will be updated accordingly. If you choose the Zia-based threshold, select the associated anomaly severity and the status accordingly.

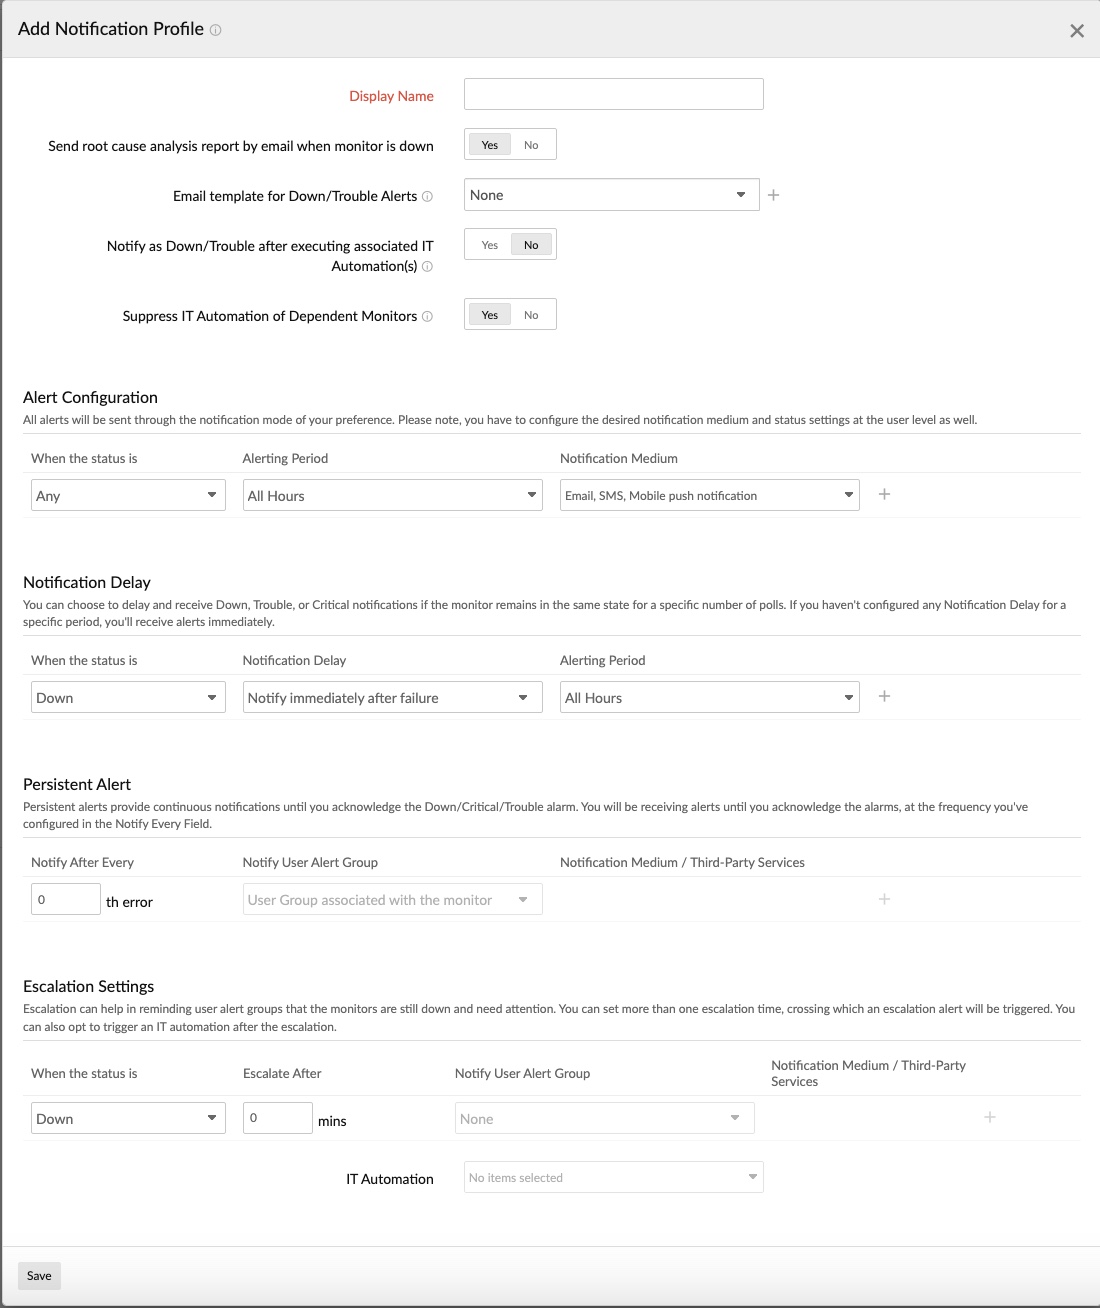
To configure alert notifications
- Log in to your Site24x7 account.
- Navigate to Site24x7 control panel > APM.
- Hover over the application's hamburger icon () and click Edit.
- Click on the edit option in the Notification Profile field option to modify the alert configurations.
- To add a new notification profile, click on the (+) icon.
List of metrics supported
- Apdex score
- Average Response Time
- Error rate
- Request count
- Error count
- Throughput
- Exception count
- Request count deviation
- JVM CPU usage
- Live thread count
- Heap memory usage
- GC time
- GC count
- NodeVM CPU usage
- NodeVM Heap memory usage
- NodeVM GC PauseTime
- NodeVM GC PauseFrequency
- Active instance count
- Trouble instance count
- Critical instance count
- Down instance count
- Suspended instance count
- Trouble instance percentage
- Critical instance percentage
- Down instance percentage
- Suspended instance percentage
- Satisfied requests percentage
- Tolerating requests percentage
- Frustrated requests percentage
Related articles
Threshold and availability for application performance monitor