HTTP Calls
The HTTP Calls data provides useful insights into network requests made by users. It also provides information on response codes, request types for all network requests, and the total number of requests made across all platforms by count and percentage.
To view HTTP Calls:
1. Log in to your Site24x7 account > APM > Mobile APM.
2. Go to your application > HTTP Calls to see graph views of the overall Response Time and Throughput as well as HTTP Metrics.
The HTTP Metrics section displays pie charts for Request Methods, Response Codes, and Platform.

Figure 1: Graph views of overall Response Time and Throughput; list of screens.
The list of HTTP calls made by users is also shown below along with their respective metrics: Average Response Time, Total Count, Throughput, and response codes and their counts.

Figure 2: List of HTTP calls.
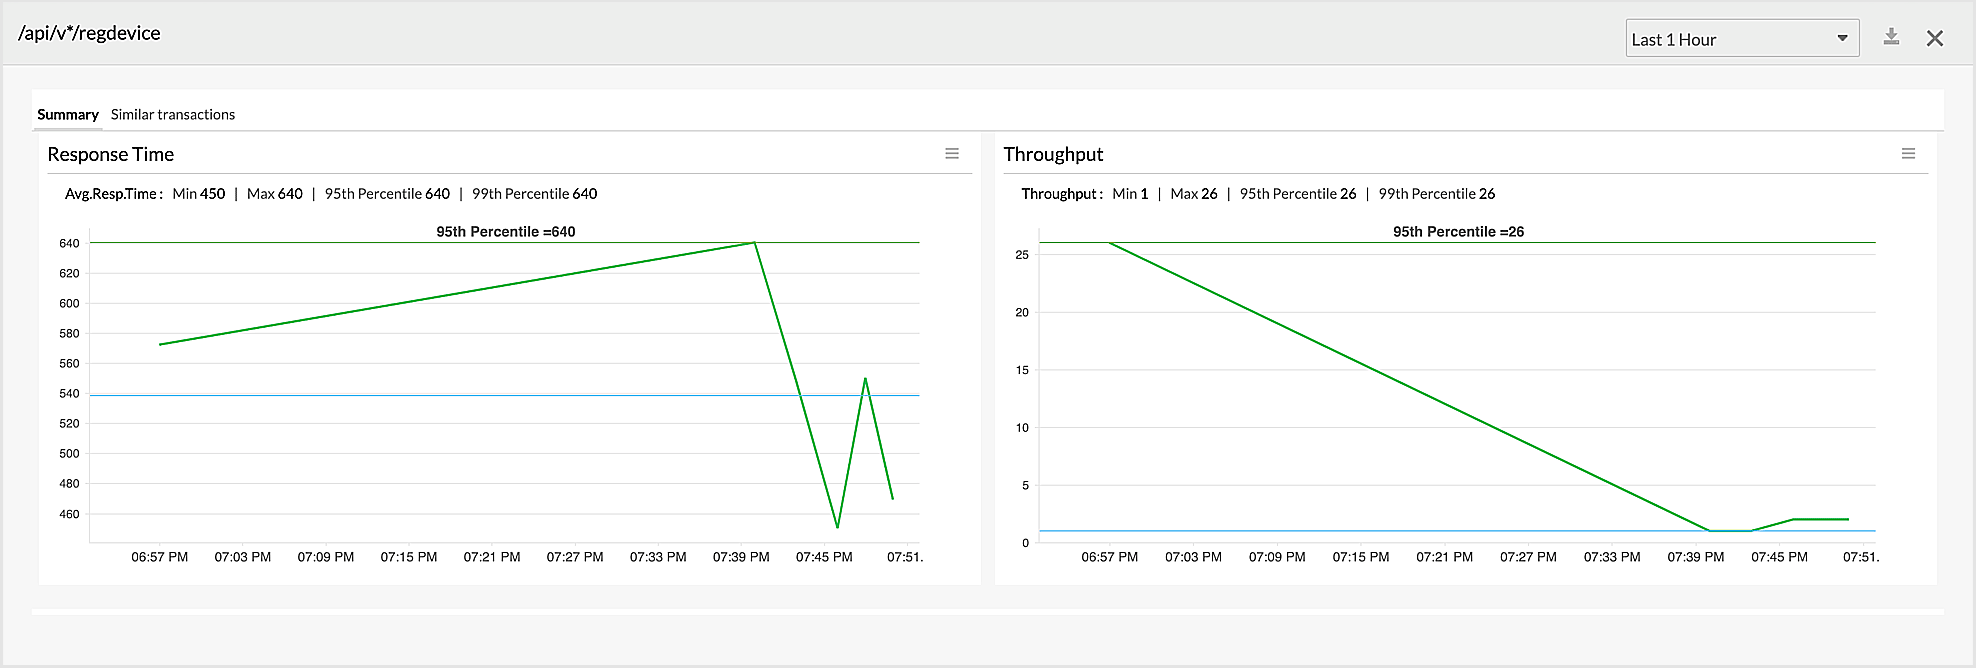
3. When you click any HTTP call, a pop-up screen appears where the Response Time and Throughput graphs for that HTTP call are displayed under the Summary tab, and HTTP calls with similar URL paths as this HTTP call are displayed under the Similar transactions tab.

Figure 3: Summary tab.

Figure 4: Similar transactions tab.
