Time range for viewing APM Insight metrics
You can view your application metrics for a time period ranging from the last 30 minutes to 30 days.
There are three views by which you can view these metrics:
- Date view
- Compare view
- Milestone view
Date view
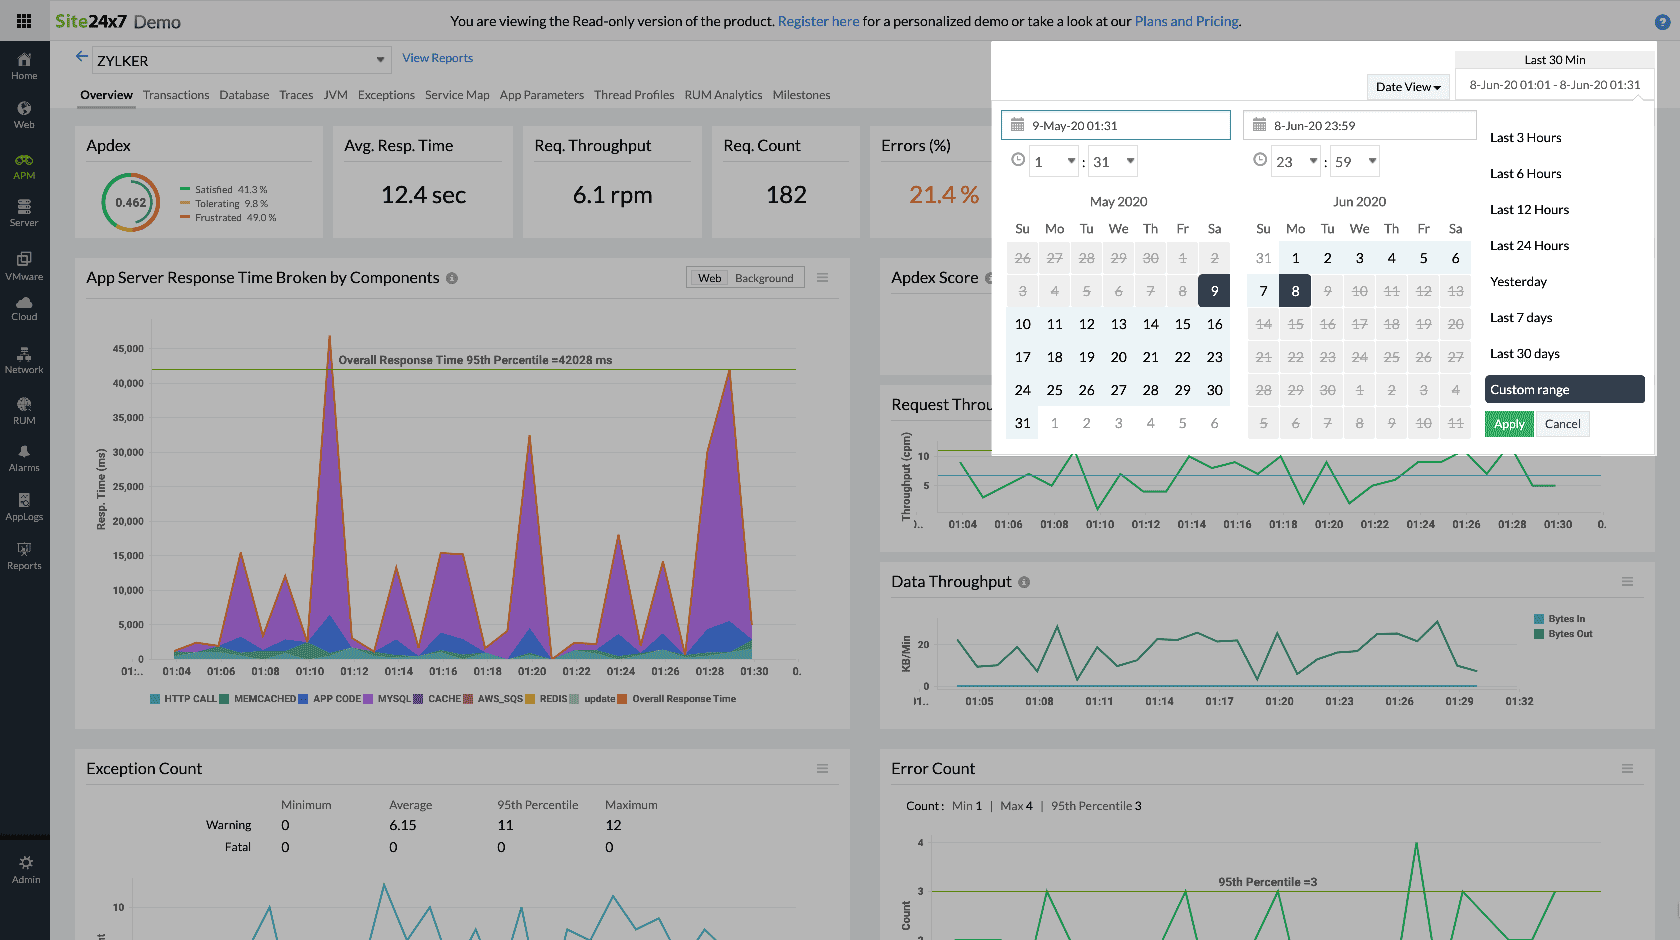
In date view, you can view your application metrics from last 30 minutes to last 30 days. You can also choose a custom range and time in between 30 days and analyze the metrics
Compare view
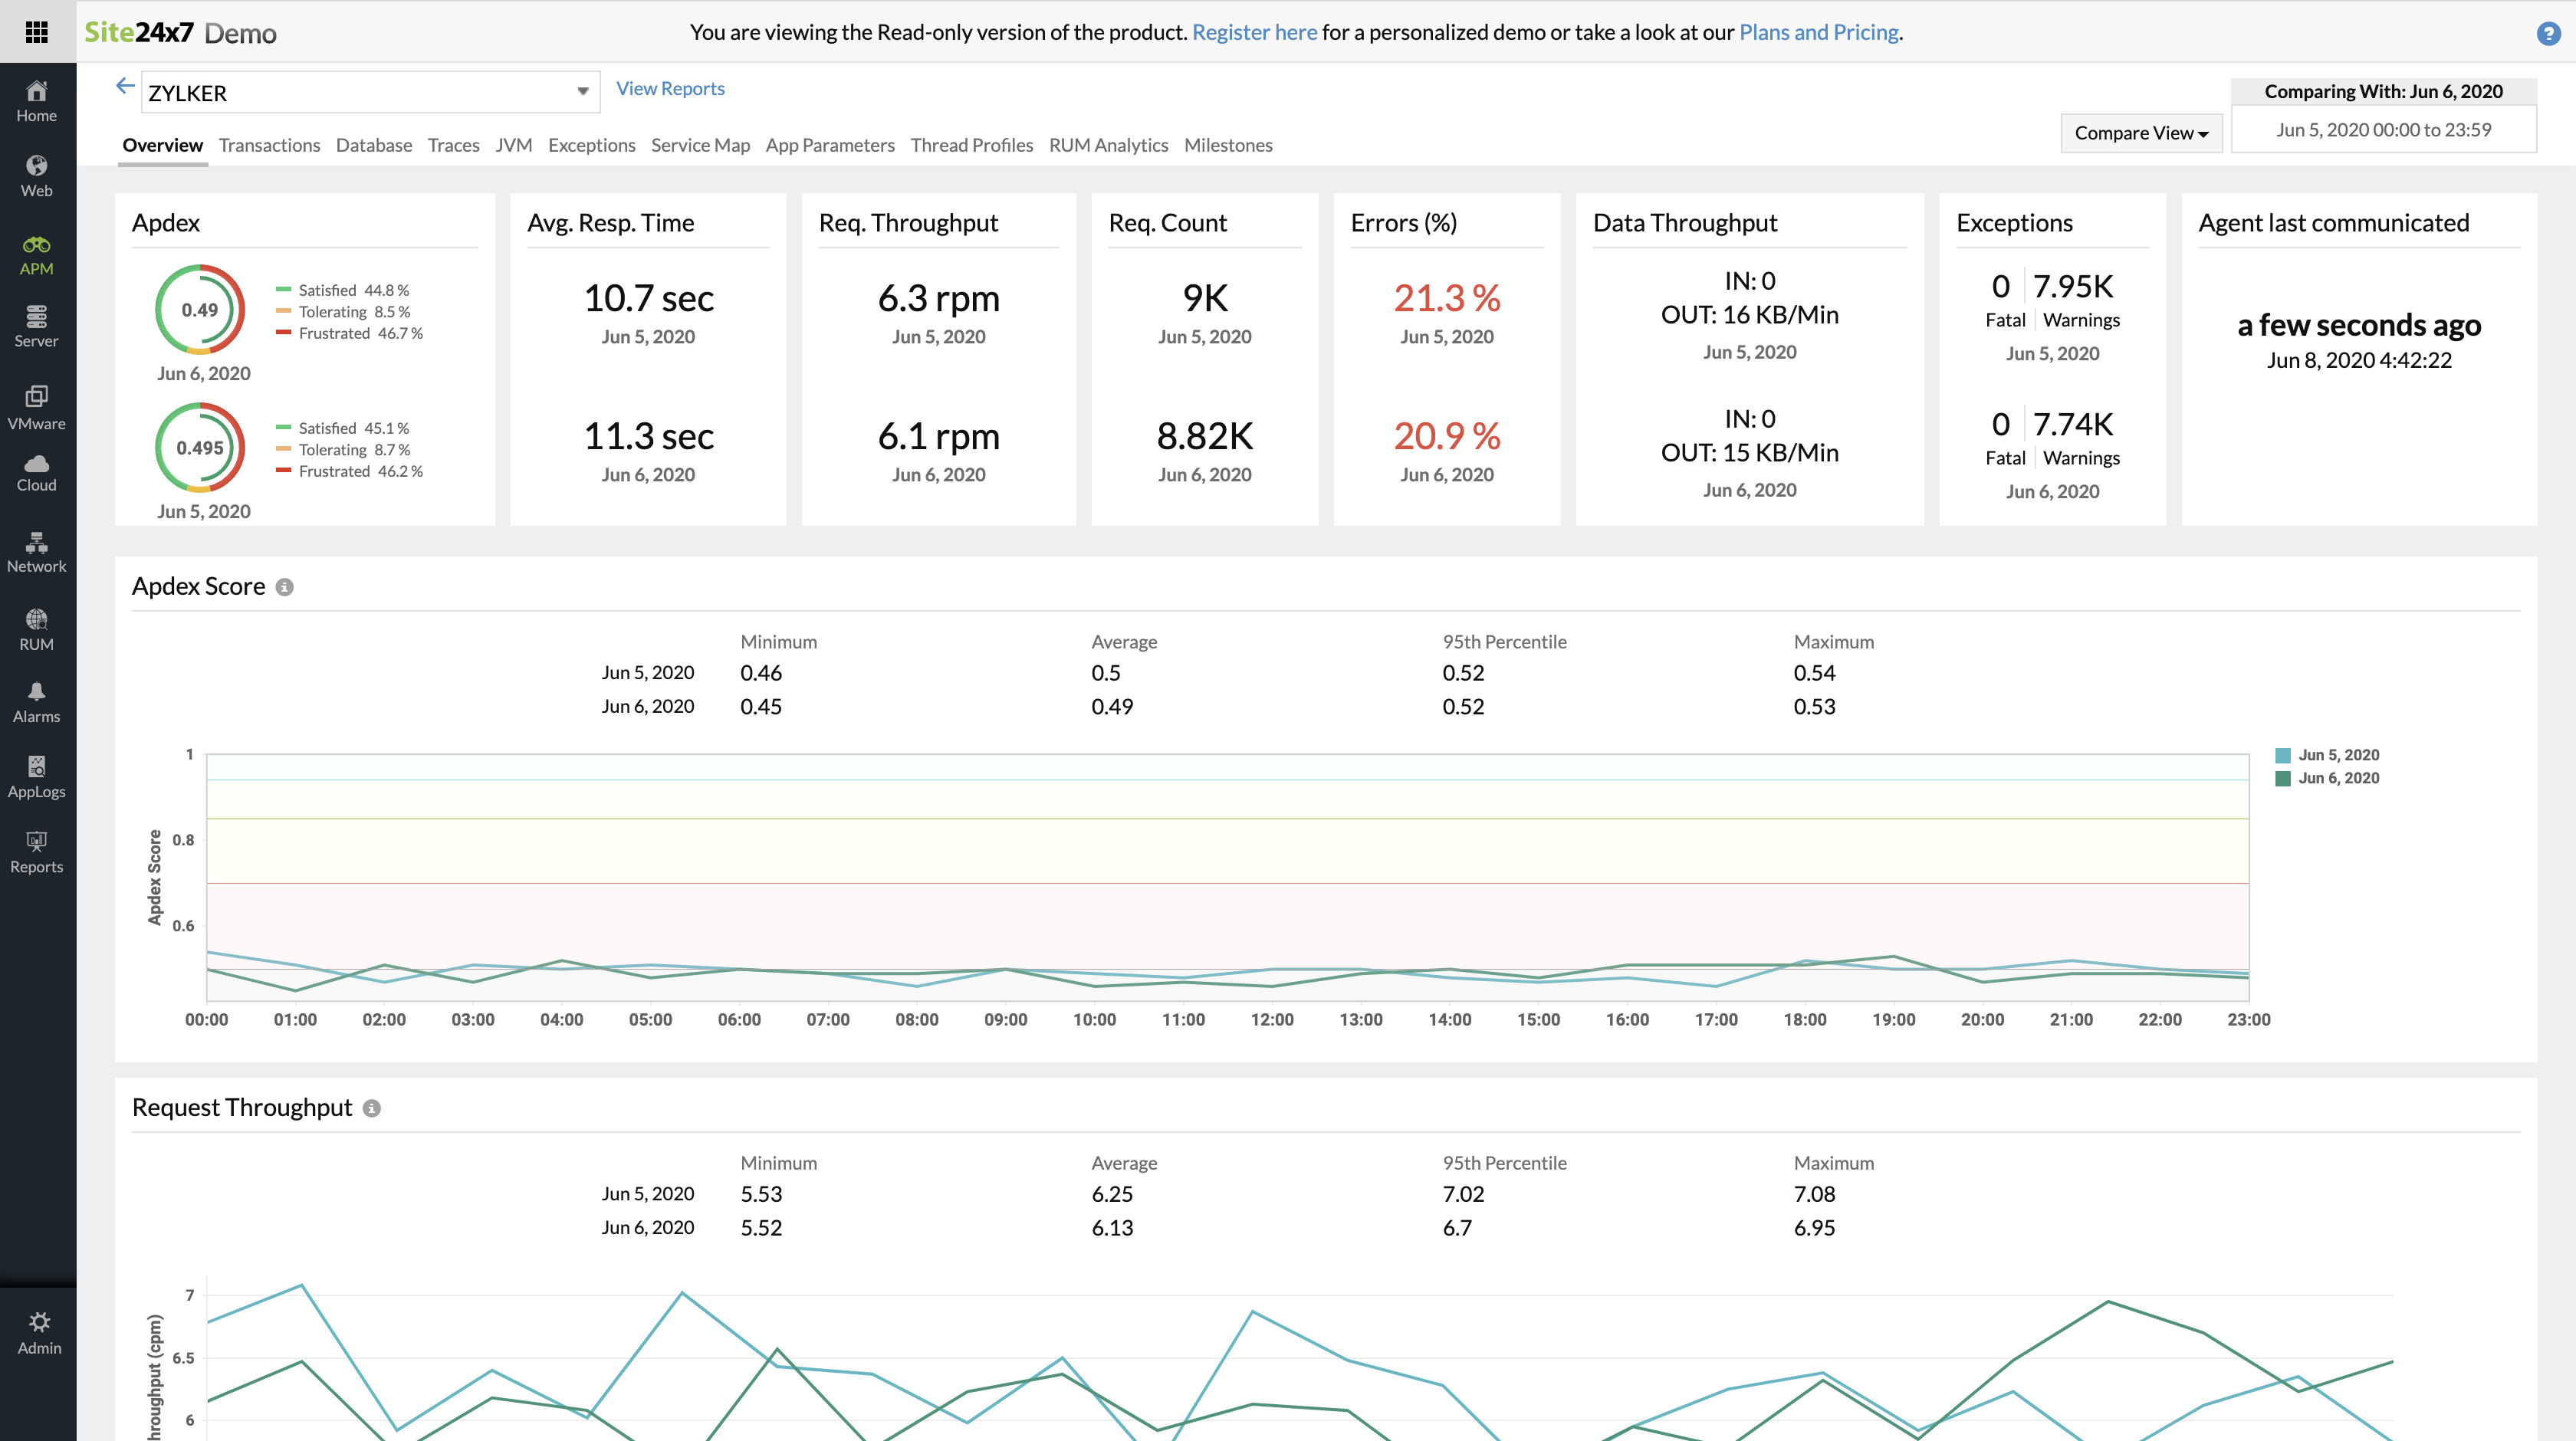
Compare view enables to compare performance metrics for two chosen dates. For instance you can compare your application performance of 02-06-2020 to 14-05-2020
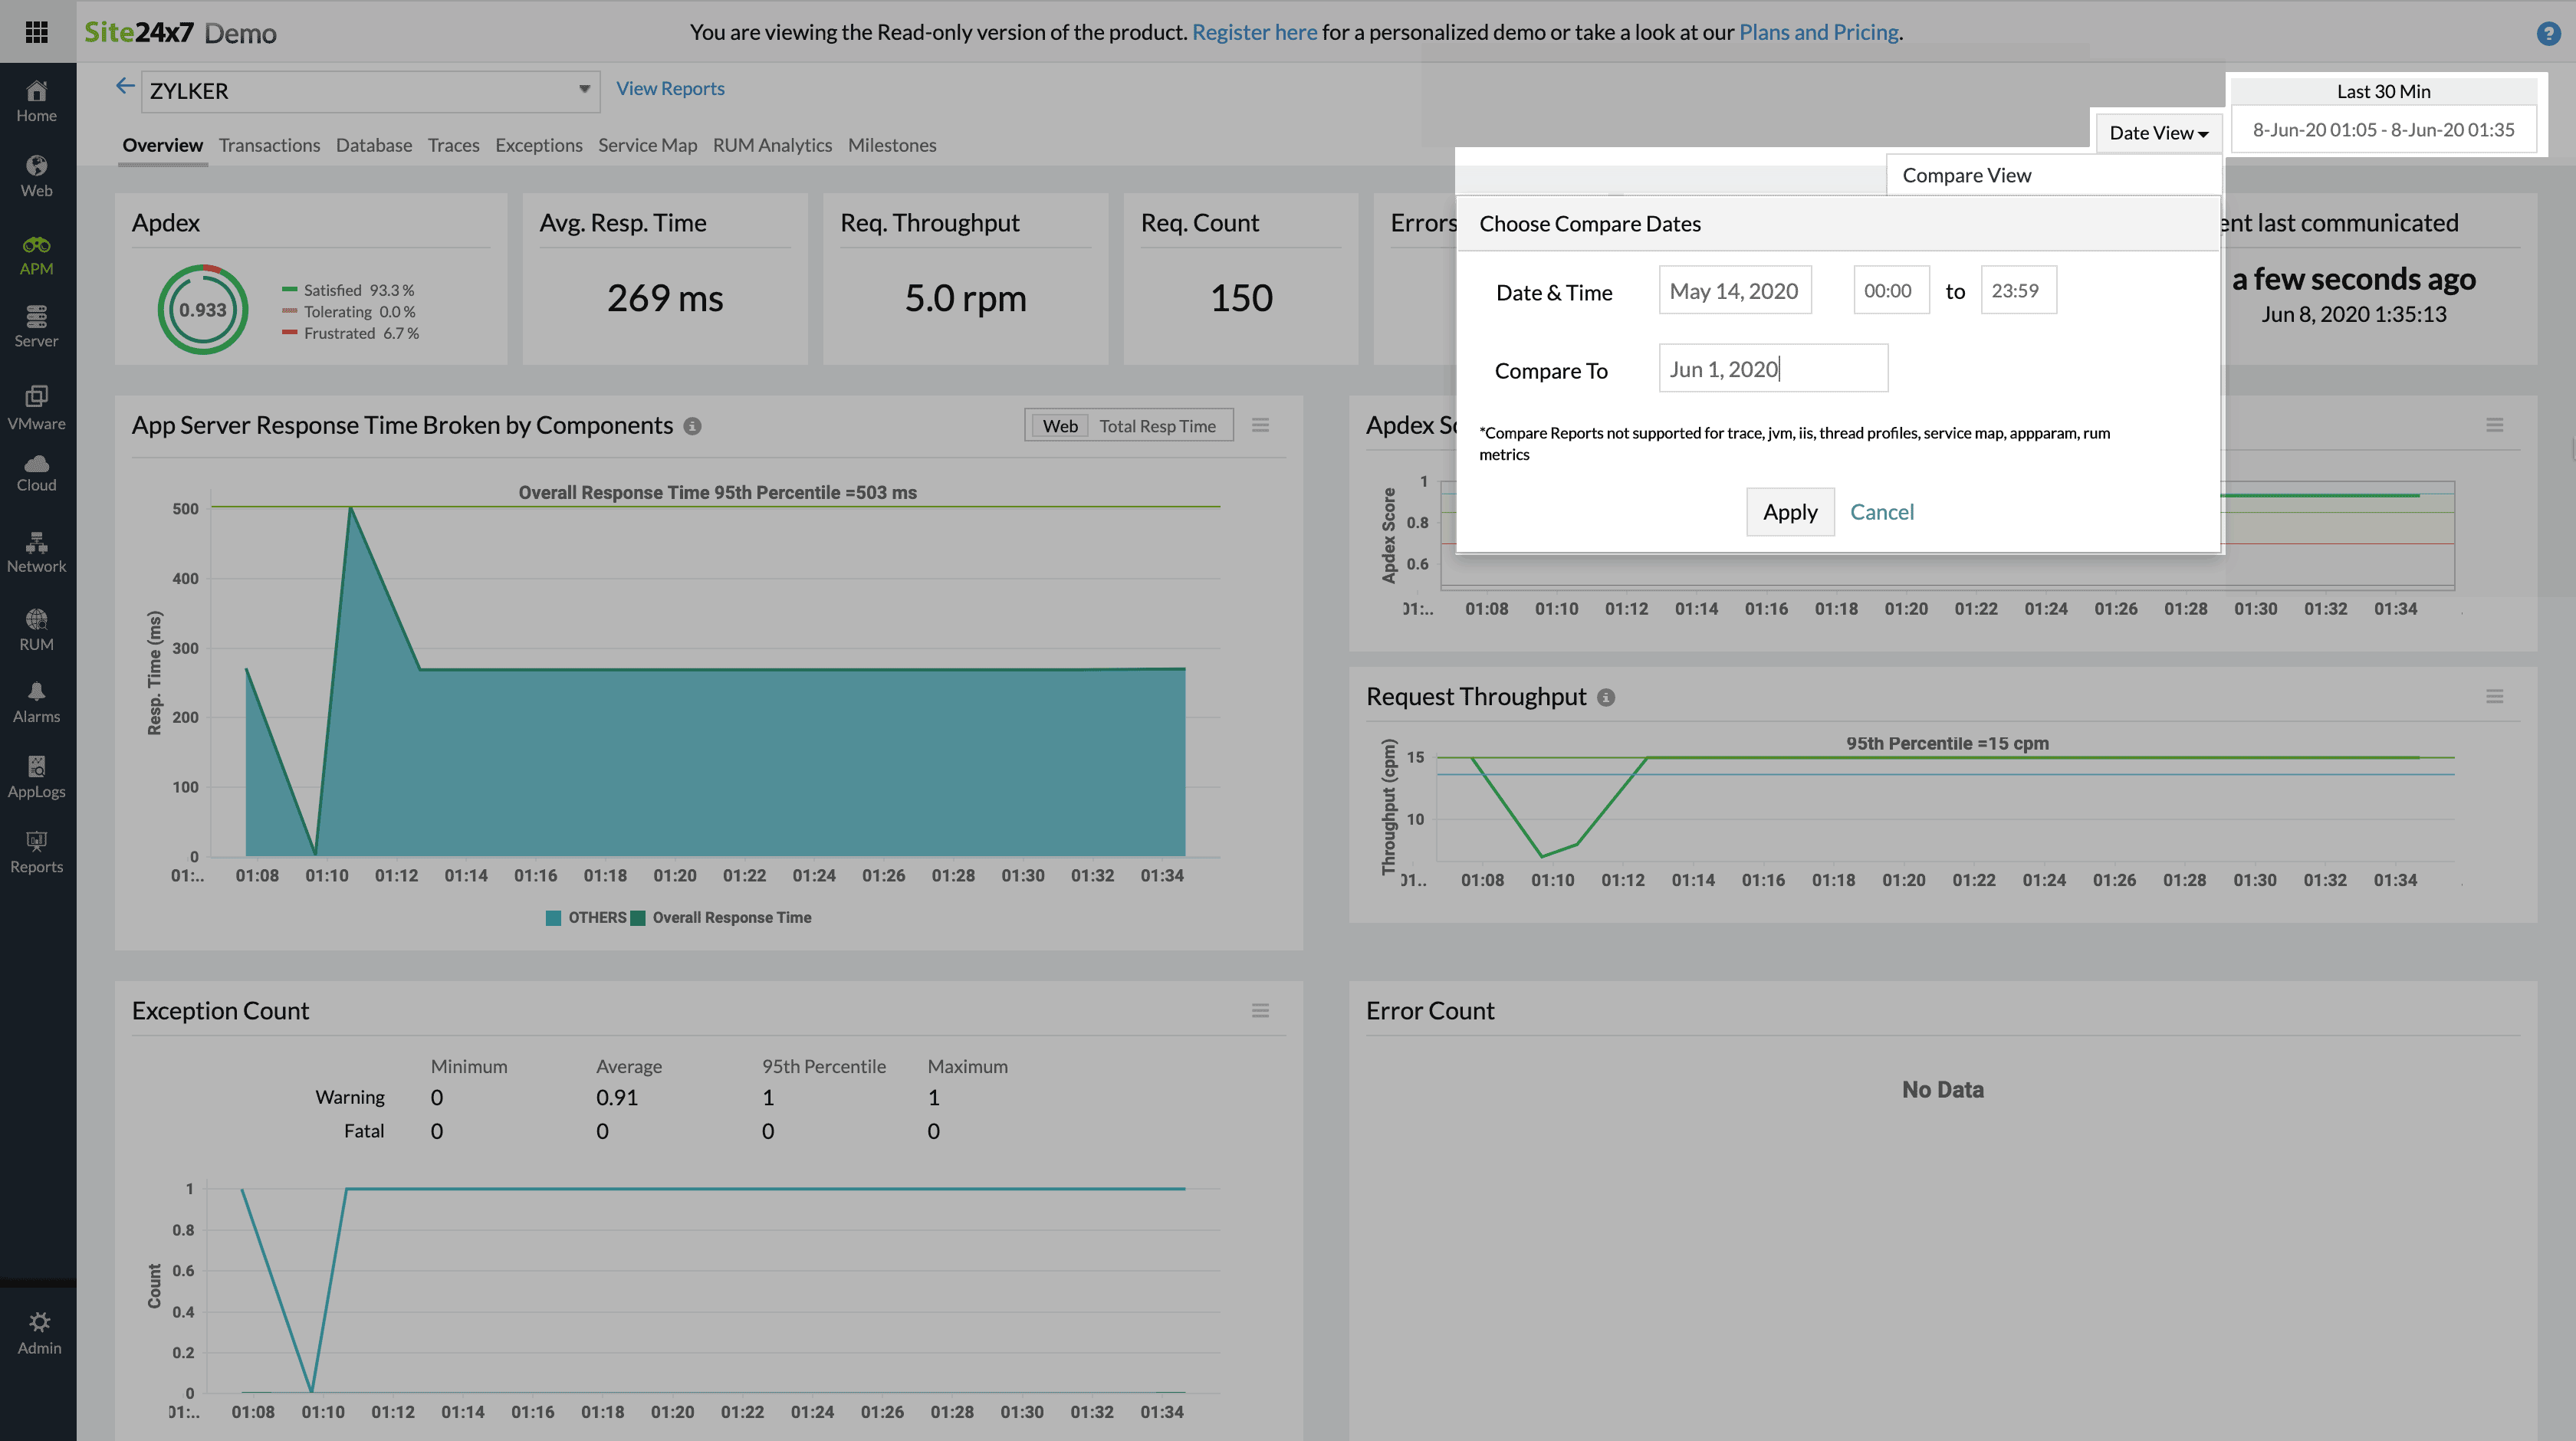
Note: In compare view, you can only view metrics for two distinct dates and not in the chosen range. Also compare view is not supported for Traces, JVM Metrics, IIS, App parameters and Service Maps.
Milestone view
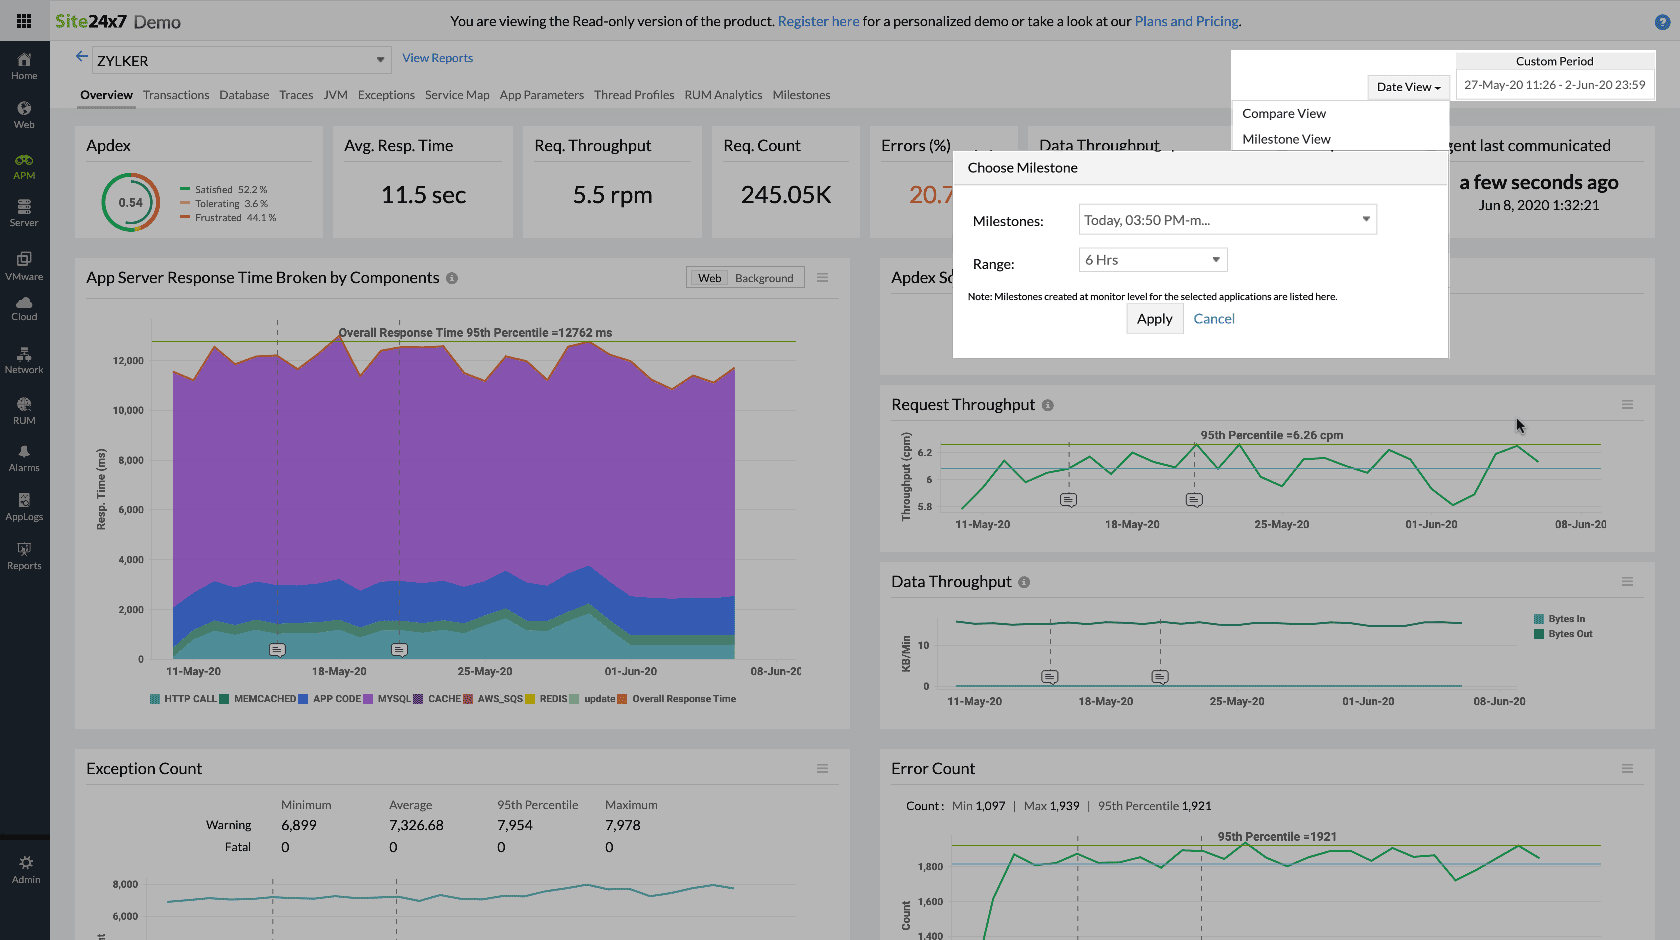
You can monitor metrics based on the milestones deployed. Click on the milestone view, and choose from the list of available milestones to view the application performance before and after the milestone.
Compare milestones
You can also compare application performance between 2 milestones. This comes handy when you want to see if there's any performance improvement after an issue fix or if there's any performance problem after a feature rollout etc.
To do so,
- Choose the first milestone that you want to compare.
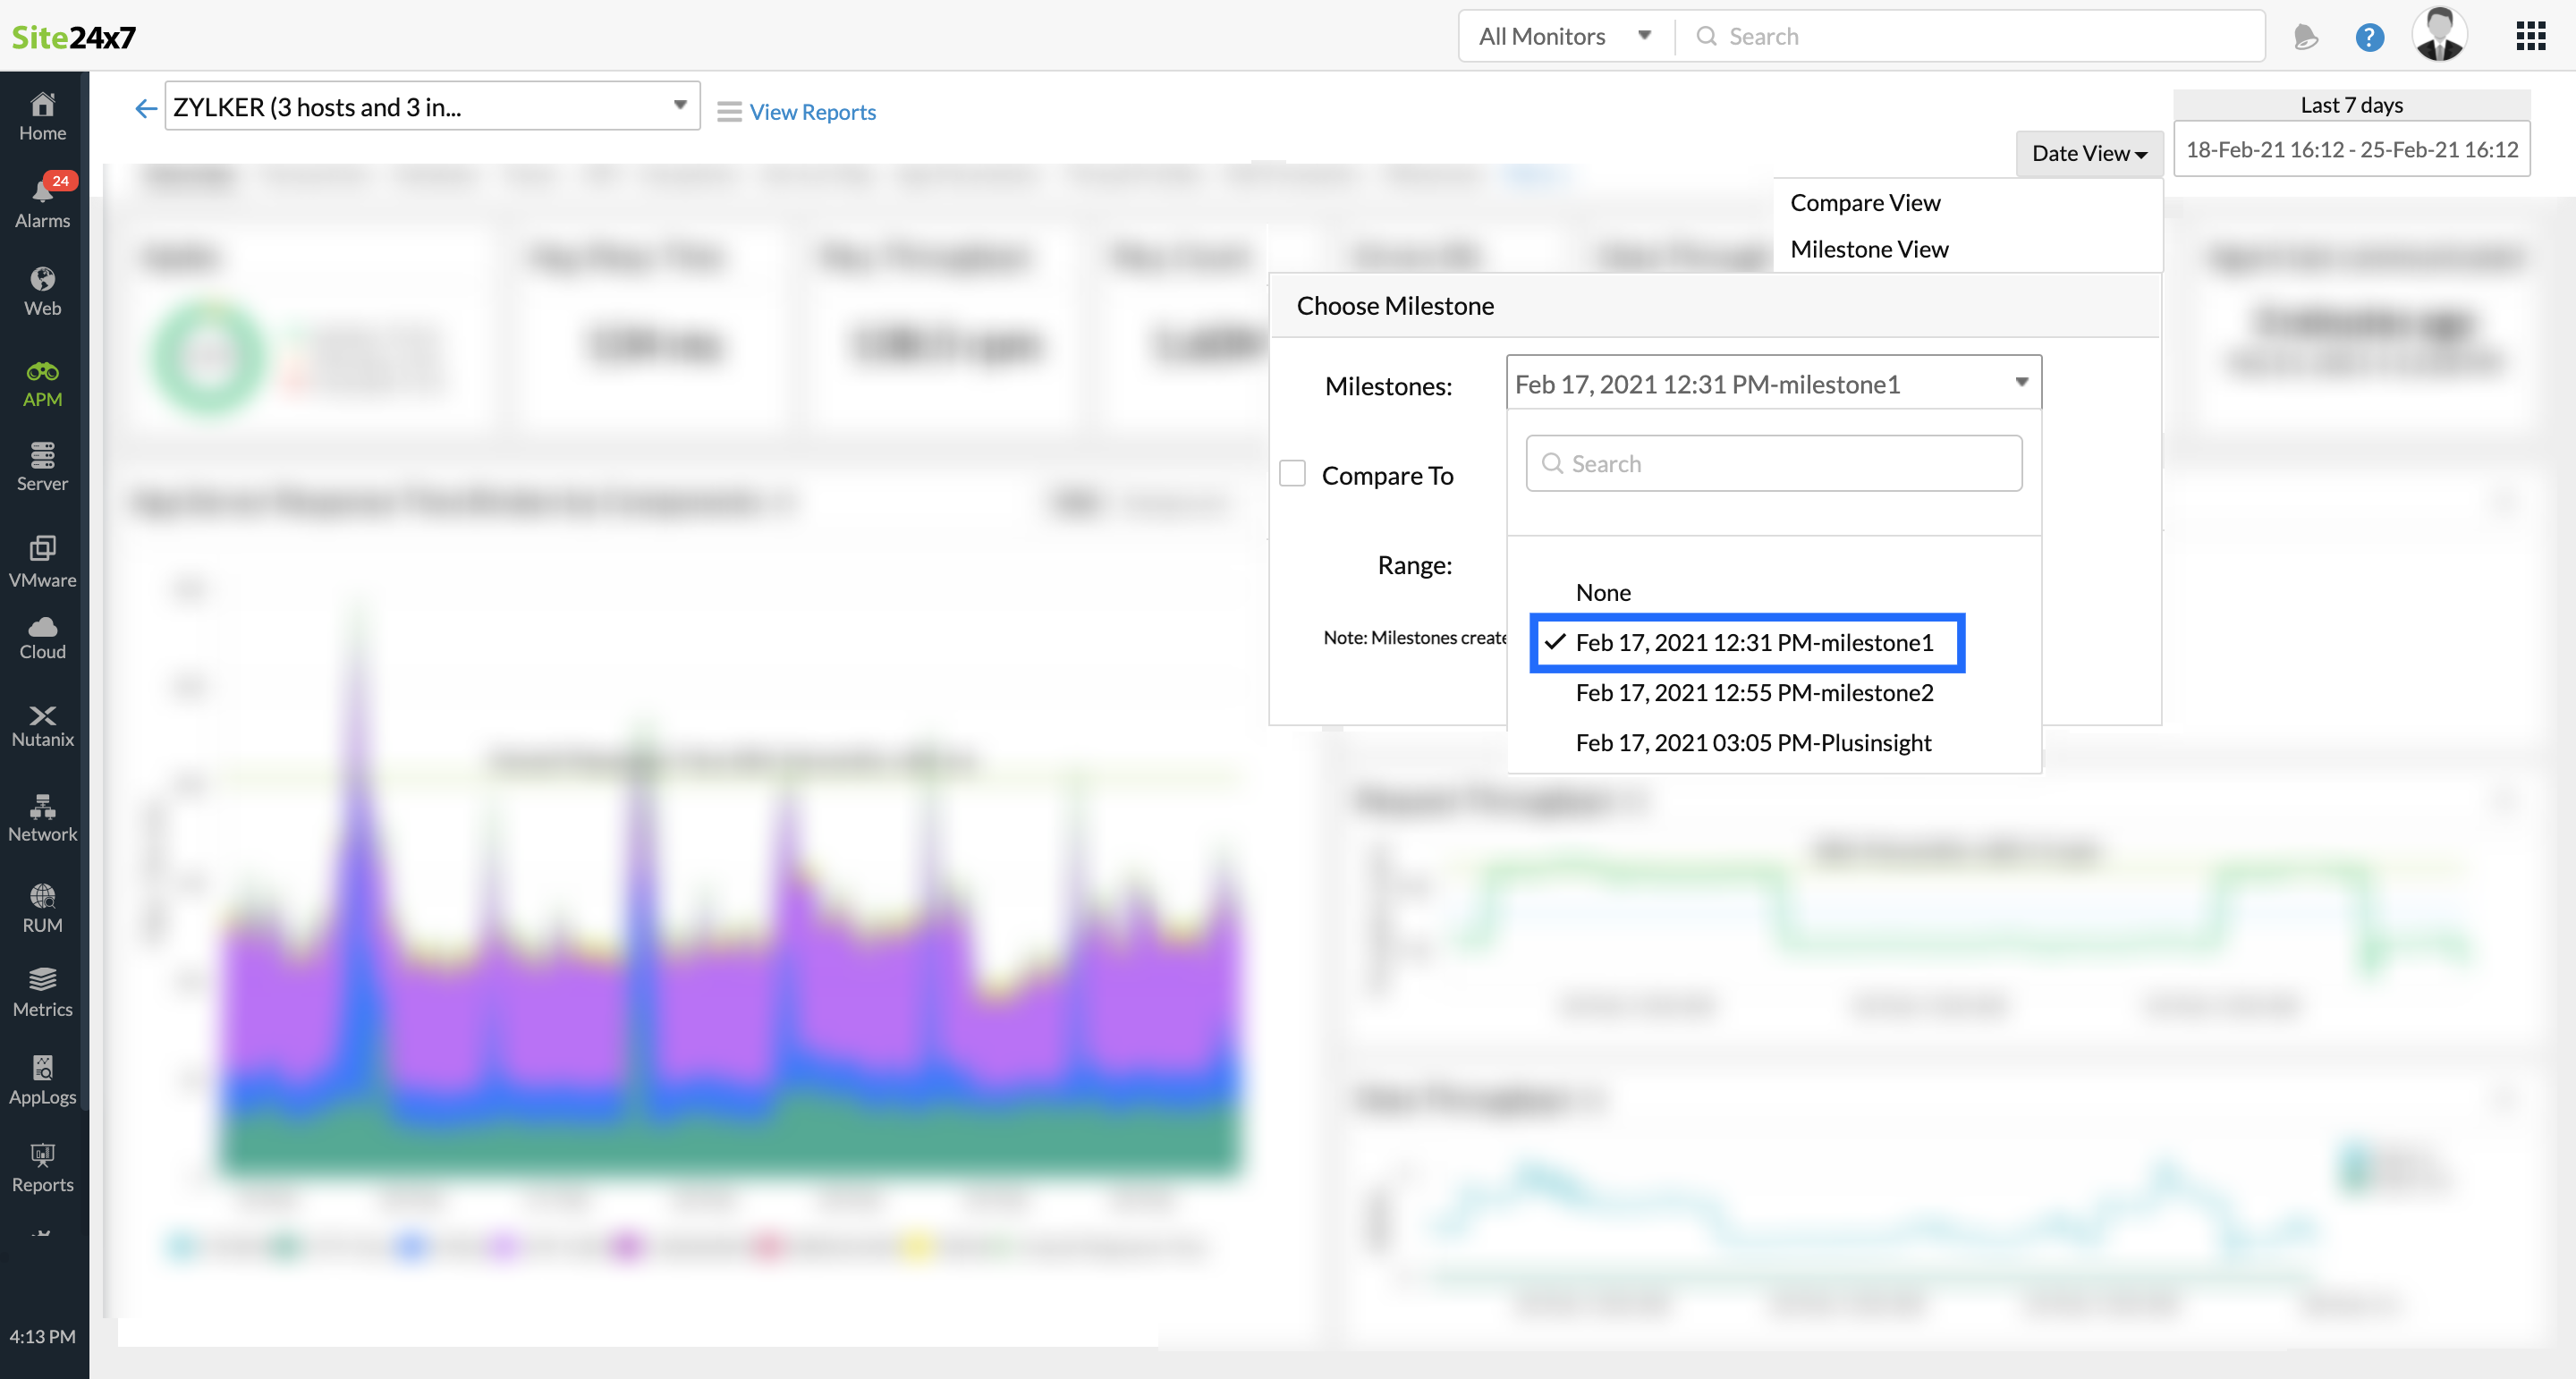
- Click on 'Compare To' and select the milestone that you want to compare with.
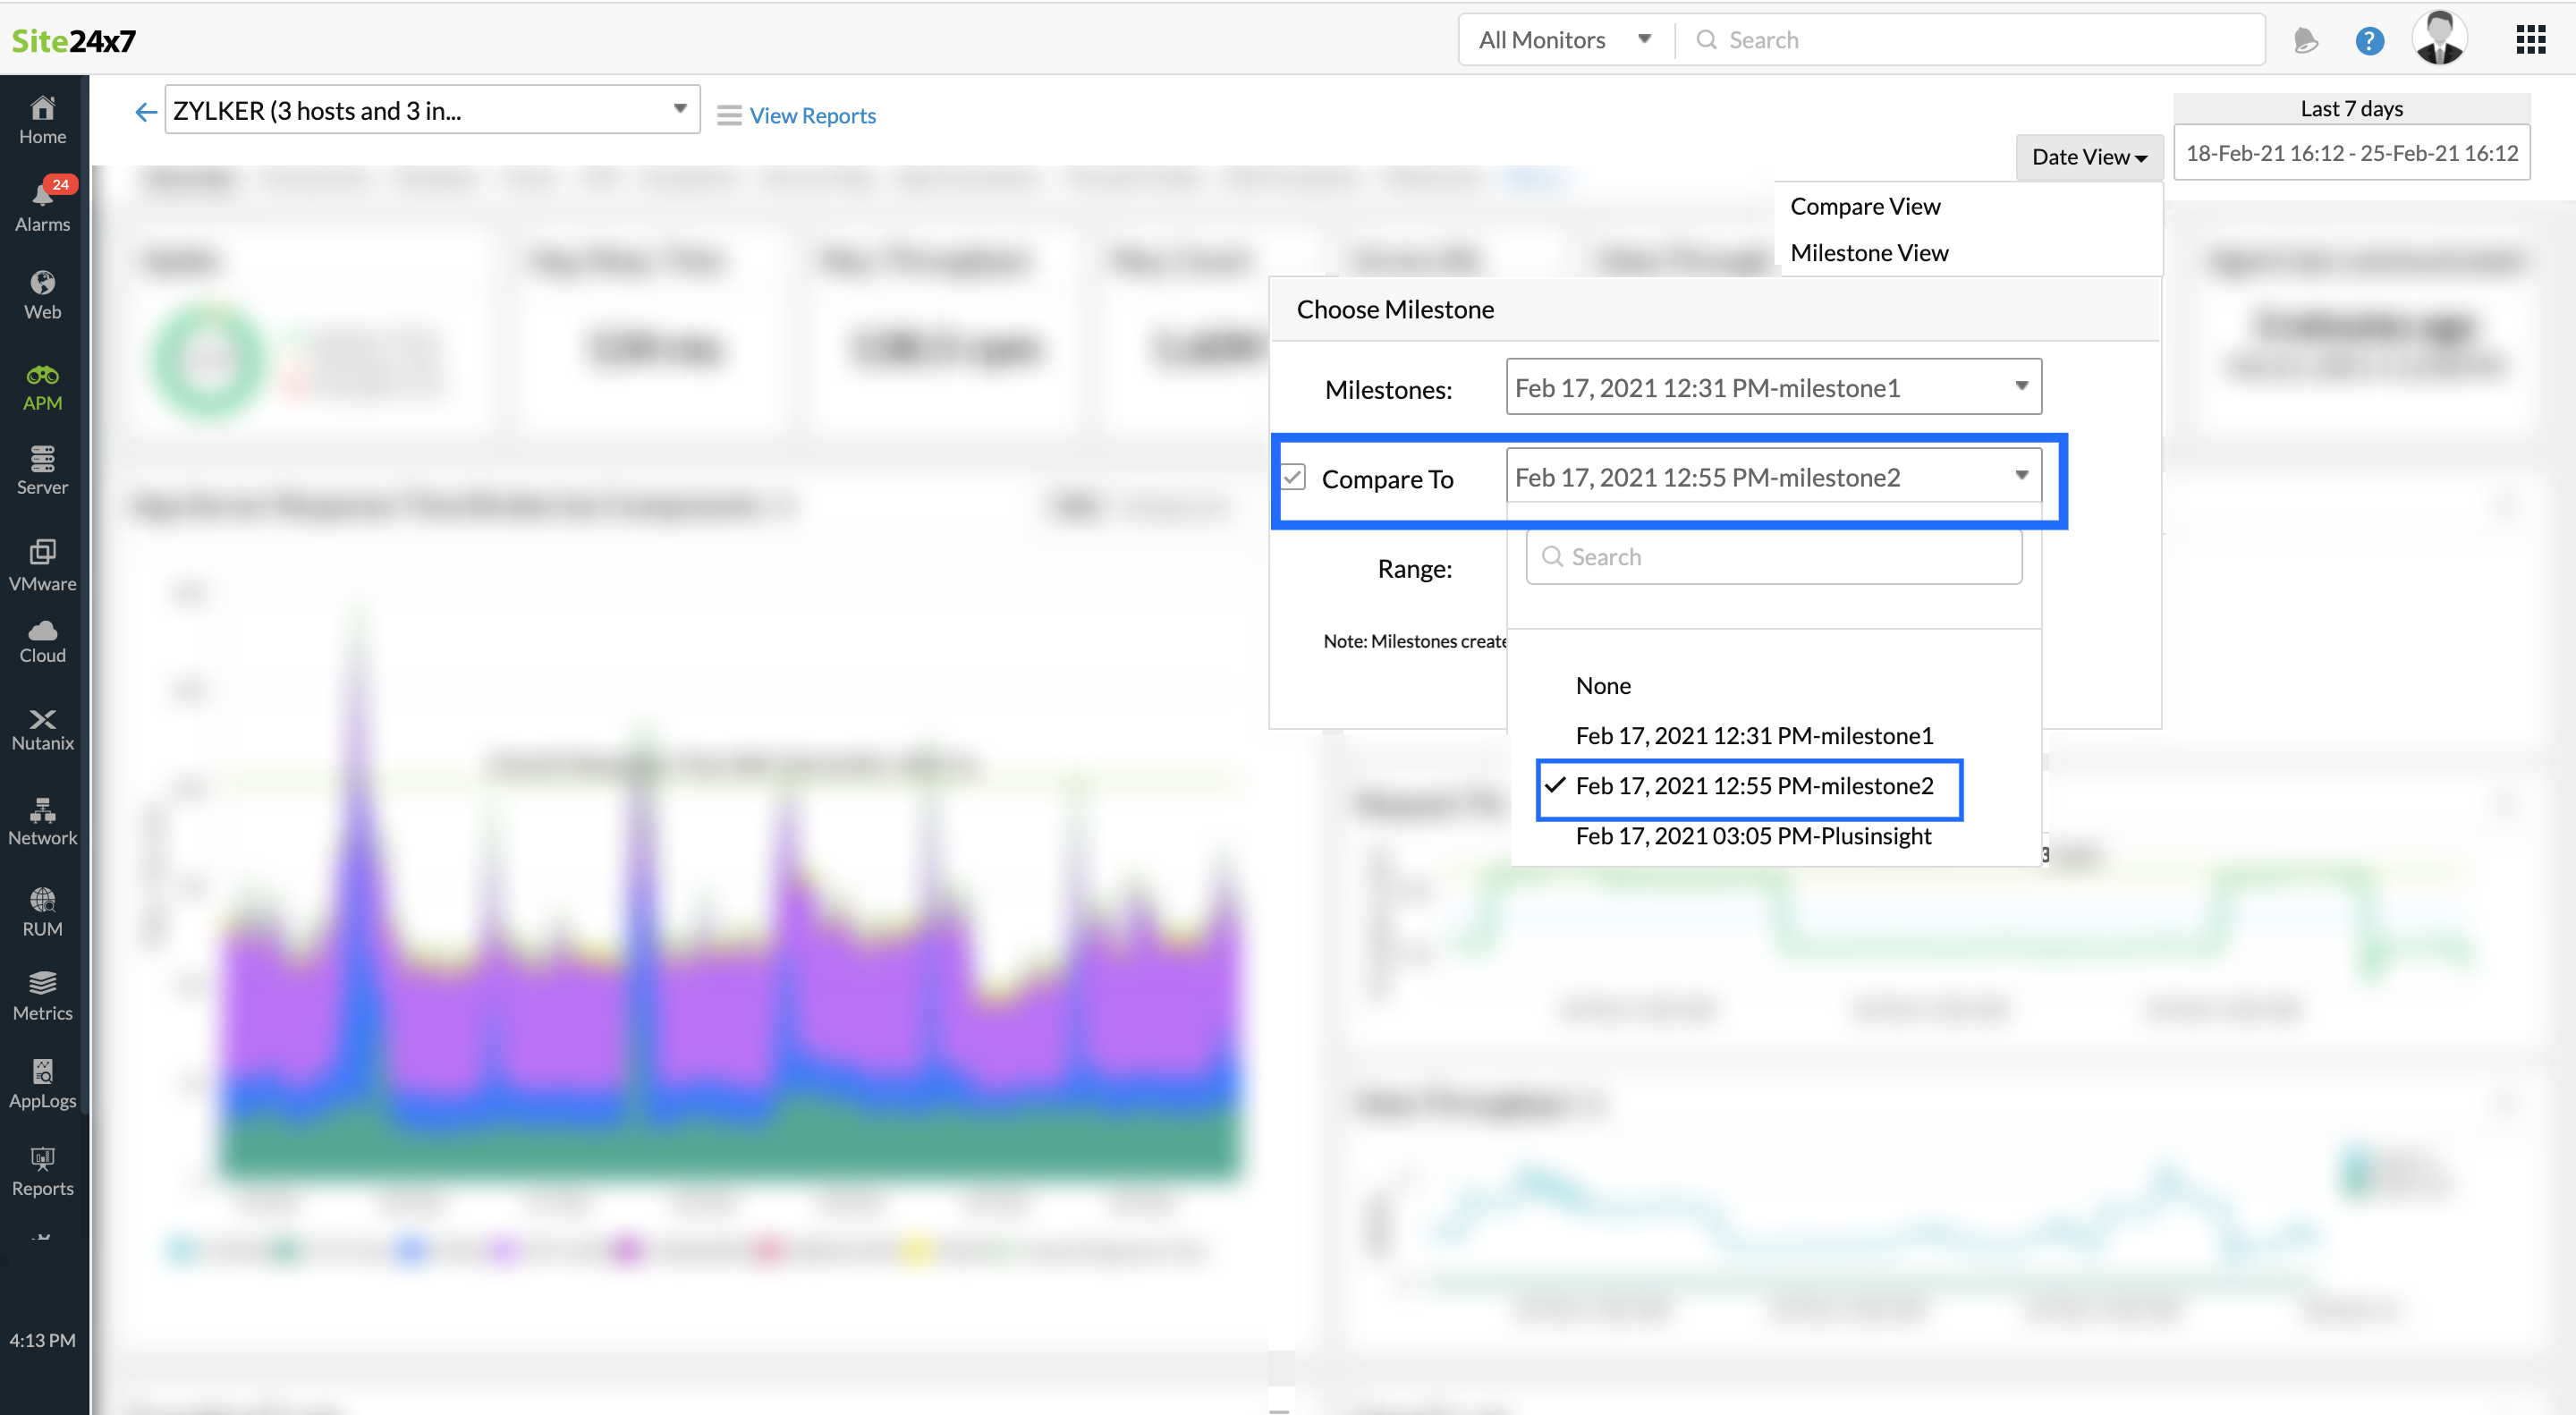
- Select the time range, ranging from last 30 minutes to thirty days, for which you want to compare.
- Click Apply.
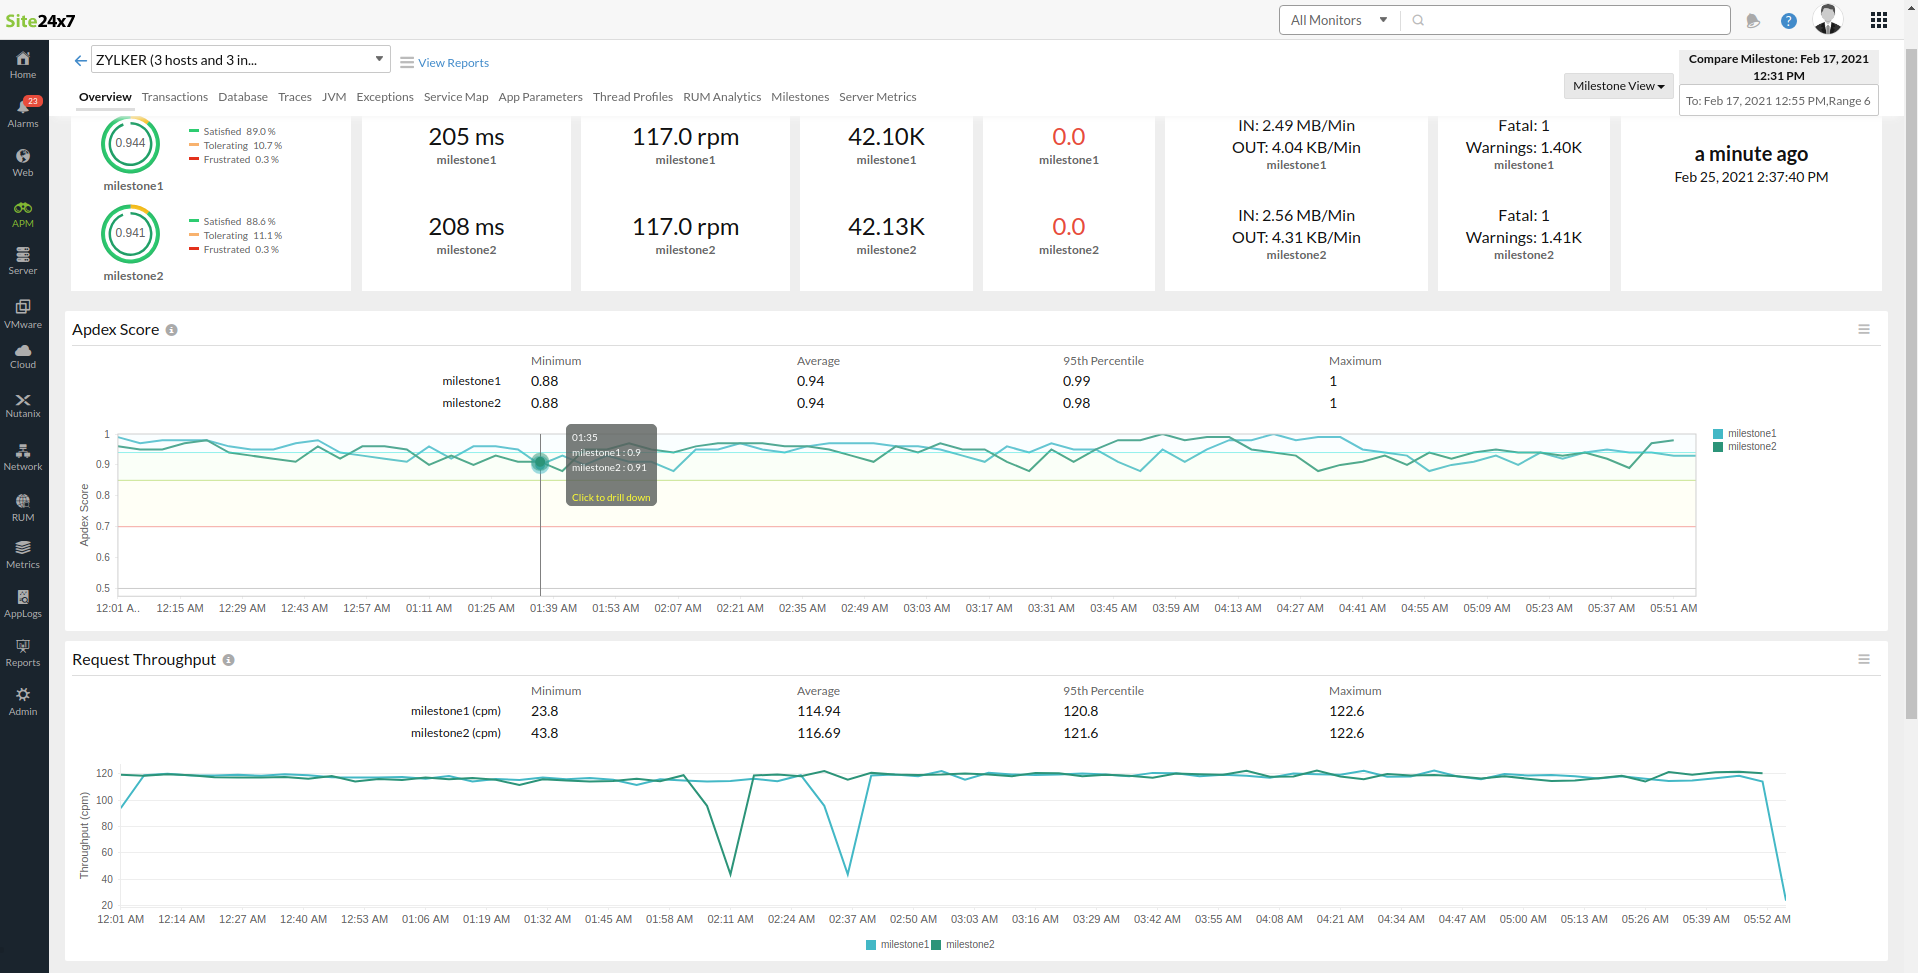
-
On this page
- Date view
- Compare view
- Milestone view
- Compare milestones
