Large language model (LLM) observability
Site24x7 currently supports OpenAI. OpenAI observability gives full visibility into your OpenAI implementation.
Gain valuable insights into your OpenAI usage, perform model-wise cost analysis, log prompts and responses, identify errors, and more—all to track the performance and utilization of your OpenAI implementation in real time.
Use case
With the Site24x7 OpenAI observability feature, you can monitor all external calls made from your application to OpenAI, providing full visibility into your application's interaction with OpenAI's services.
For example, consider a customer support chatbot that uses OpenAI to generate responses to user inquiries. When a user asks a question, the chatbot makes a call to OpenAI to retrieve a suitable response. The Site24x7 OpenAI monitoring module captures these requests, tracking metrics such as response times, success rates, and any errors. Additionally, it allows you to gain valuable insights into your OpenAI token usage, perform model-wise cost analysis, log prompts and responses.
This comprehensive monitoring ensures that you can track the performance and utilization of your OpenAI implementation in real time, optimize costs, and maintain a seamless user experience, thereby enhancing customer satisfaction and operational efficiency.
Instructions to add OpenAI observability
To install the OpenAI module, follow the instructions given below:
Node.js | Python
Node.js
- Open your Node.js application.
- Access the node package manager (NPM).
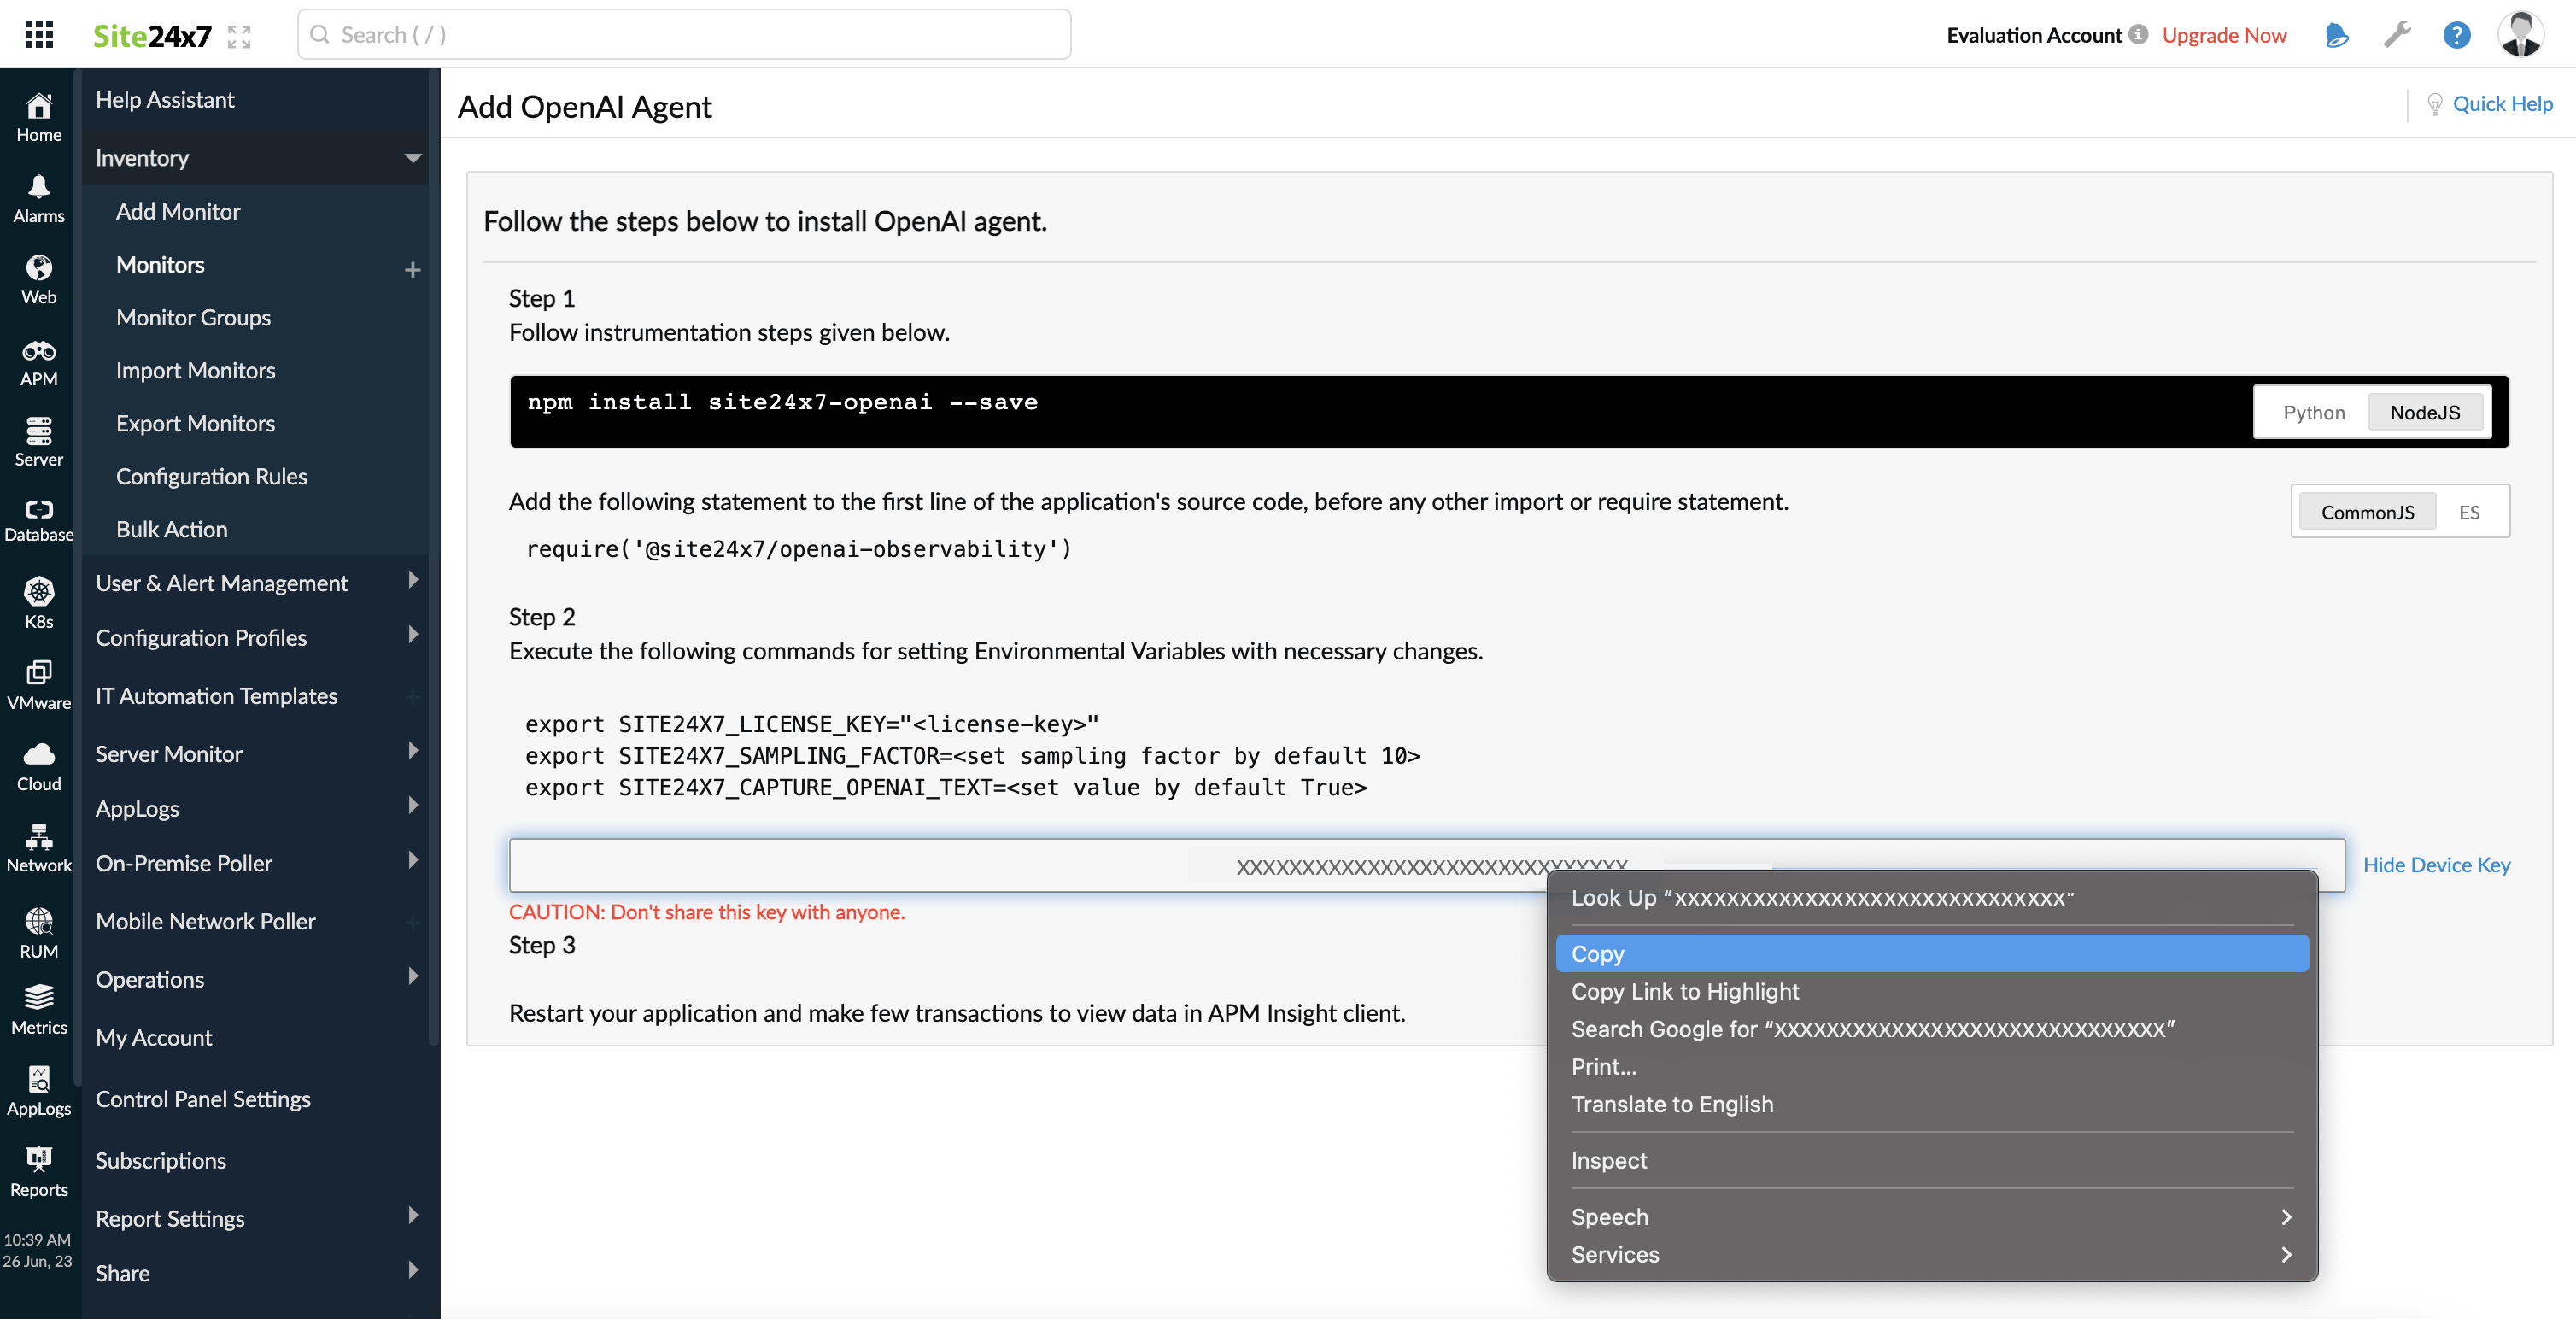
- Install the site24x7 openaimodule using the following command:
npm install @site24x7/openai-observability --save
- Add the following statement to the first line of the application's source code, before any other import or require statement.
- If you are using ES or Typescript:
import * as site24x7-openai from '@site24x7/openai-observability'
- If you are using Common JS:
require('@site24x7/openai-observability')
- If you are using ES or Typescript:
- Copy the license key from the Site24x7 portal.

- Set the license key as an environment variable as shown below:
SITE24X7_LICENSE_KEY=<YOUR LICENSE KEY HERE>
- Restart the application.
Set configuration values as environment variables:
You can set configuration values like sampling factor and capture OpenAI text as environment variables using the following keys:
- SITE24X7_SAMPLING_FACTOR
- SITE24X7_CAPTURE_OPENAI_TEXT
- SITE24X7_SAMPLING_FACTOR:
The default sampling factor is 10. As a result, by default, the Site24x7 OpenAI module captures the prompt and message of only one out of every 10 requests in that polling interval. However, you can update this value.
For example, if you set this to 5 so that 1 out of every 5 request's prompts and messages will be captured. If you set this to 1, all of the request's prompts and messages will be captured. - SITE24X7_CAPTURE_OPENAI_TEXT:
- The default option is True (we capture the prompt and message of a request based on the sampling factor).
- If it is set to False, we will not capture the message or prompt of any of the requests.
Python
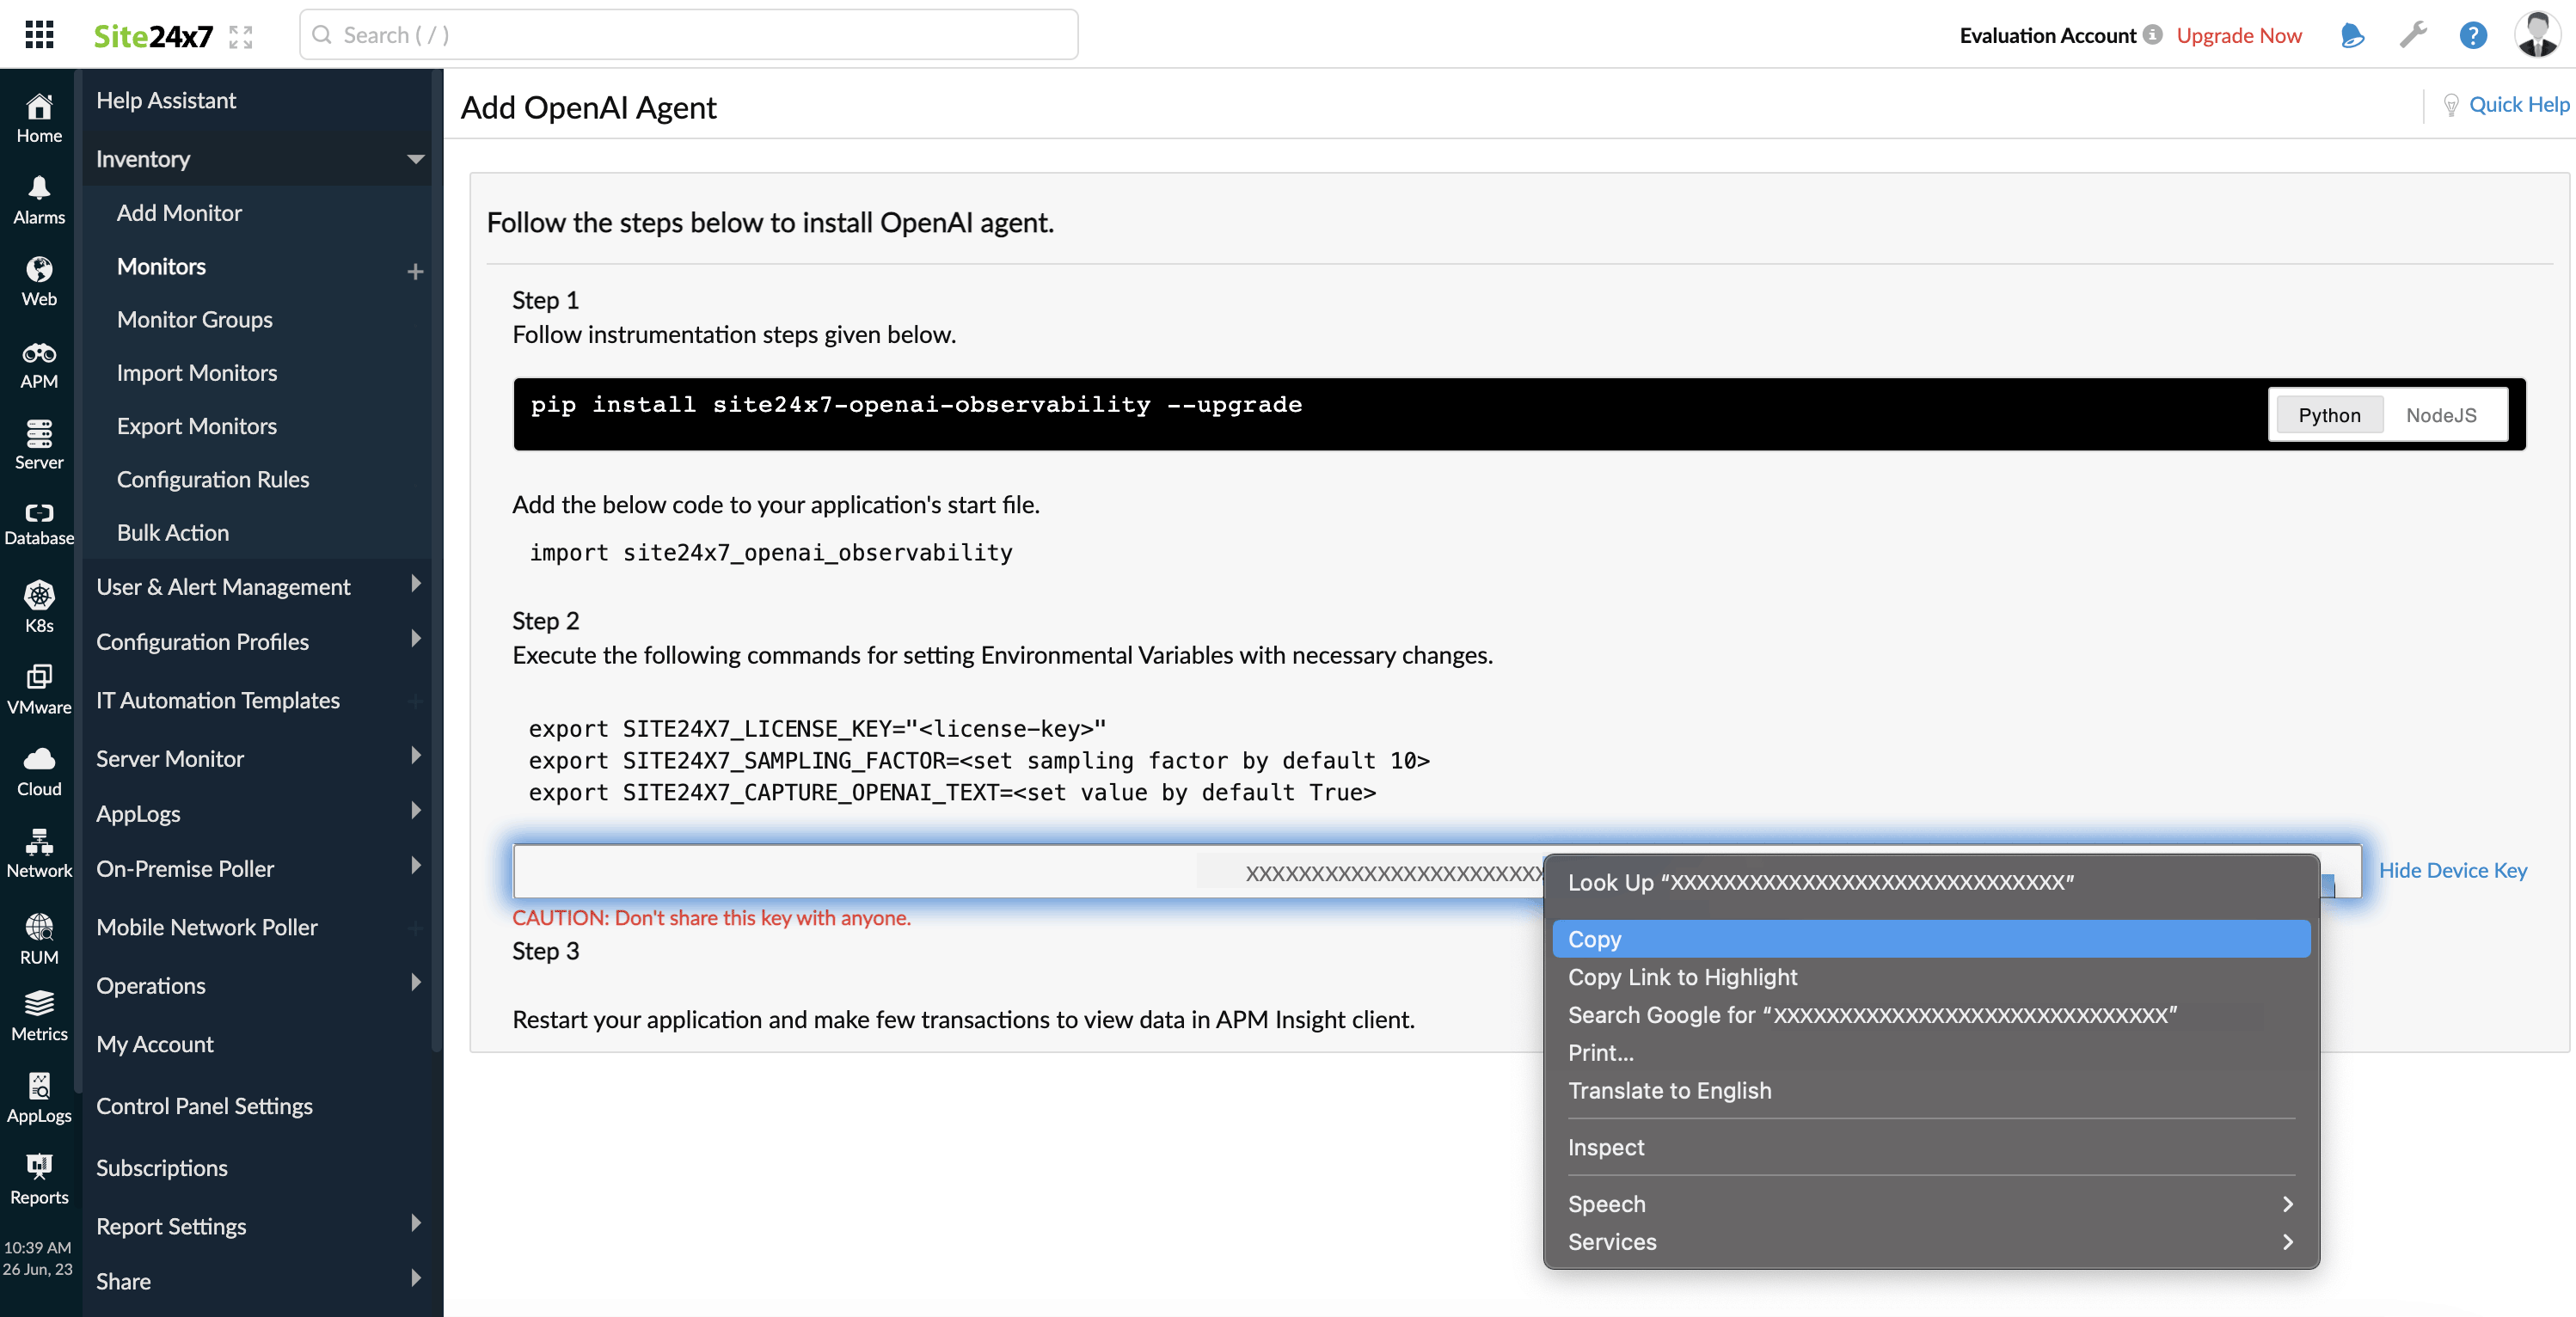
- Install the site24x7-openaimodule using the following command:
pip install site24x7-openai-observability --upgrade
NoteIf you are using a virtual environment, activate it and perform the above command to install the site24x7-openai-observability package into your virtual environment.
- Add the below code to your application’s start file to integrate the observability agent:
import site24x7_openai_observability
- Copy the license key from the Site24x7 portal.

- Set the license key as an environment variable as shown below:
SITE24X7_LICENSE_KEY=<YOUR LICENSE KEY HERE>
- Restart the application.
Additional configurations:
You can configure the sample factor and capture OpenAI text as environment variables using the following keys:
| Configuration | Default value | Description |
| $ export SITE24X7_SAMPLING_FACTOR=<set sampling factor> | 10 | As a result, by default, the Site24x7 OpenAI module captures the prompt and message of only one out of every 10 requests in that polling interval. However, you can update this value. |
| $ export SITE24X7_CAPTURE_OPENAI_TEXT=<set value> | True |
|
Performance metrics
To begin:
- Log in to the Site24x7 web client.
- Navigate to APM > OpenAI.
On the top-right corner you can also decide on the time frame for which you need the metrics.

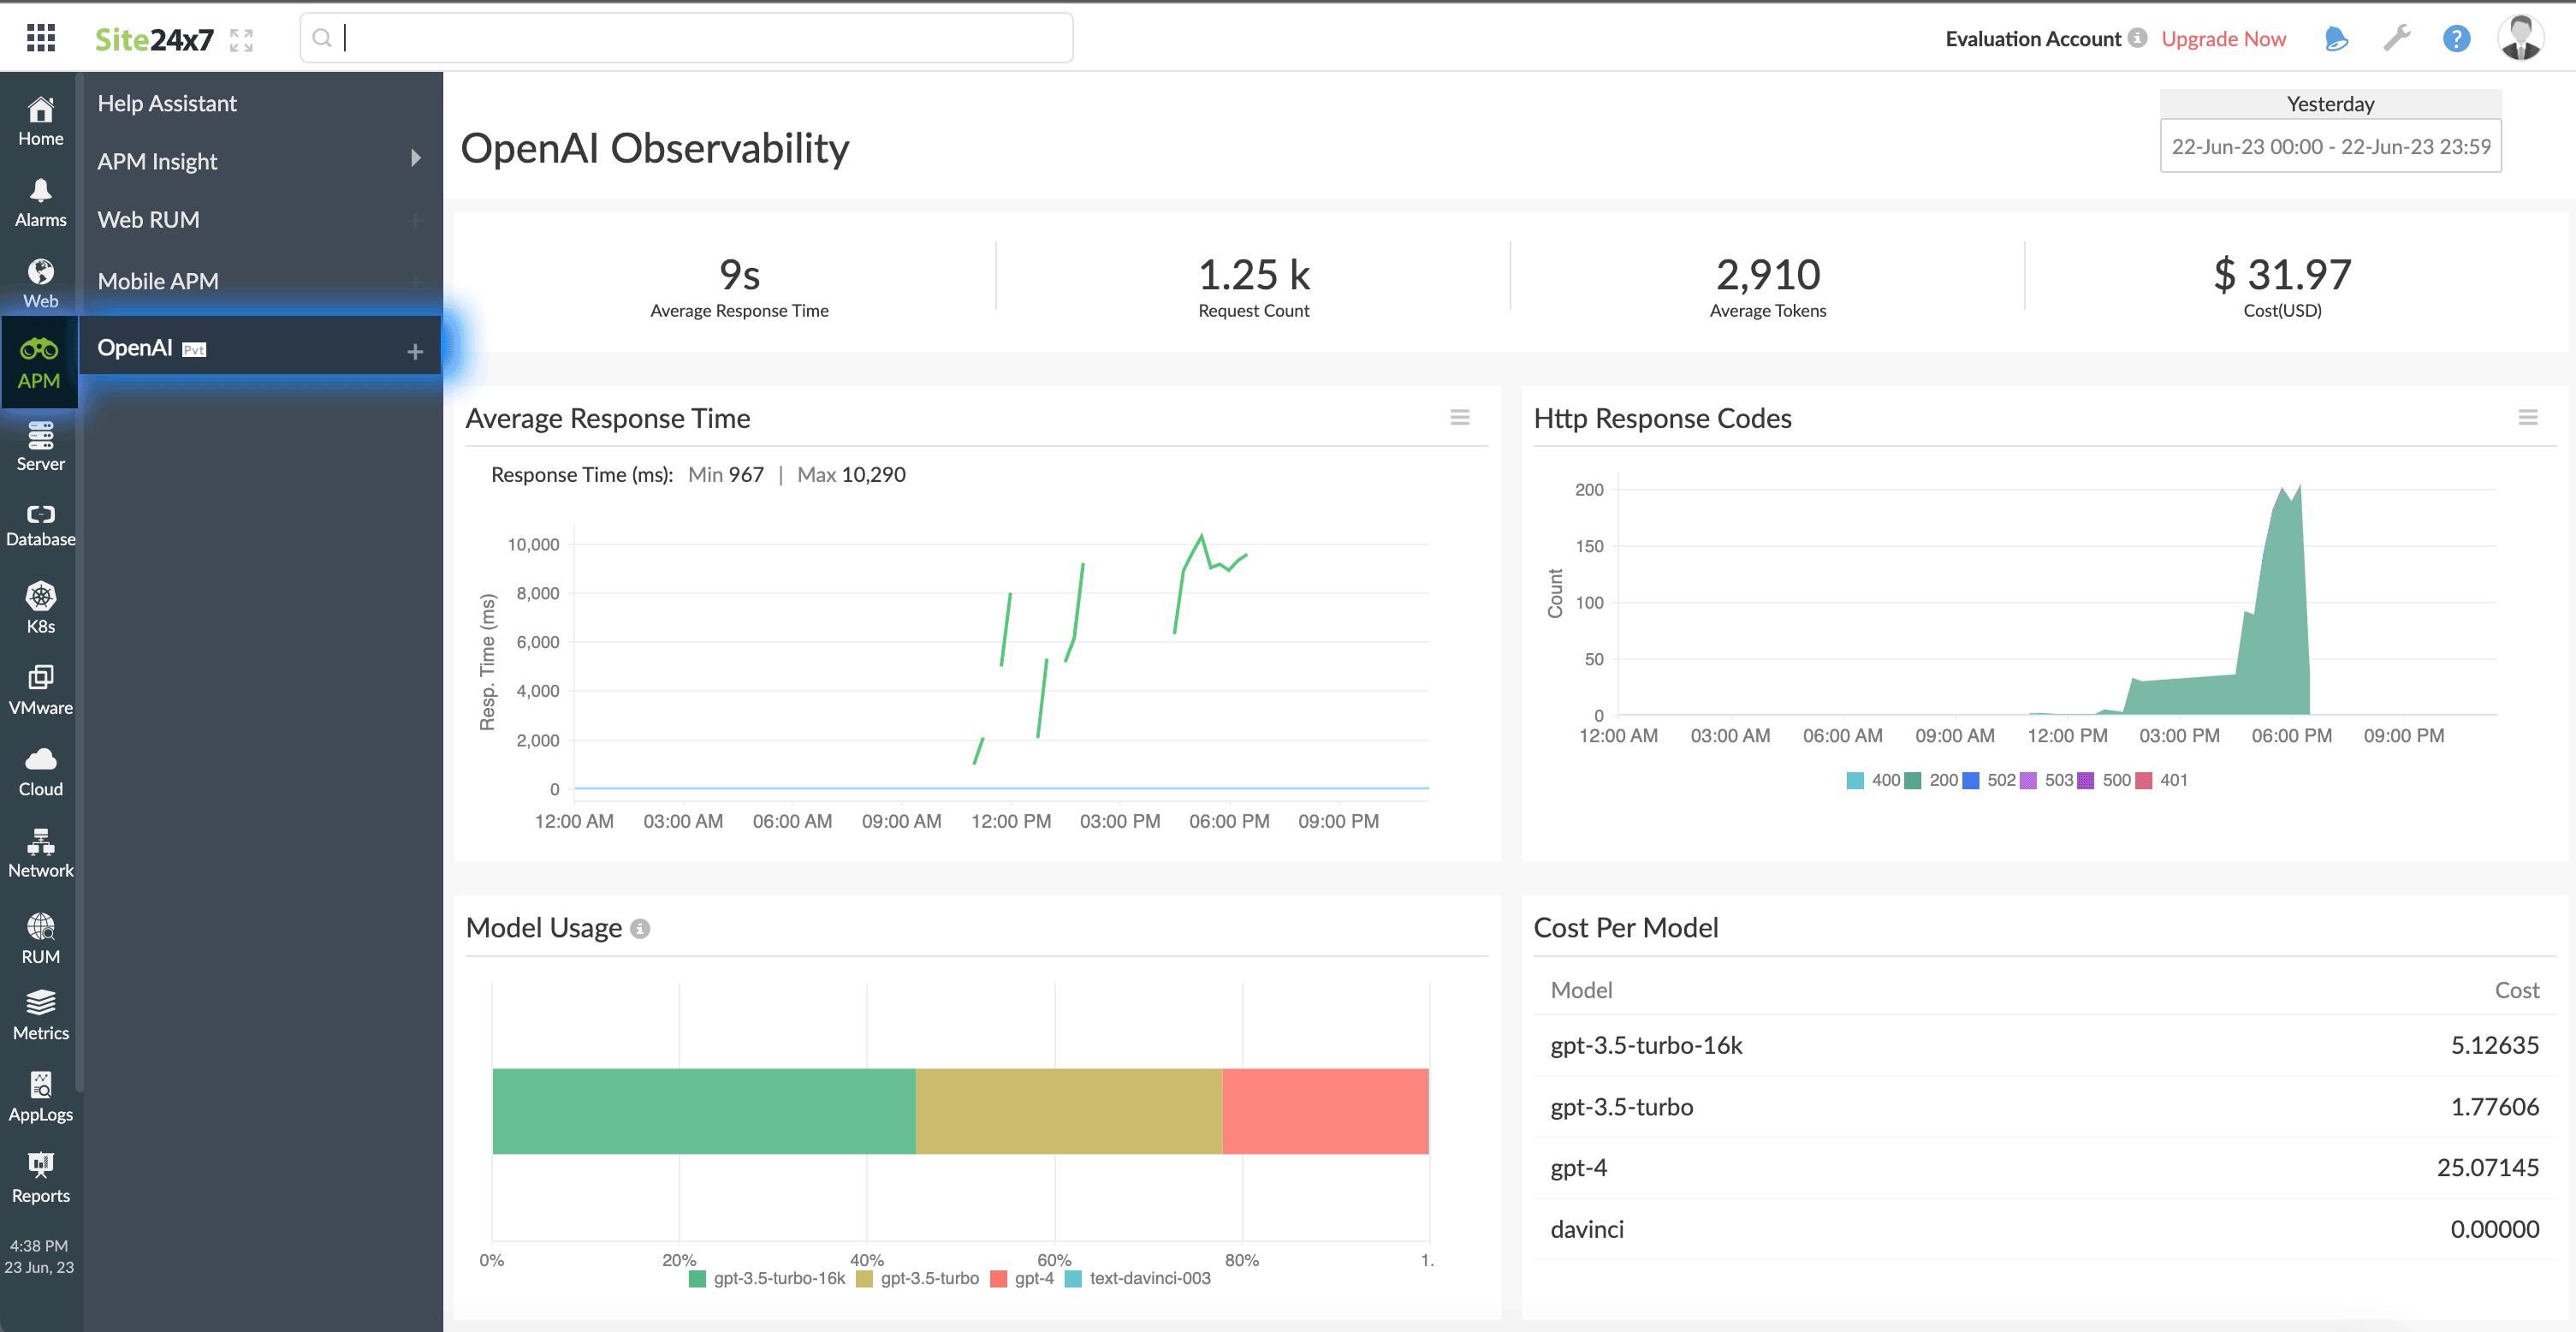
The top band displays the average response time, request count, average tokens, and cost.
| Parameter | Description |
| Average Response Time | The average time taken by OpenAI to respond to user requests |
| Request Count | Total number of requests sent to OpenAI |
| Average Tokens | Average number of tokens per request Note
A token is a character. |
| cost | Total cost spent (USD) |
Average Response Time
This graph depicts the average response time of the requests over the selected time period. The Min is the minimum response time, and the Max is the maximum response time.
HTTP Response Codes
This graph provides a summary of the various HTTP responses that were received. You can hover over each peak to get the count.
Model Usage
Model Usage widget shows the percentage of requests sent from each Model as a separate block. The blocks are color-coded for easy identification. Hover over each block to see the total number of requests.
Cost Per Model
This table gives an overall summary of all the models and their costs.
Model-wise Throughput
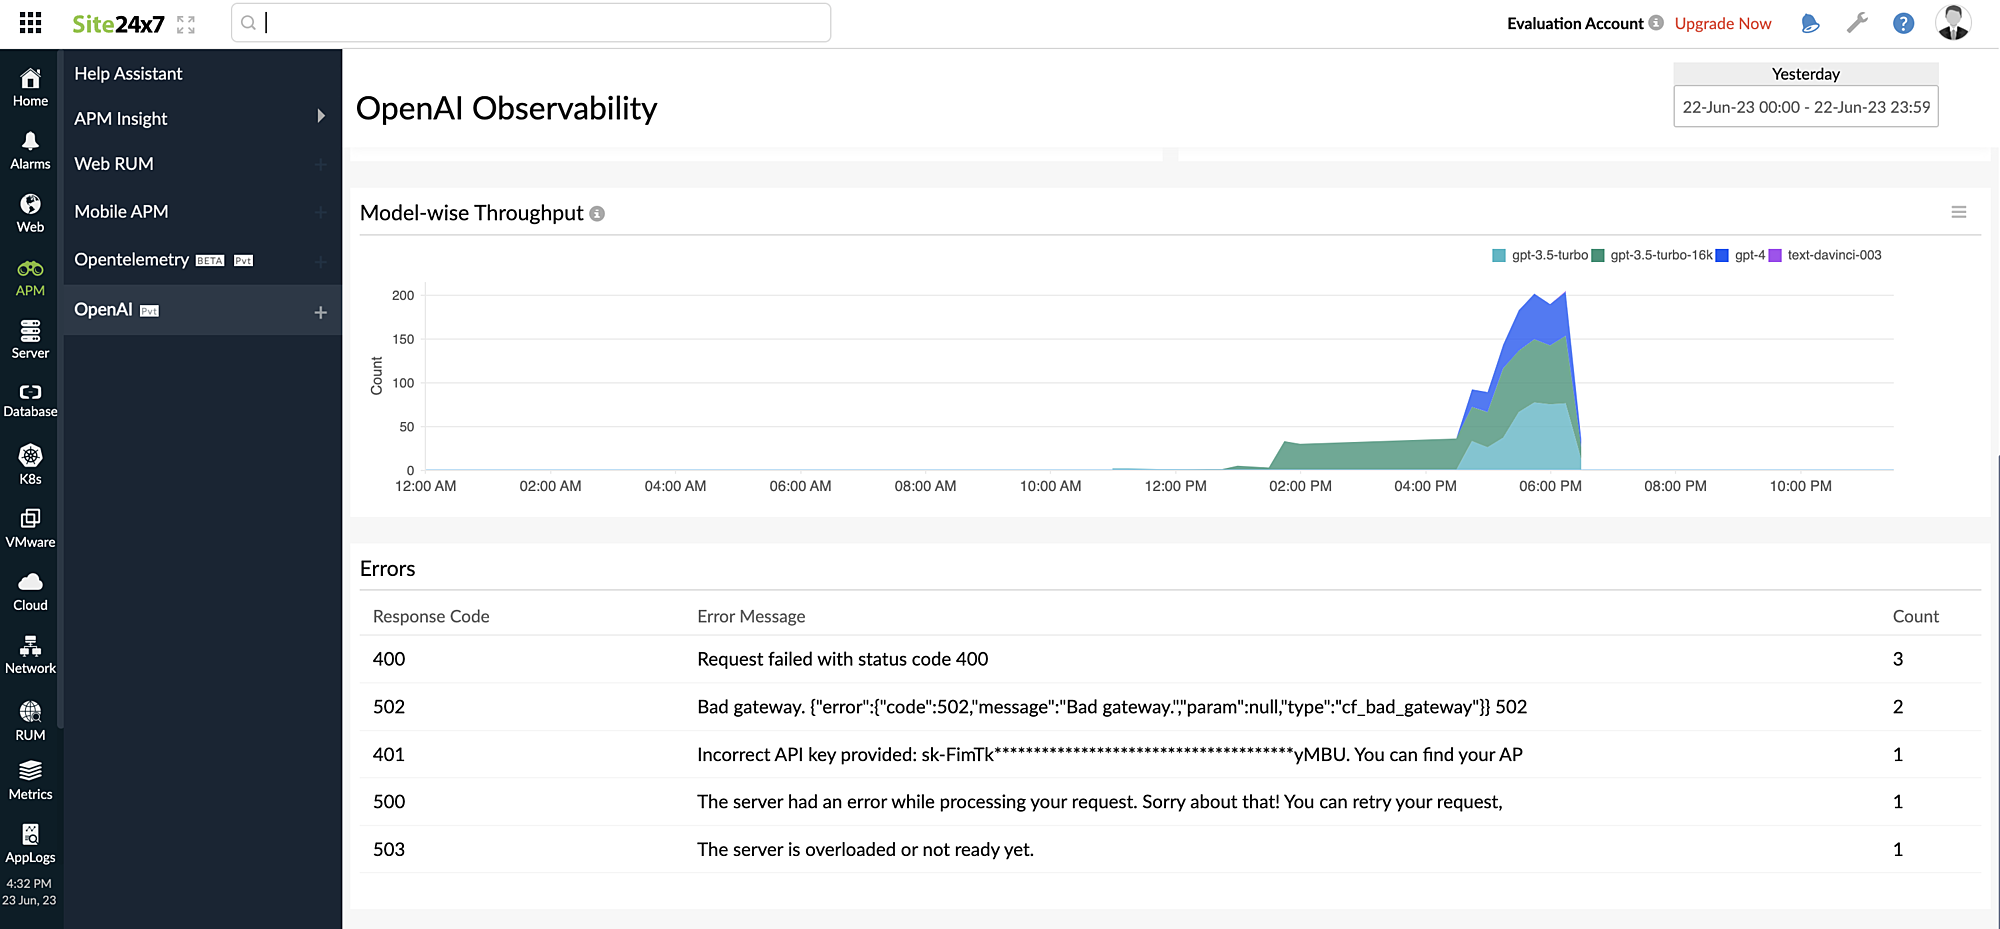
Gives visibility into the total number of requests sent from each model over the specified time period. Hovering over the peaks will give you the precise request count for that model.

Errors
Gives an overall summary on the Response Code, Error Message, and Count for the errors that occurred.
| Parameter | Description |
| Response Code | The HTTP response code of the error |
| Error Message | The complete error message |
| Count | The total number of errors that occurred |
