RUM Monitor Details
Monitoring your web applications using Site24x7 Real User Monitoring (RUM) enables you to assess every aspect of user interactions through various metrics.
You can track essential metrics such as page load times, user satisfaction scores, geographic distribution of users, and more from a customizable and unified console. Additionally, you can analyze data for specific time periods by selecting predefined ranges or customizing the start and end dates to suit your needs.
To begin:
- Log in to the Site24x7 web client.
- Navigate to the RUM icon and select the application for which you want to view metrics.
Note
- You can also access RUM from APM > Web RUM.
- In this scenario, the tabs will be at the top rather than in the left pane.
- In the left pane, you can access different tabs to view various parameters and metrics.
In the right corner, you can decide on the time frame for which you need the metrics.
Summary tab
The Summary tab provides an overview of key performance metrics for your web application.
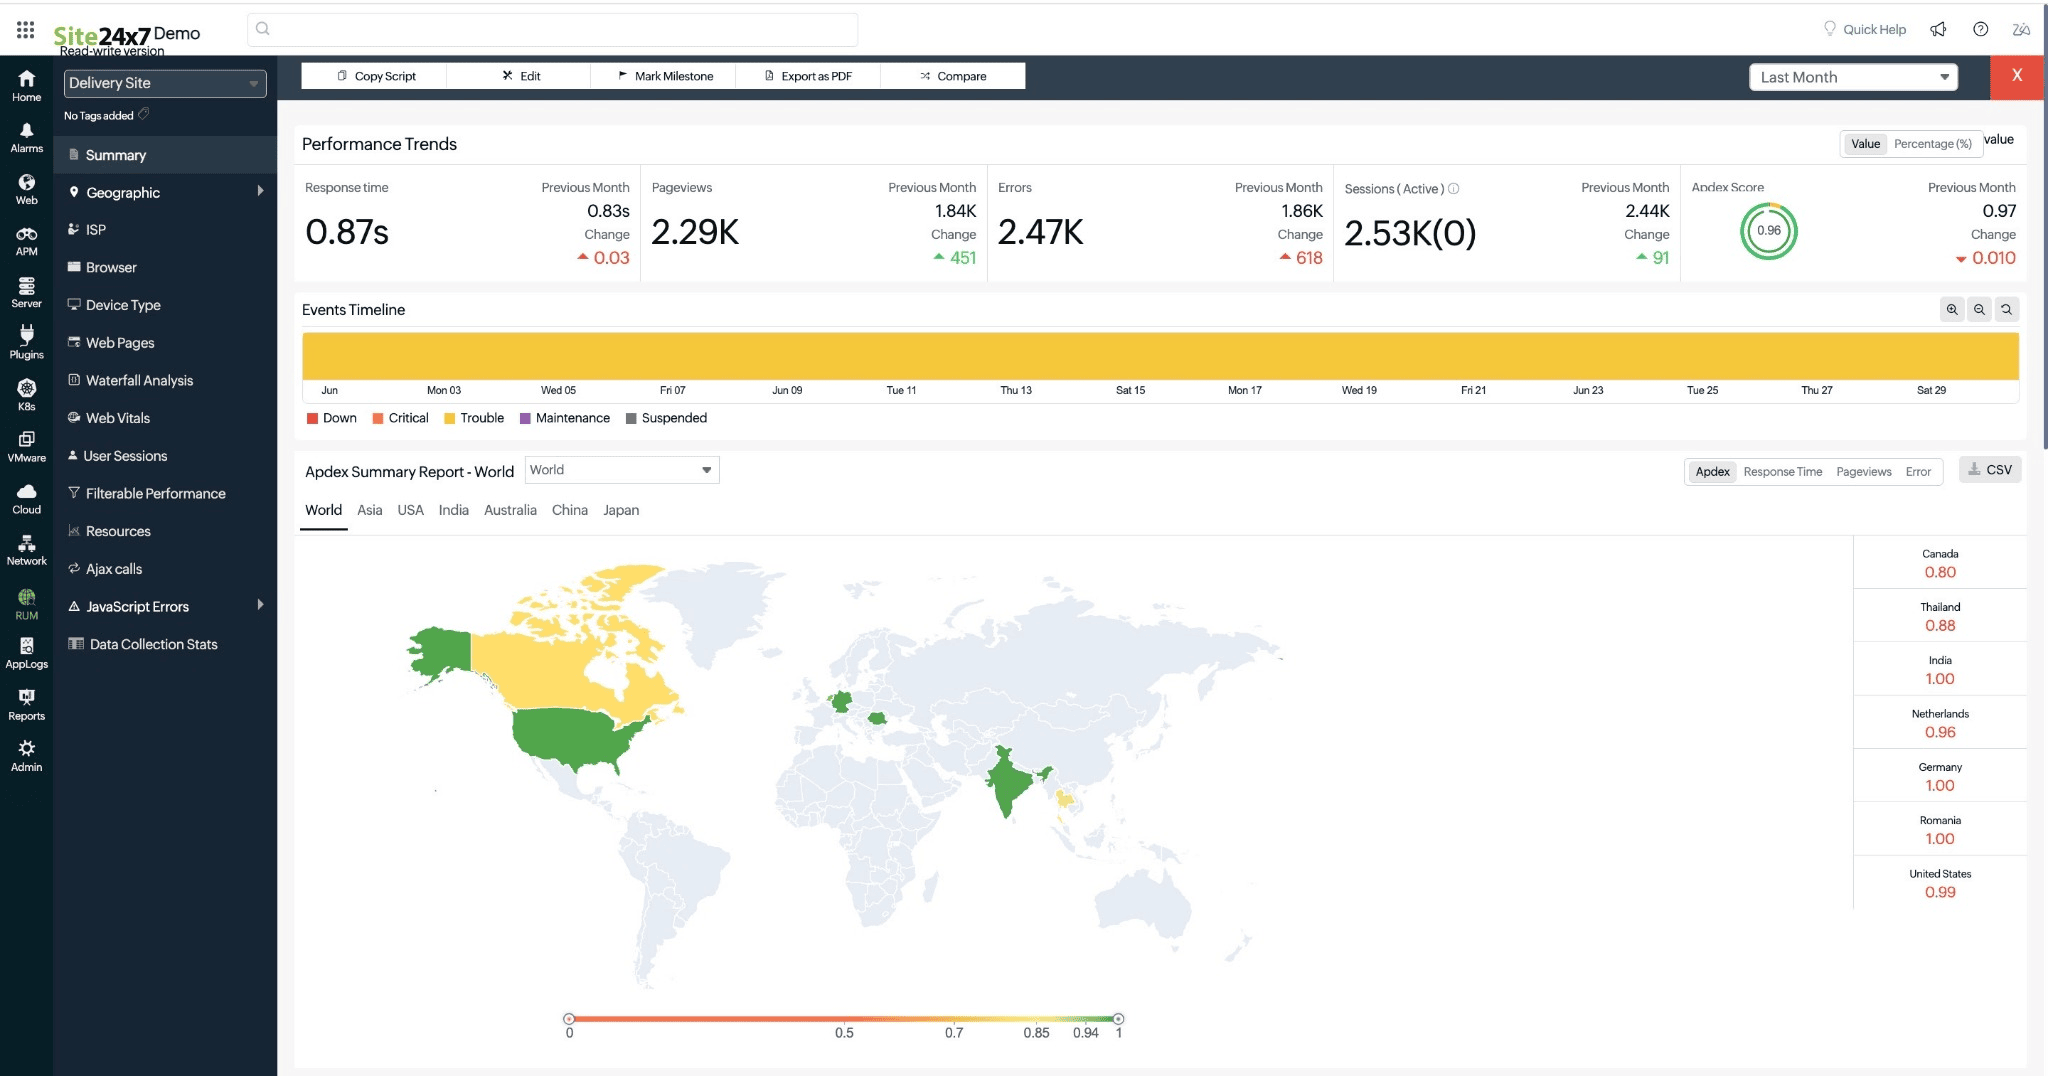
The top band displays the following metrics:
| Metrics | Description |
|---|---|
| Response time | The average time taken for the application to respond to user requests. |
| Pageviews |
The total number of pageviews recorded. Note: In RUM, the licensing is based on pageviews. |
| Errors | The total number of errors encountered. |
| Sessions (Active) | The number of currently active user sessions in the last five minutes. |
| Apdex score |
A numerical measure of user satisfaction. You can update the threshold value in the Edit Monitor Details screen. |
You can also see the comparison of current values with the previous month's values.
Events Timeline
The Events Timeline widget records all the events of your application for a selected time range. You can identify various events from the past, which include Down, Critical, Trouble, or Suspended. Each event is color-coded for easy identification. Hovering over each event displays details about its exact duration.
Summary Report
This presents a world map highlighting the selected metric (Apdex, Response Time, Pageviews, and Error) distribution across different regions.
You can use the tabs on the right side to choose the metric you want to analyze.
Different colors on the map represent varying levels of the selected metric.
Network Path Analysis Using Traceroute
This section displays the results of network route analysis, which identifies the network path a request takes from different locations to your website.
Each node in the traceroute represents a hop in the network path, and the color-coded nodes indicate the status of each hop. For example, a green node might indicate a successful hop, while a red node could indicate a failure or significant delay. To know more, refer to this help documentation.
Response Time
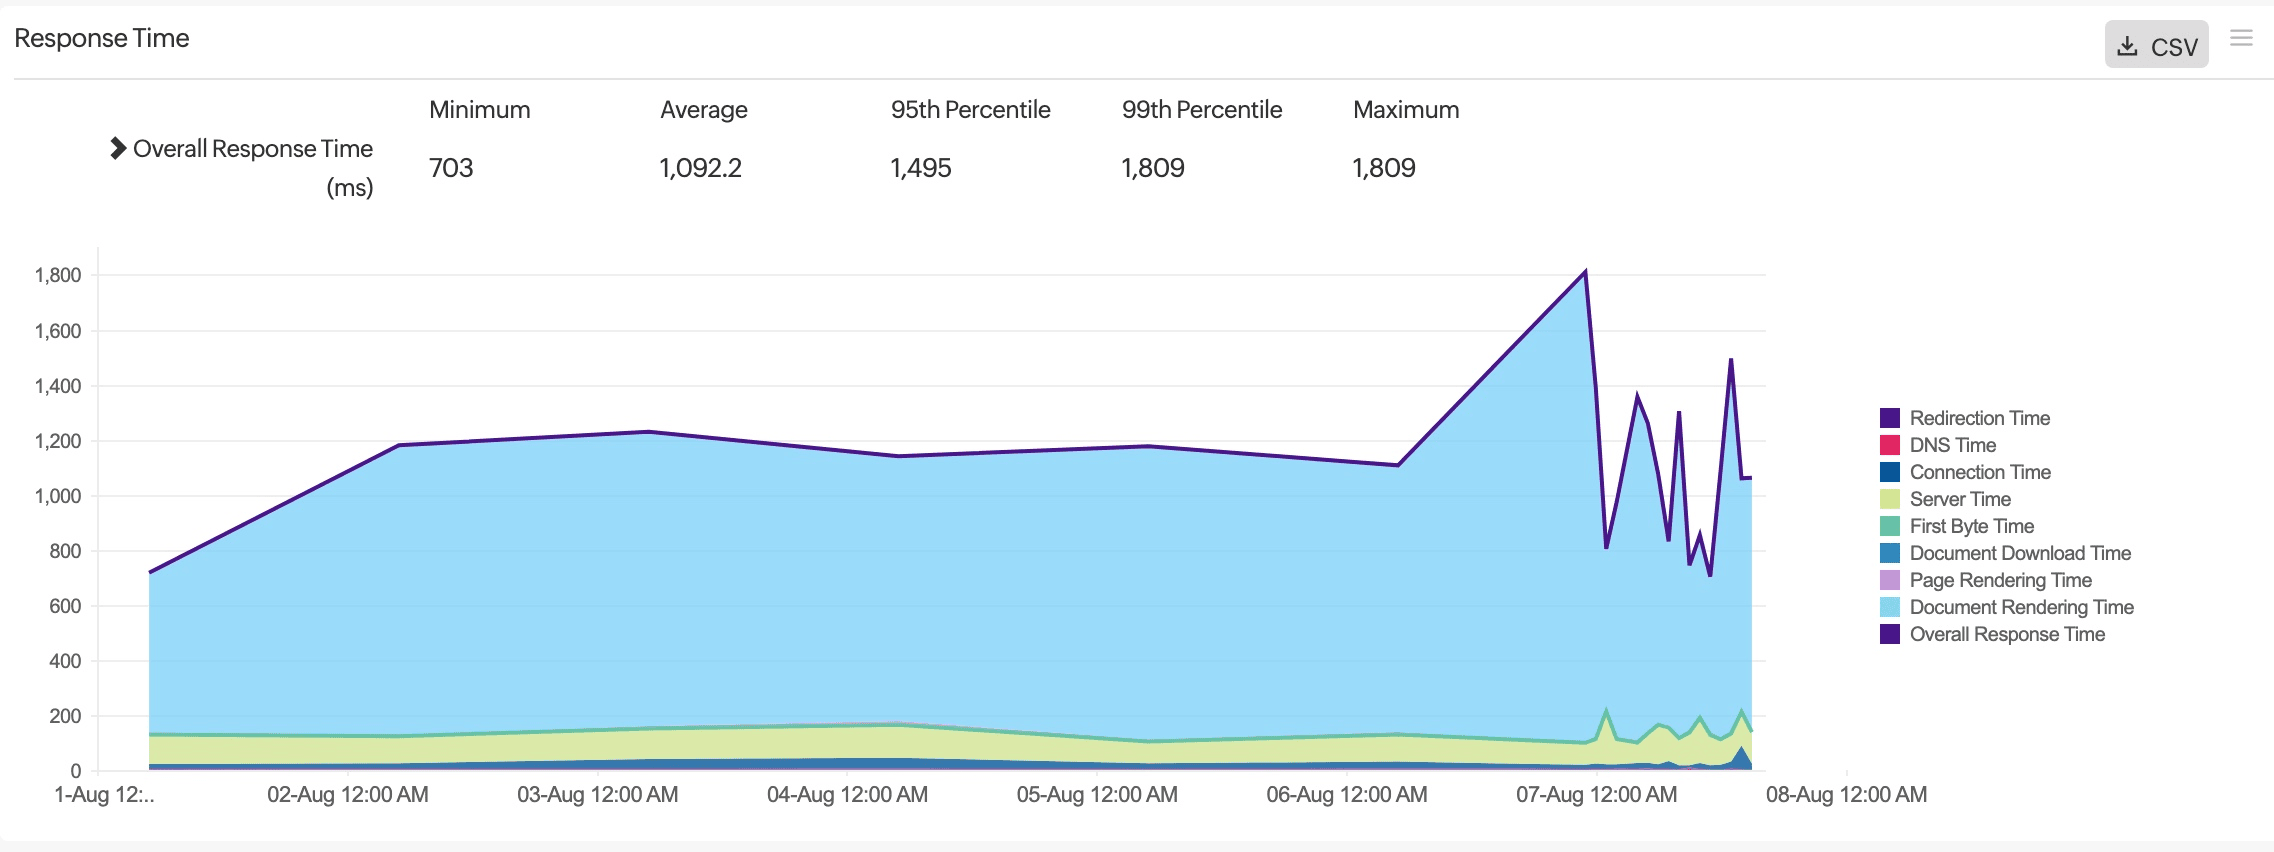
This graph shows the overall response time of your web application over a selected period, along with a breakdown of various components including:
Redirection Time: Time spent on HTTP redirects.
DNS Time: Time taken for DNS resolution.
Connection Time: Time taken to establish a connection to the server.
Server Time: Time taken by the server to process the request.
First Byte Time: Time until the first byte of the response is received.
Document Download Time: Time taken to download the client resources.
Page Rendering Time: Time taken to render the page on the browser.
Document Rendering Time: Total time taken to load and render the document.
Overall Response Time: Sum of all the above components.
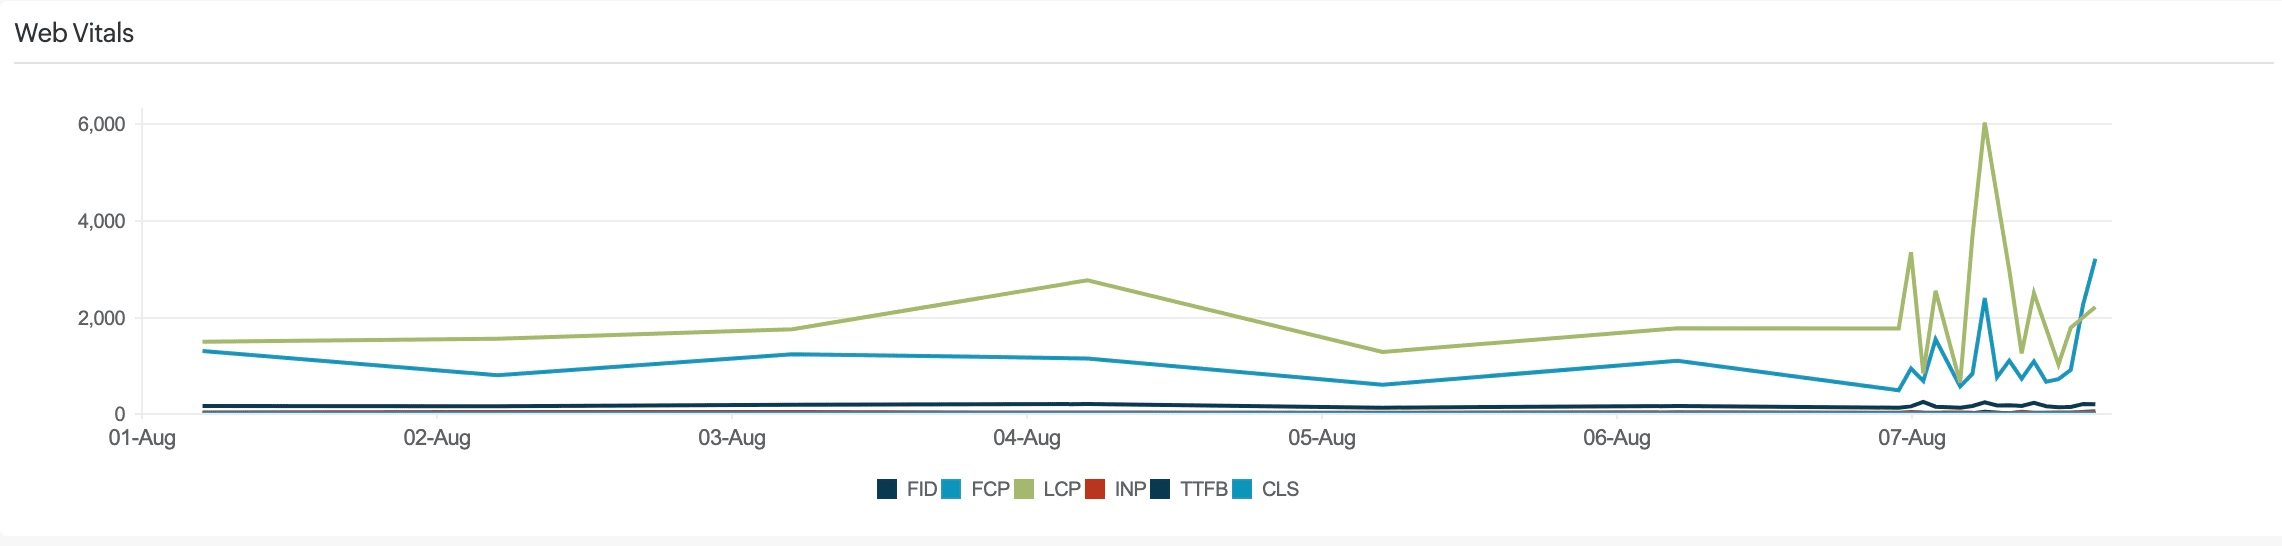
Web Vitals
This graph displays core web vitals metrics over a selected period.
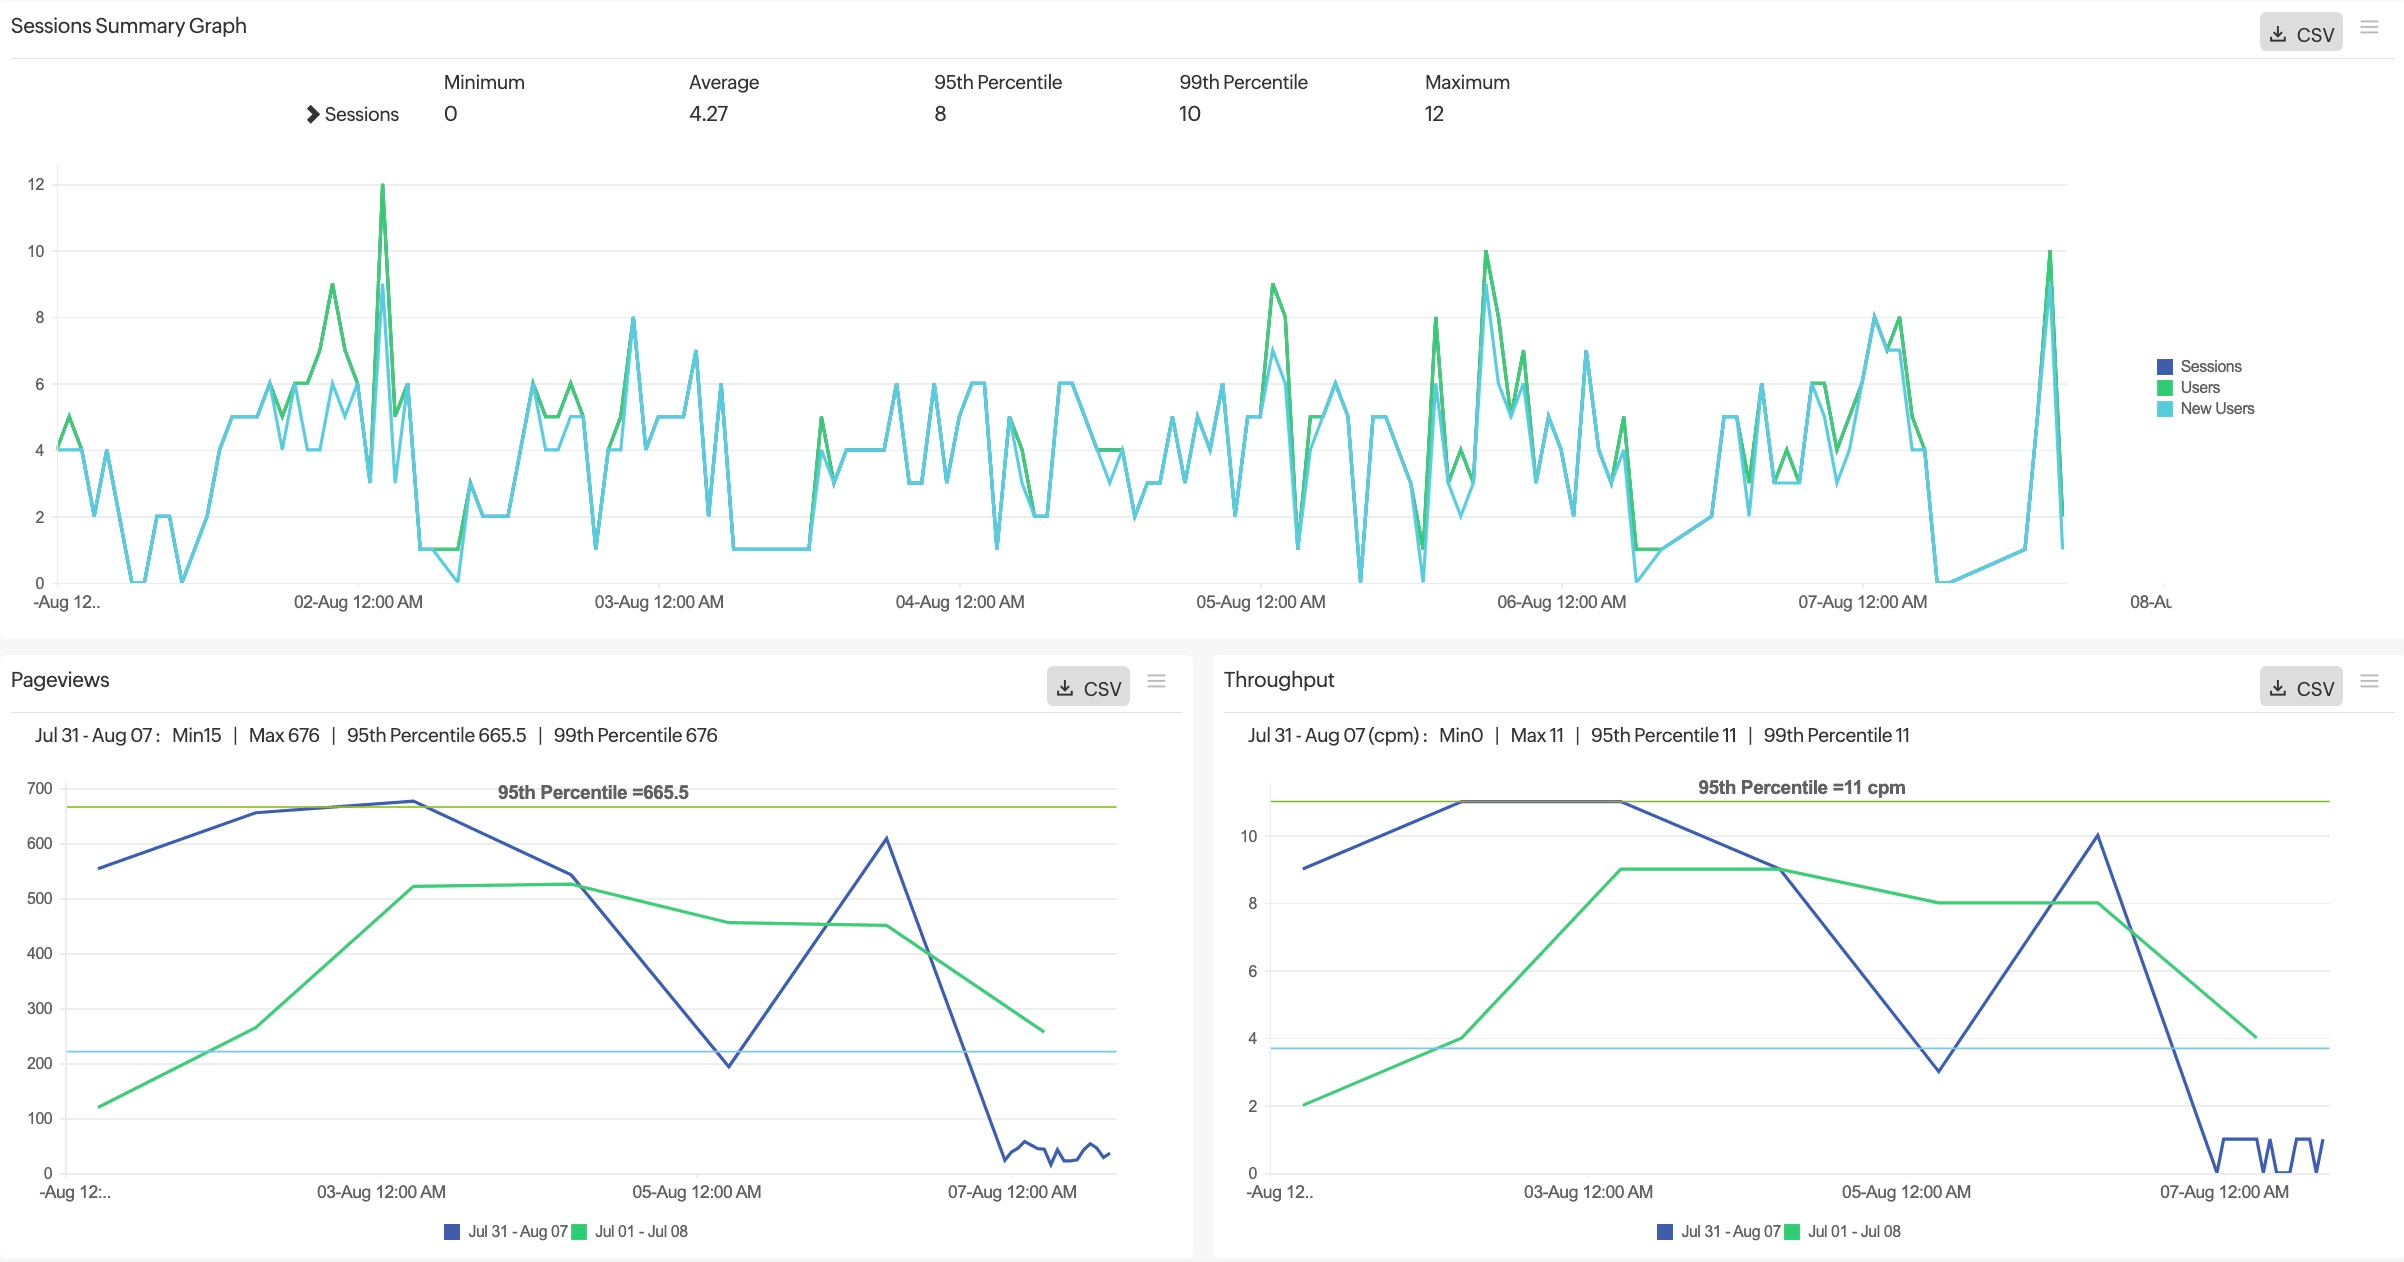
Sessions Summary Graph
This graph summarizes user sessions over a selected time period, with different color codes representing metrics such as Sessions, Users, and New Users.
Pageviews
This graph displays the number of pageviews consumed over time.
Throughput
The Throughput graph measures the number of completed and incomplete requests (counts per minute - cpm) over time.
Geographic tab
This tab shows a graphical representation of the application's metrics such as Apdex, Response Time, Pageviews, and Error globally, reflecting the overall user experience. The metrics listed above are available for all countries. Select the required country/World from the drop-down menu or the tab to access the map (Summary Report). You can hover over the regions to see the general metrics, and you can also drill down into the country maps directly from the World map by clicking on them.
Network Path Analysis Using Traceroute
This section displays the results of network route analysis.
Geographic Summary
This table gives you an at-a-glance view of how your application is performing in different regions. By comparing Apdex scores, response times, pageviews, and throughput across locations, you can identify regions with potential performance issues or areas where user satisfaction might be lower.
| Parameter | Description |
|---|---|
| Location | Geographical locations (countries or regions) where your users are accessing the application. |
| Apdex | The Apdex score of that location. |
| Avg. Resp. Time | The average time it takes for the application to respond to user requests from that location. |
| Pageviews | The total number of pageviews from that location. |
| Throughput (rpm) | The number of requests handled by the application per minute (rpm) from that location. |
ISP tab
This tab provides insights into the performance of your application based on the ISPs used by your users.
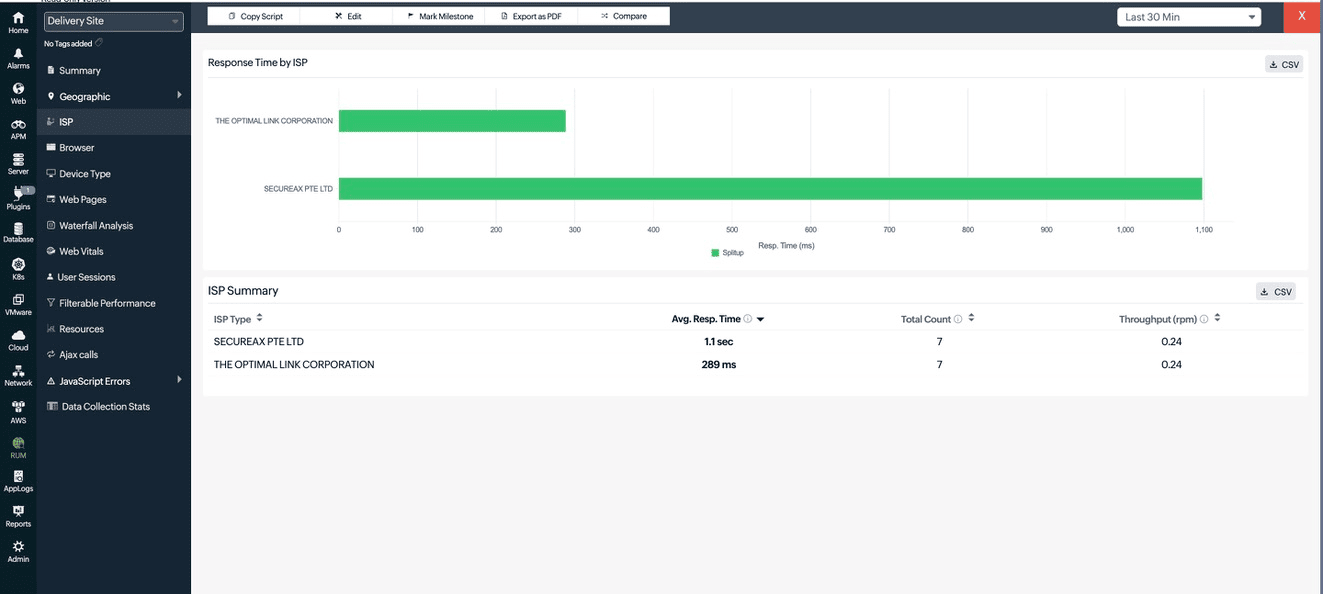
ISP Summary
| Parameter | Description |
|---|---|
| ISP Type | The names of the ISPs your users are connecting through. |
| Avg. Resp. Time | The average time taken by the application to respond to requests from users on that ISP. |
| Total Count | The number of requests or sessions recorded from users on that ISP. |
| Throughput (rpm) | The number of requests handled by the application per minute (rpm) from that ISP. |
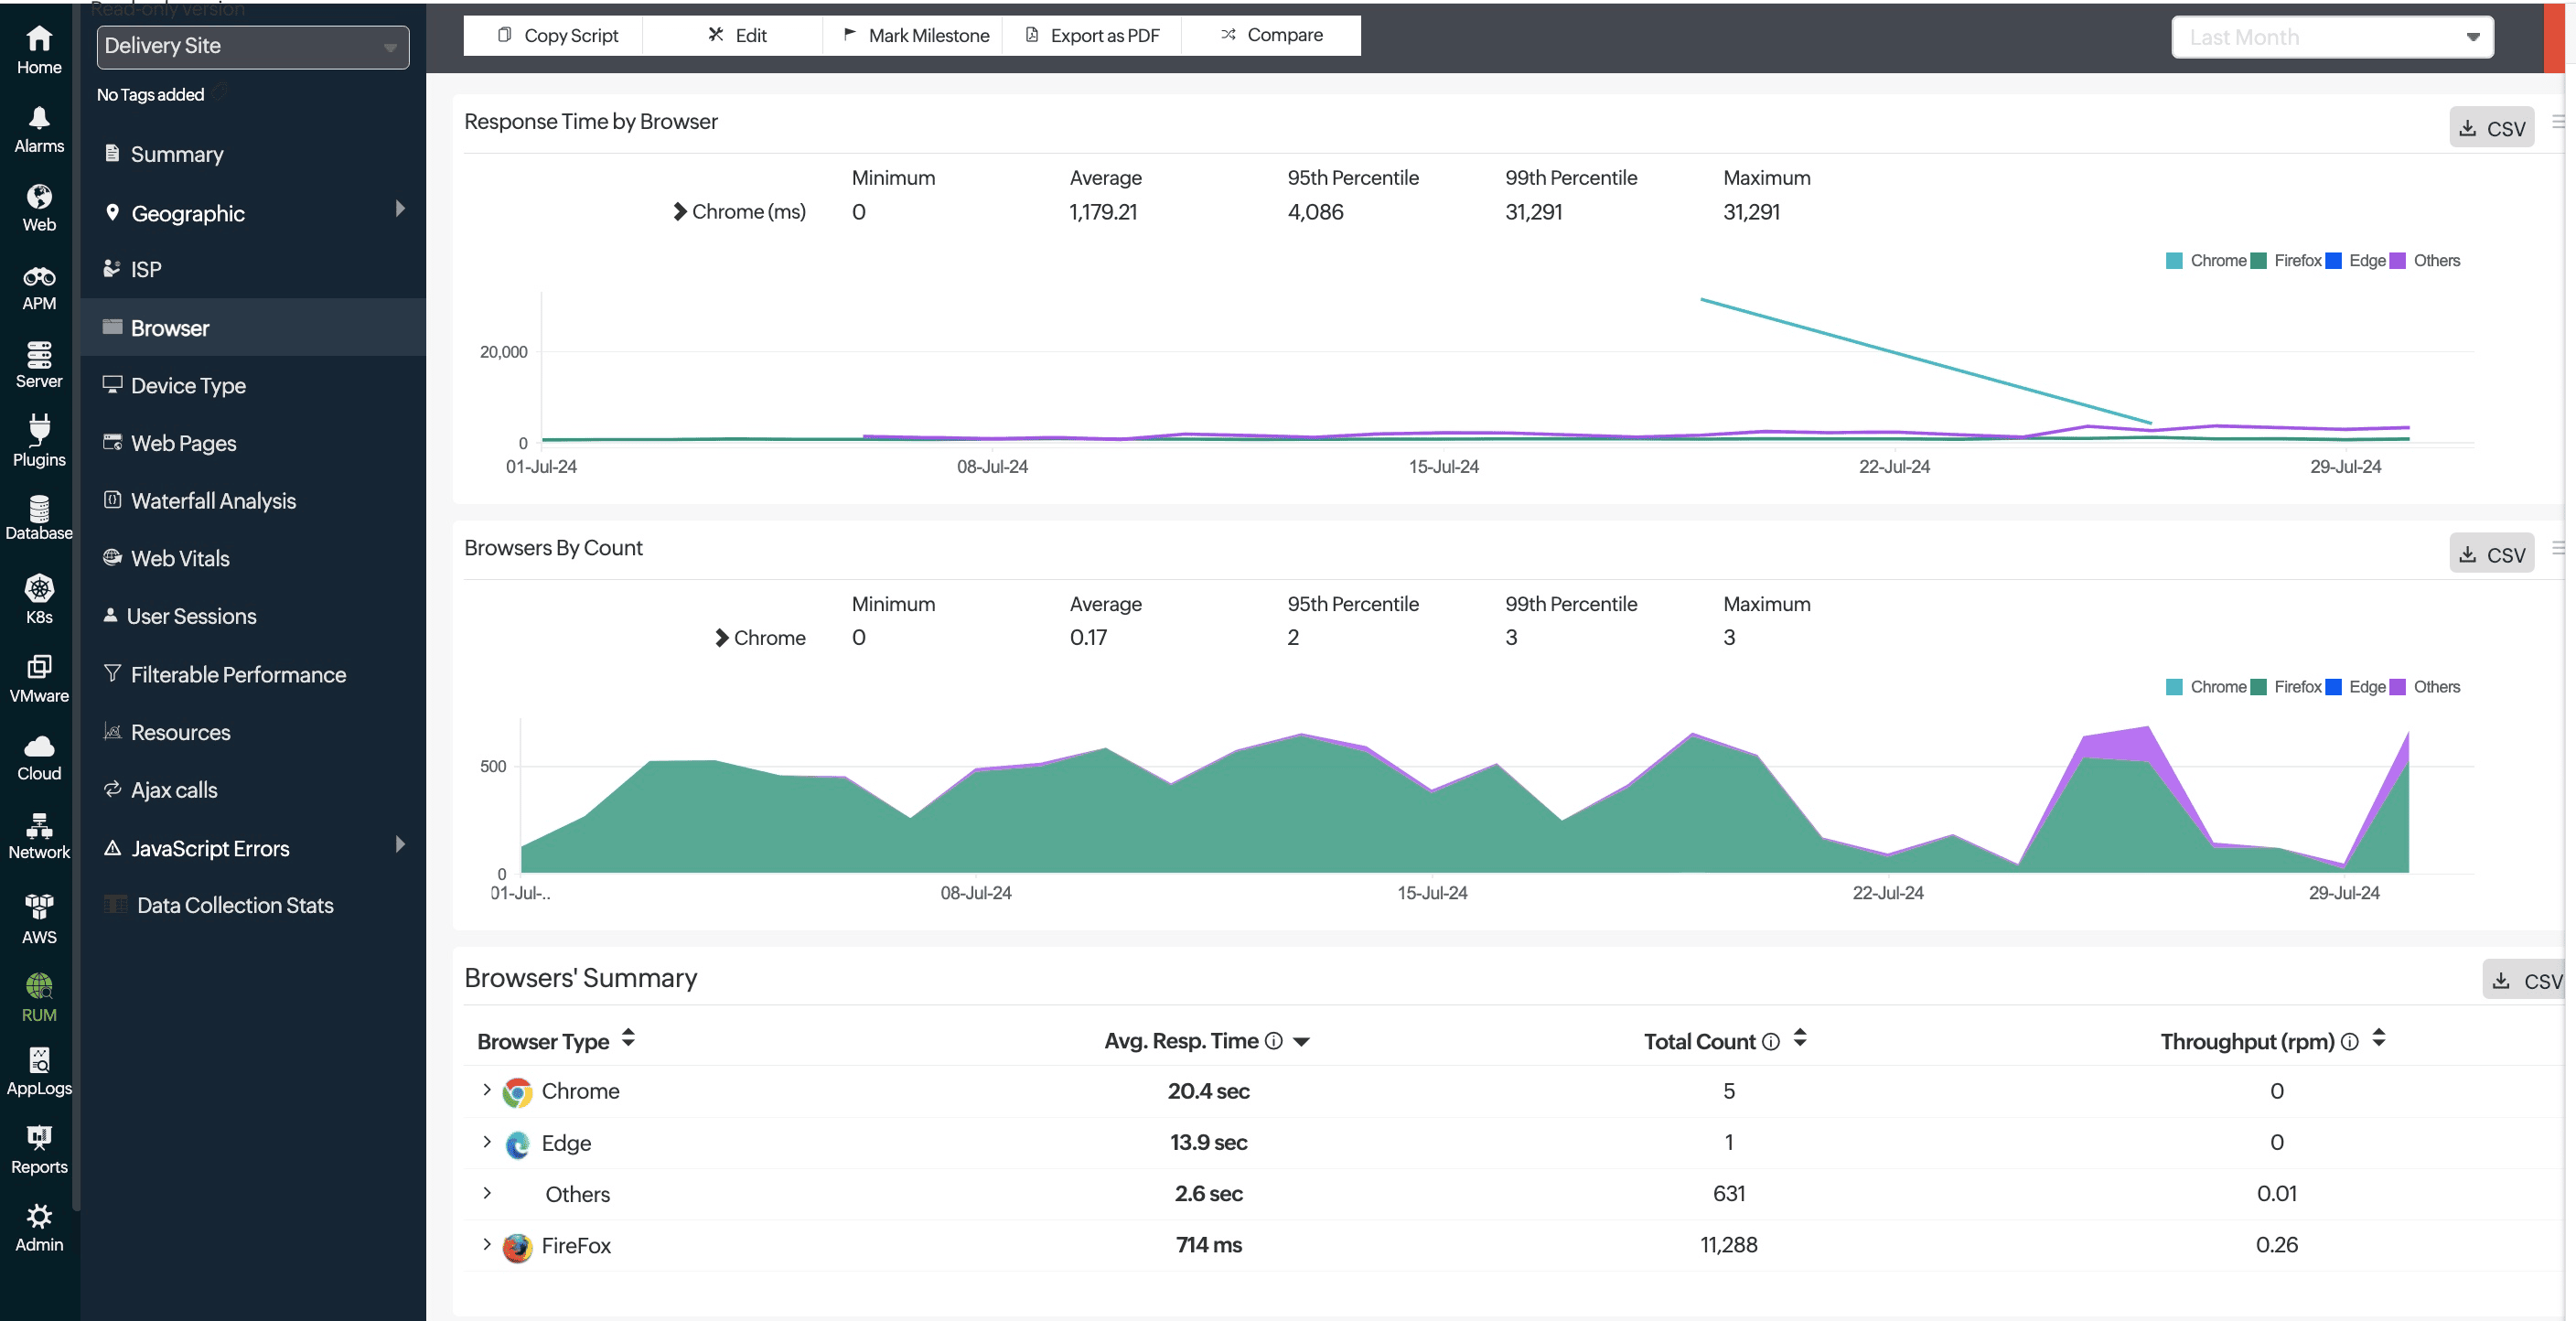
Browser tab
Clicking on the Browser tab displays the average response time split by browser type, along with the request count received by each browser. It provides a summary of average response time, throughput, and total request count for individual browser versions, allowing for detailed analysis of performance across different browsers.
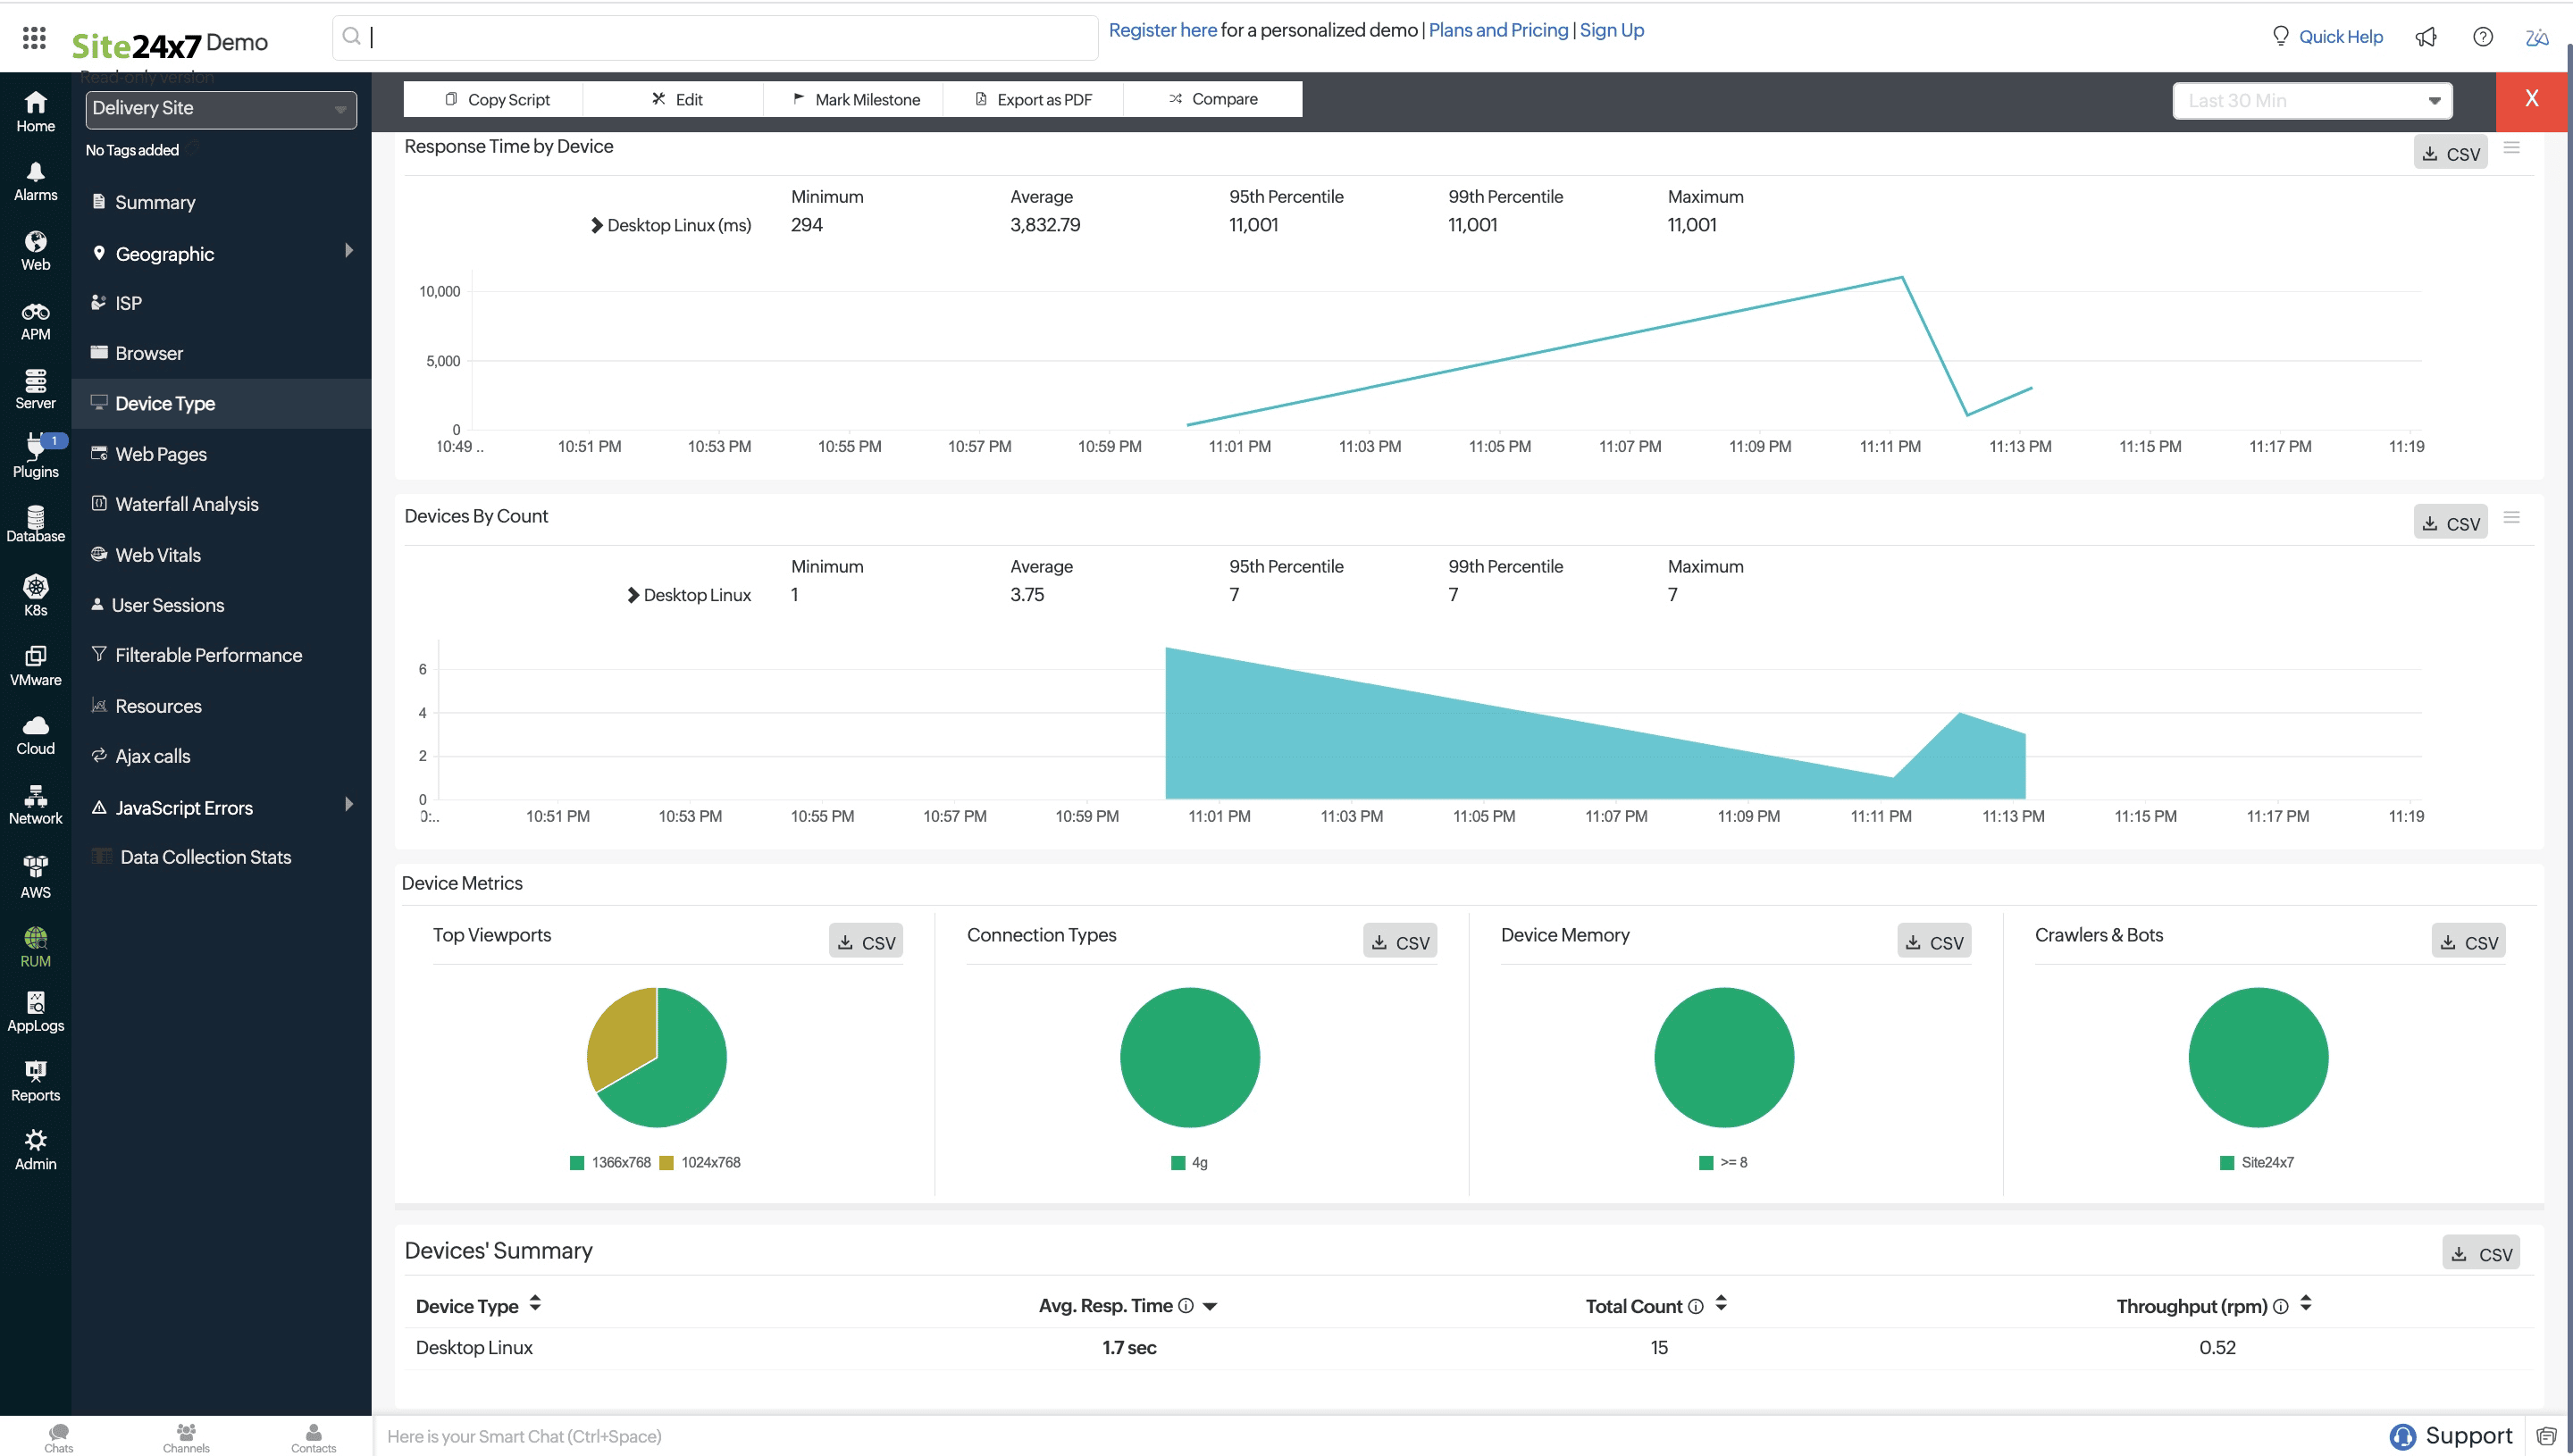
Device Type tab
Clicking on the Device Type tab provides a detailed analysis of your application's performance across different device categories. You can view the average response time and the number of requests received from each platform or operating system, such as Windows, macOS, and Linux. Additionally, the tab offers insights into viewports, connection types (for example 4G), device memory, and crawlers and bots helping you understand the user experience across various platforms.
These details are gathered only from supported browsers.
Web Pages tab
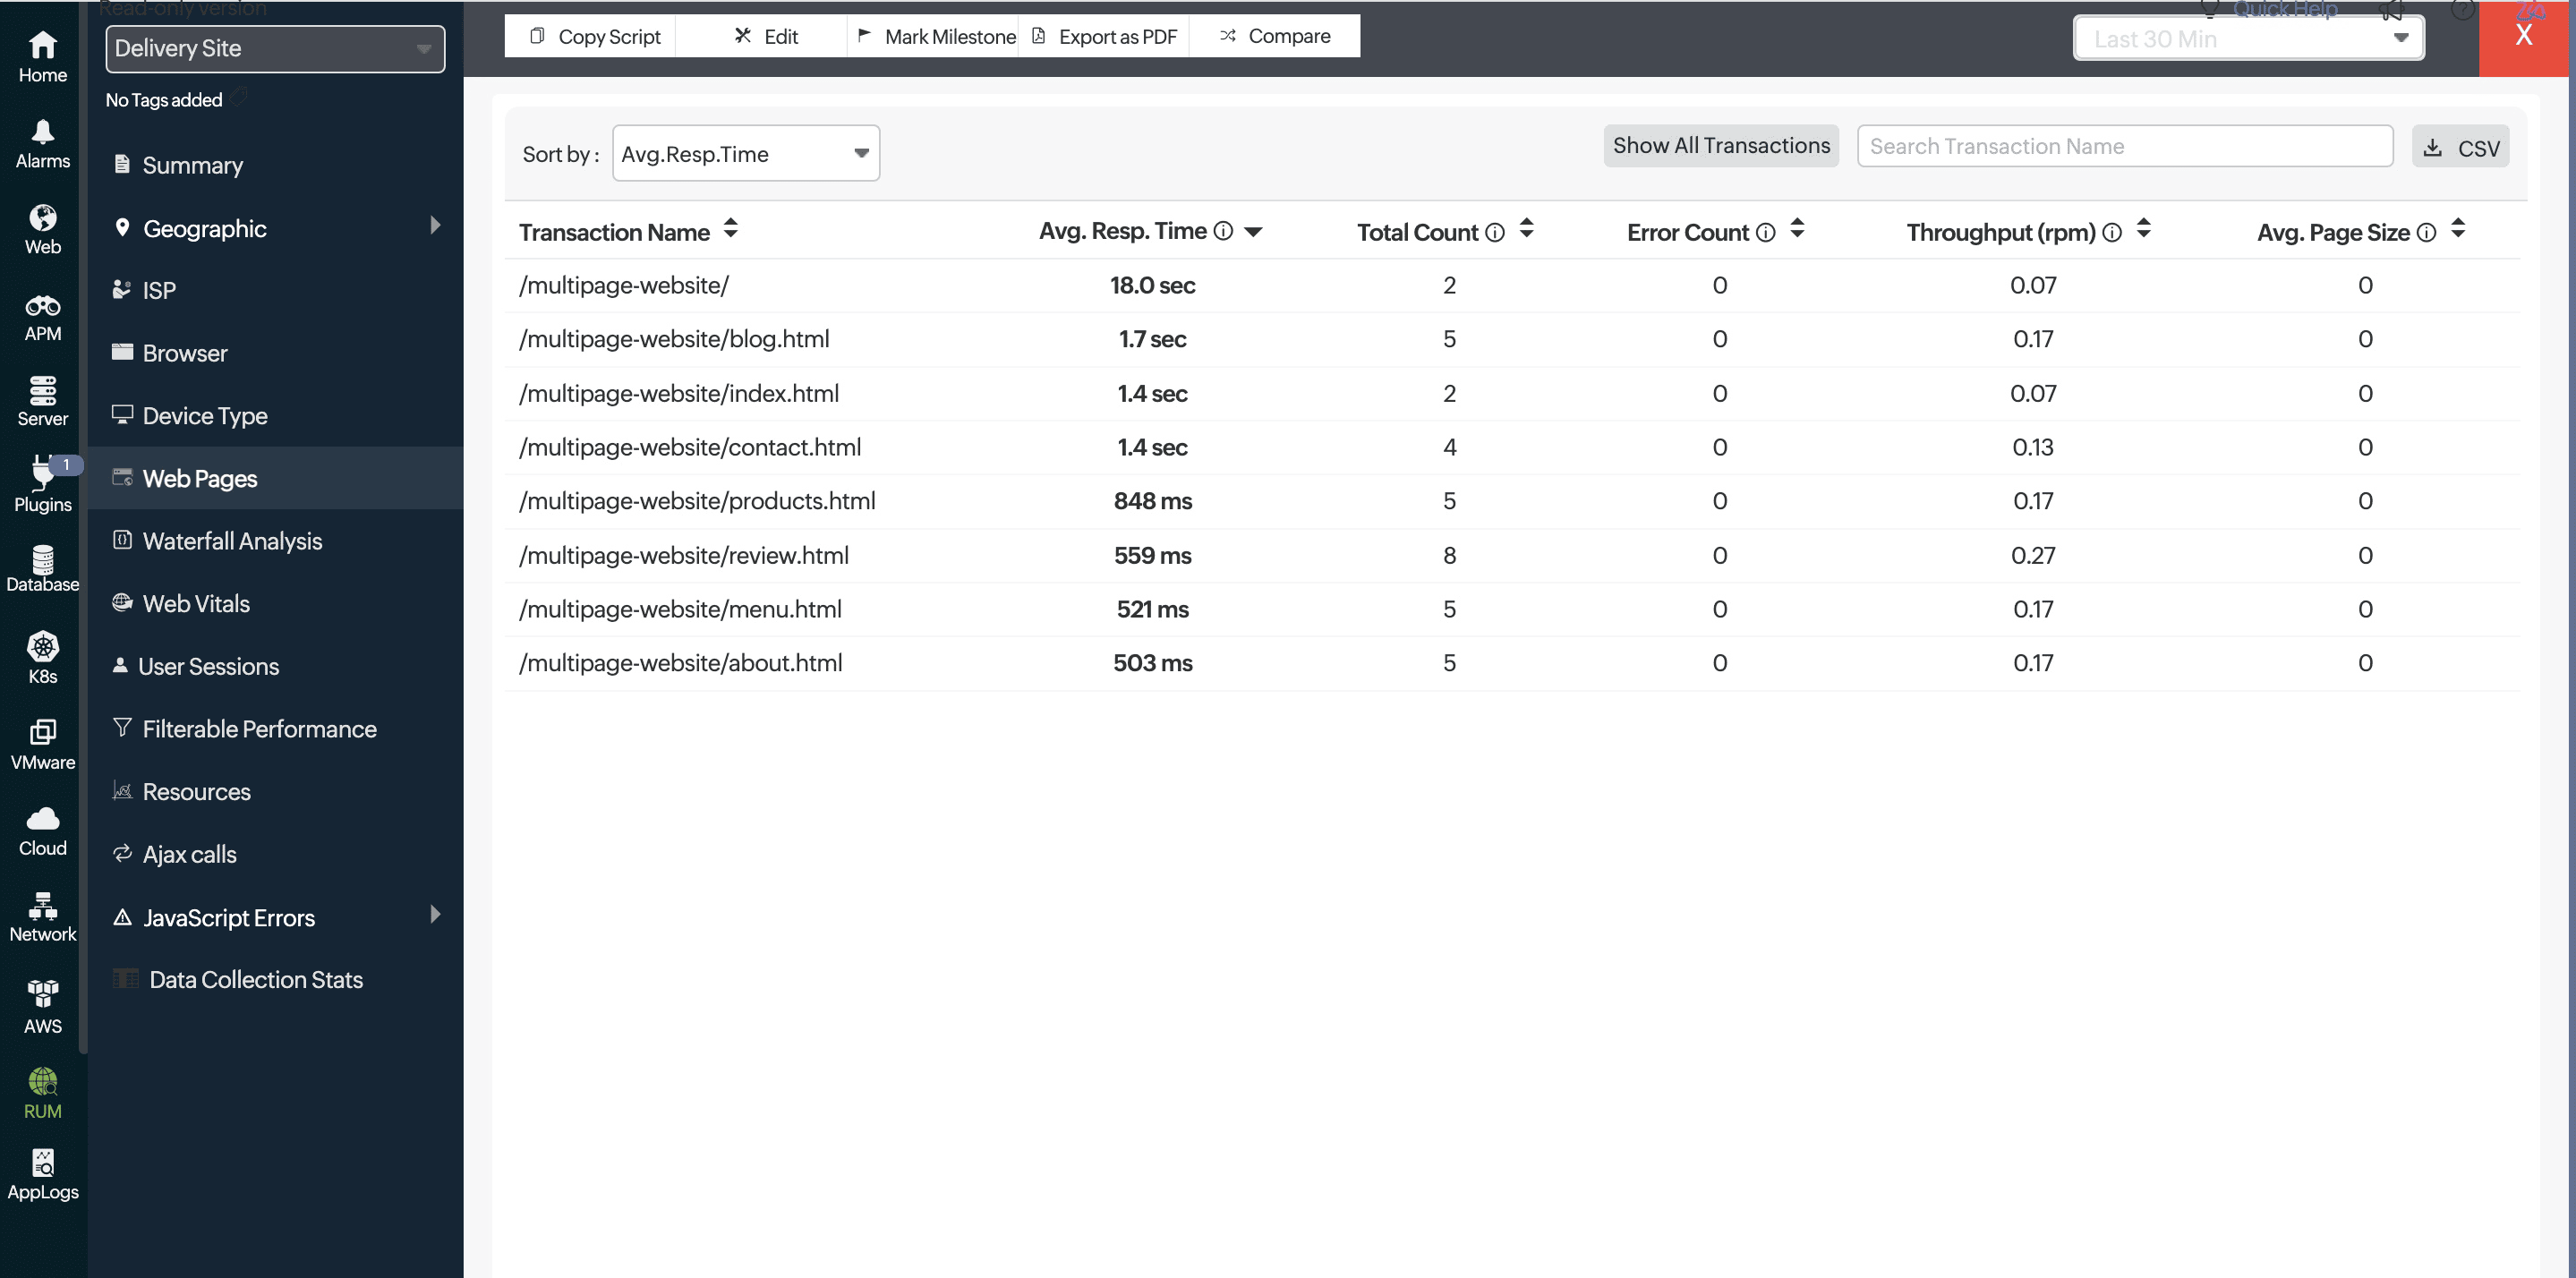
The Web Pages tab provides a detailed breakdown of your website's performance across various pages. It shows key metrics such as the average response time for each page, total count of requests, error counts, throughput (requests per minute), and average page size. This data helps you identify which pages are performing well and which ones may need optimization, enabling you to ensure a smoother and more responsive user experience across your site.
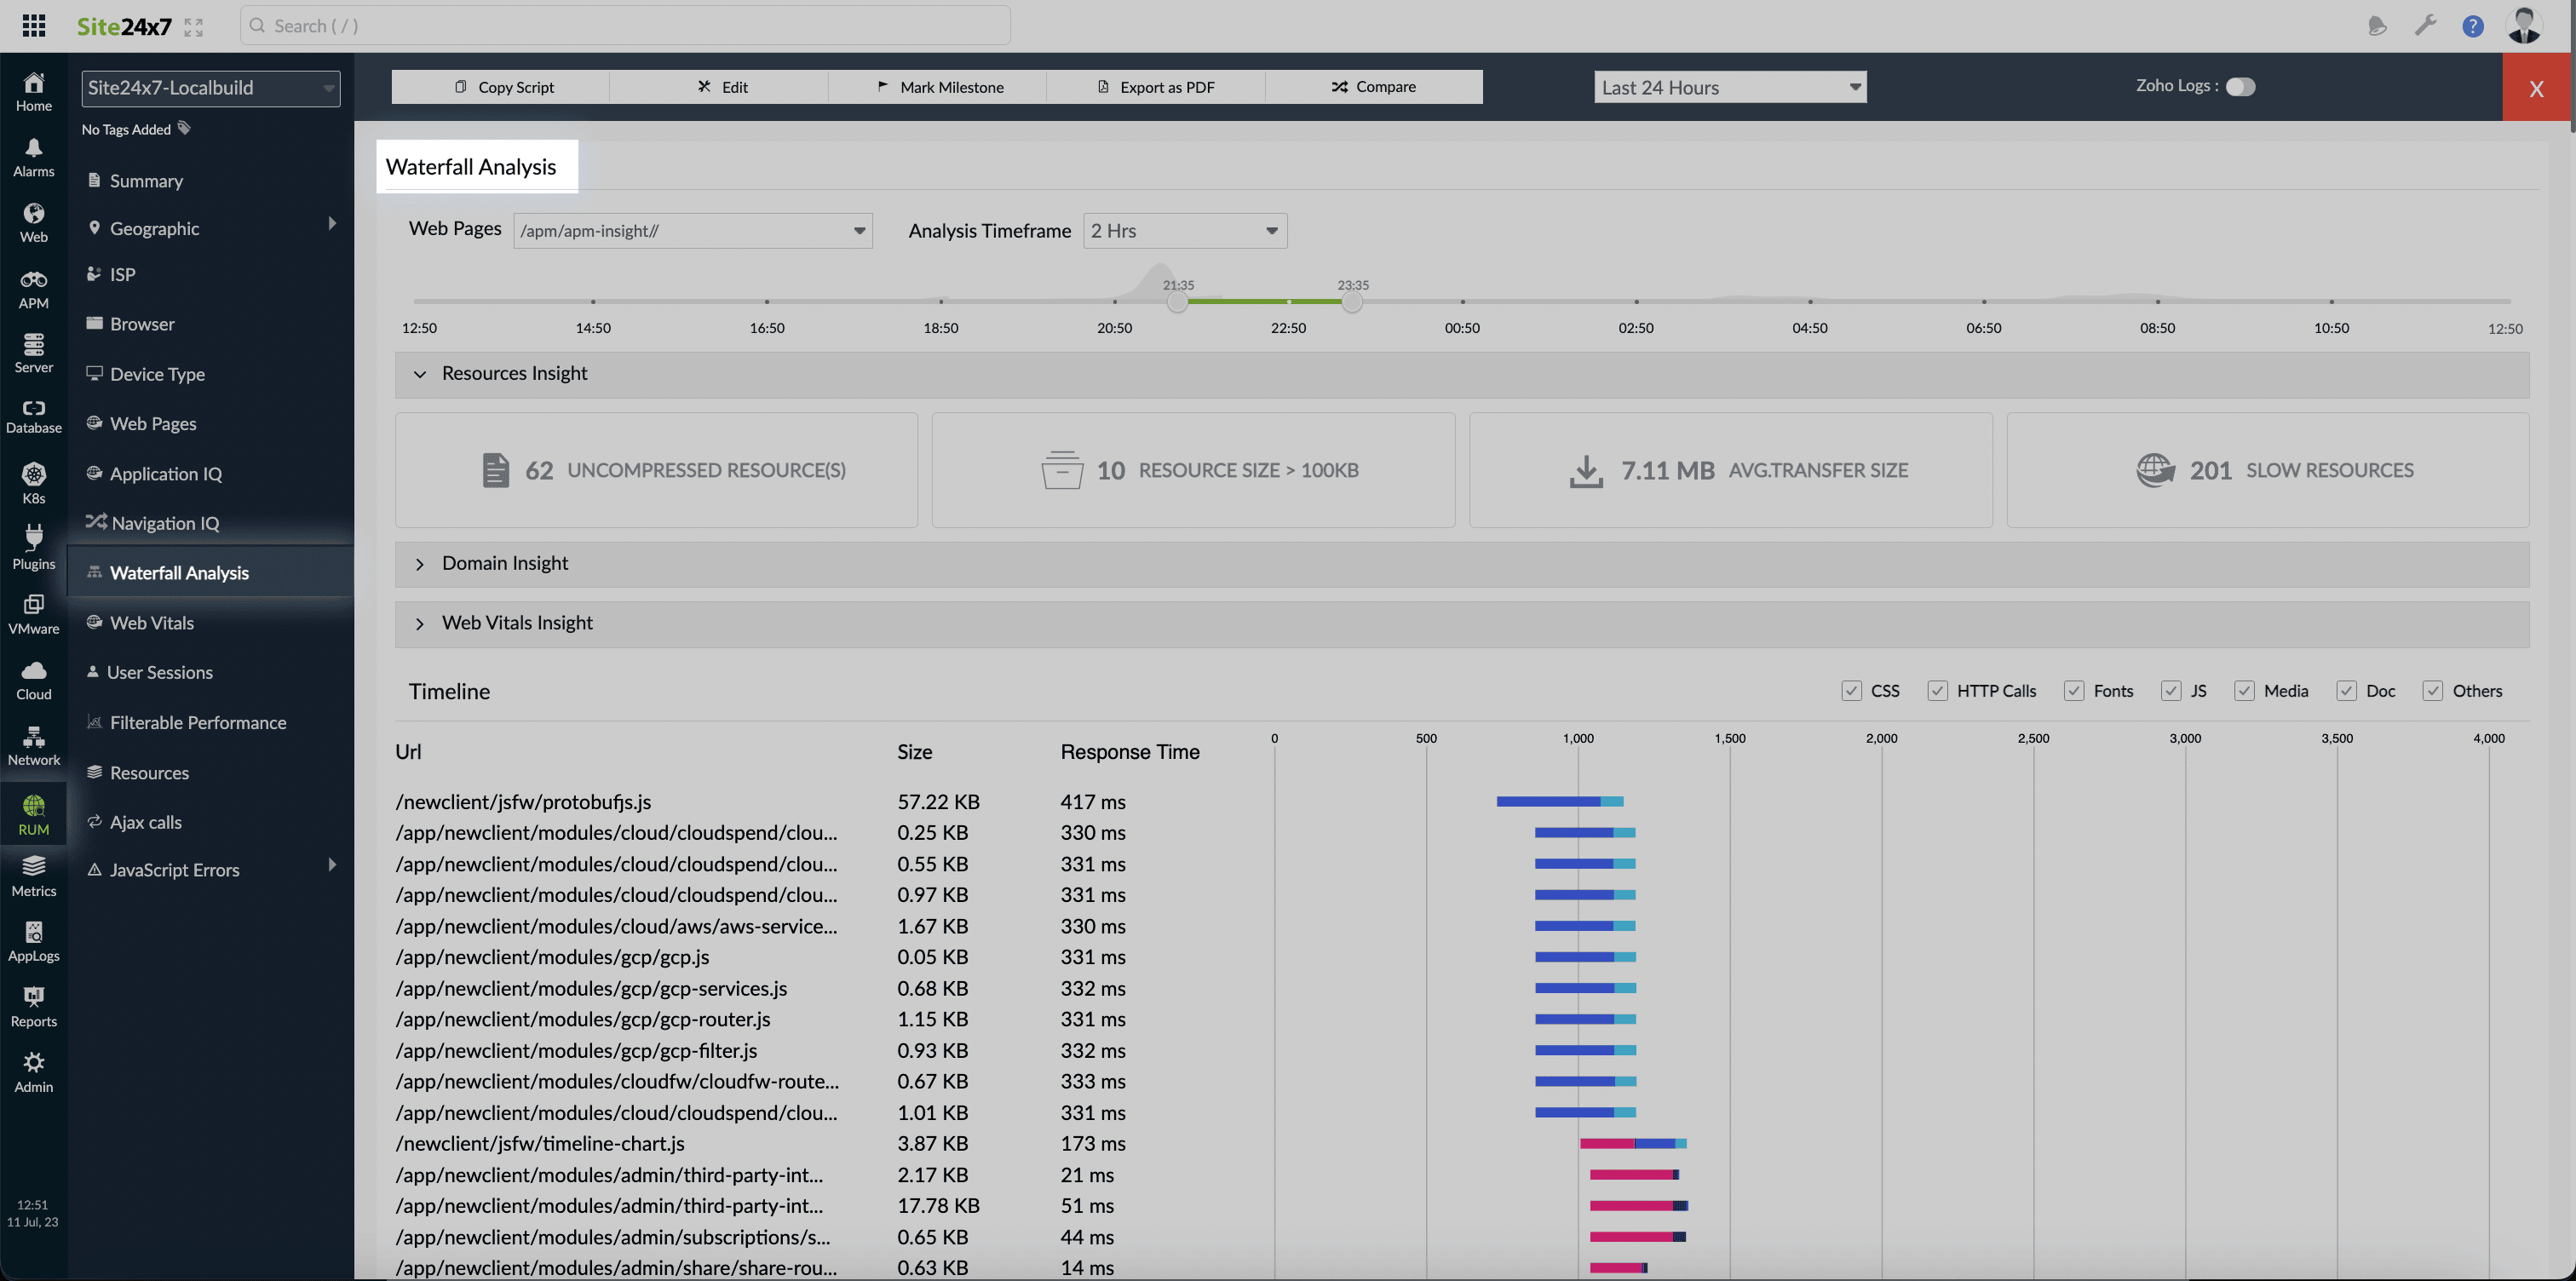
Waterfall Analysis tab
The Waterfall Analysis tab provides a detailed breakdown of the load times for all resources on a webpage. It visually displays each resource's loading sequence, time taken, and potential bottlenecks, allowing you to identify areas for performance optimization. This tab is crucial for understanding how each component of a page contributes to the overall load time and for improving user experience. Learn more.
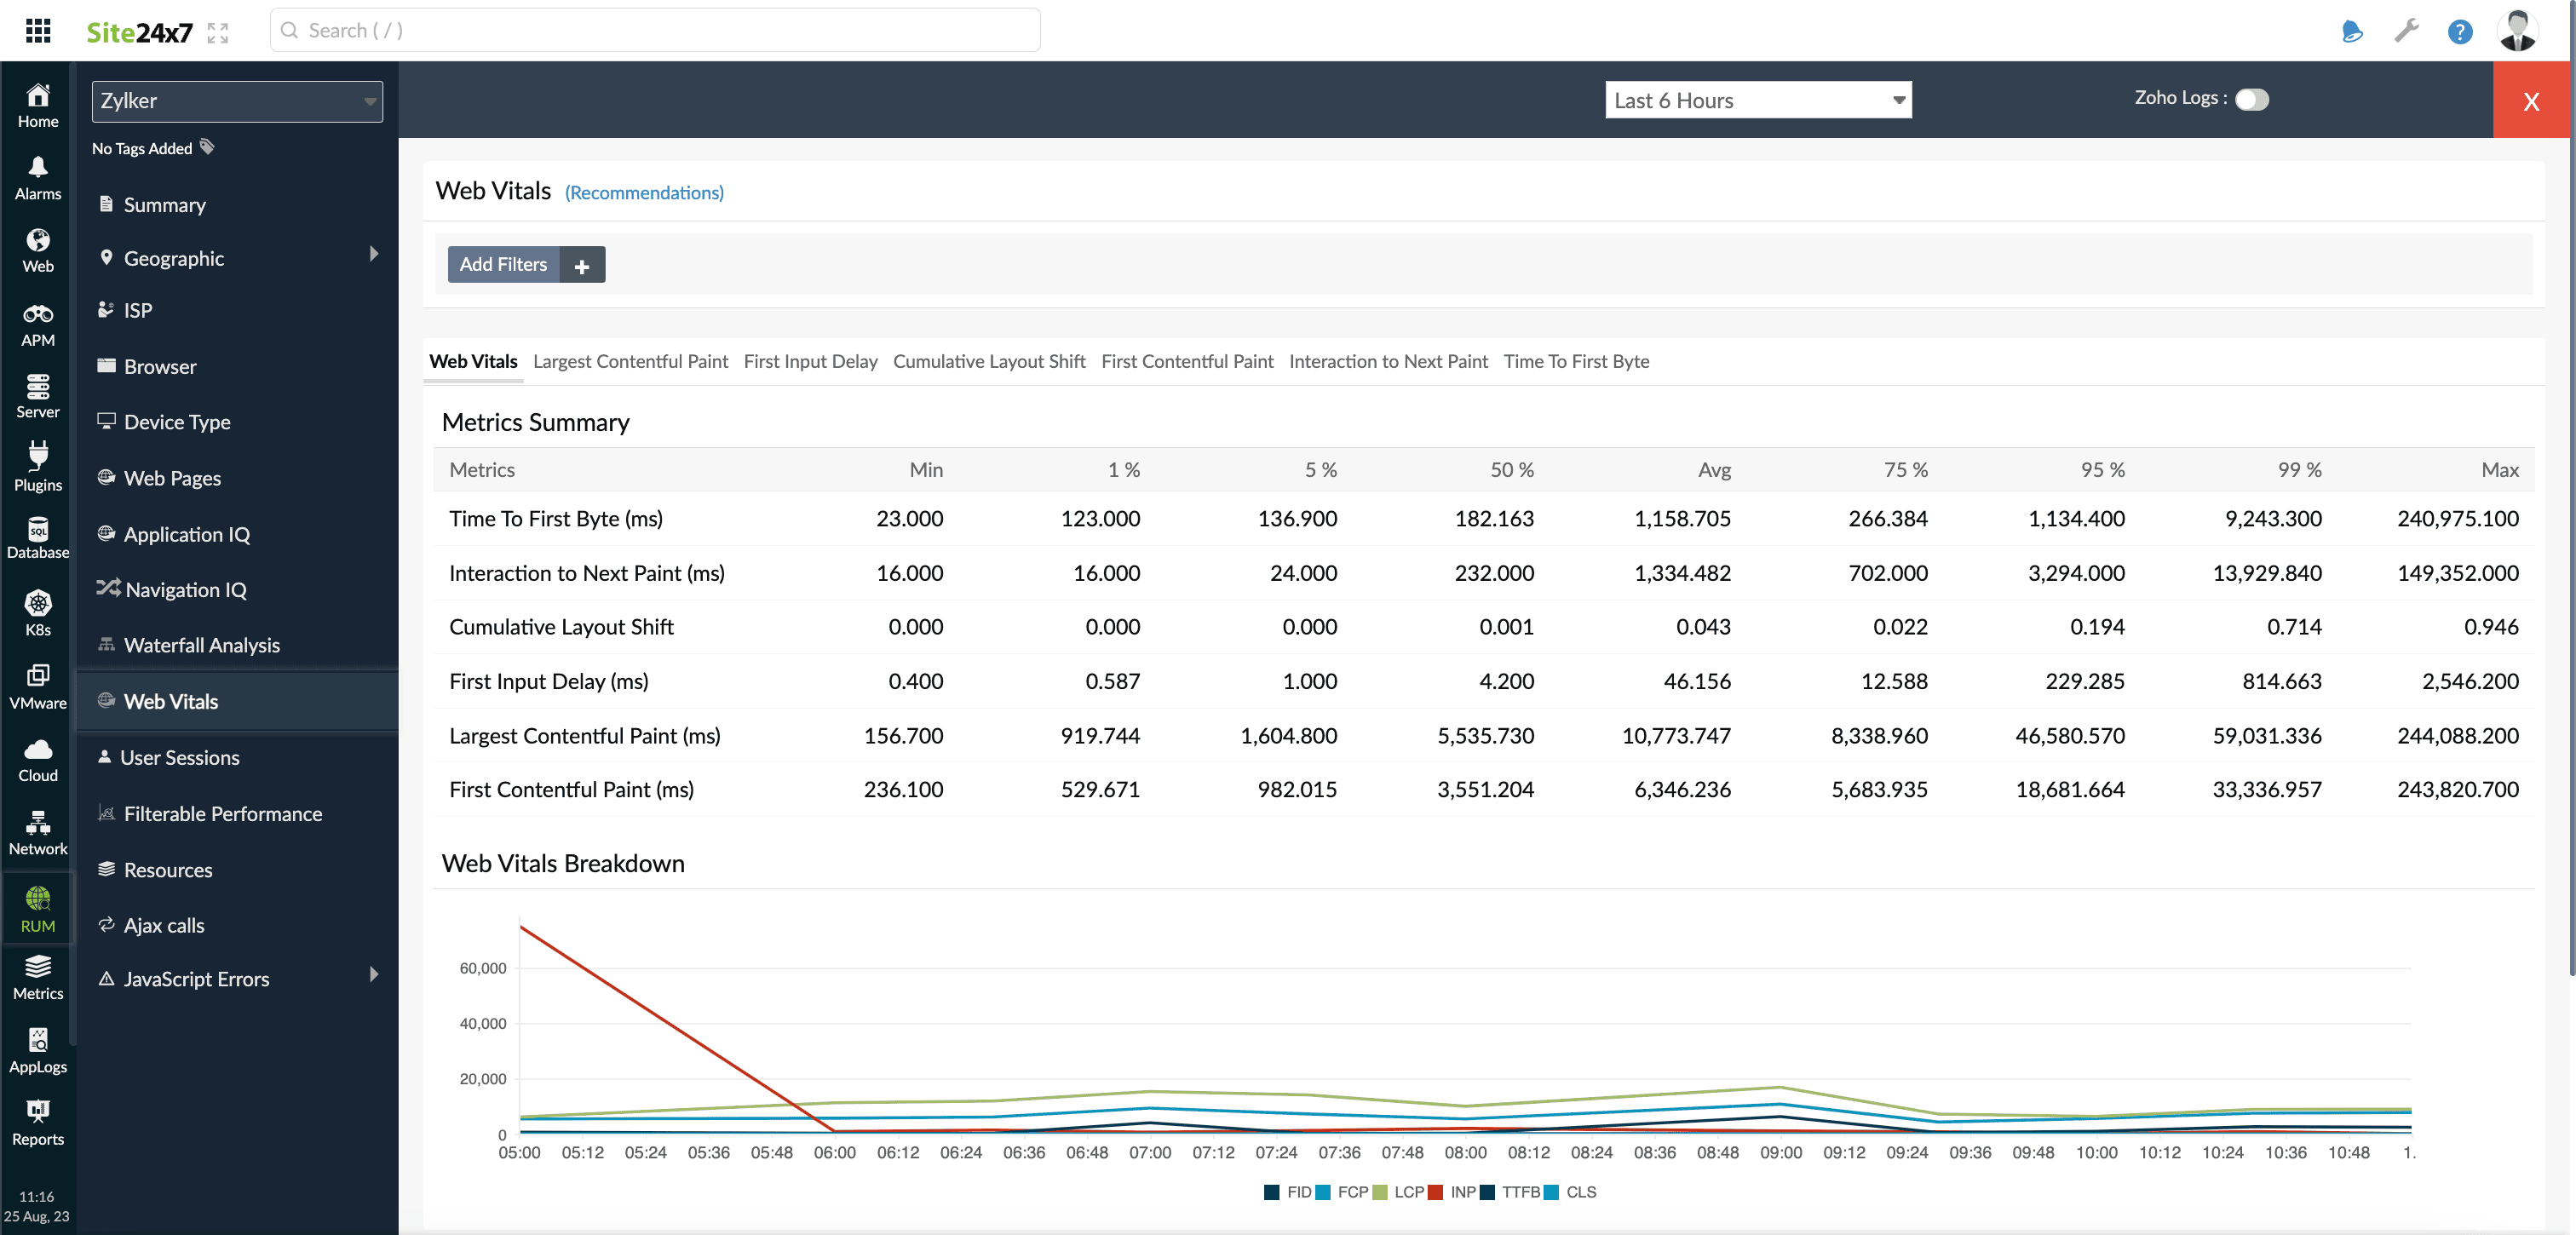
Web Vitals tab
The Web Vitals tab monitors essential metrics that affect user experience, including Largest Contentful Paint (LCP), First Input Delay (FID), Cumulative Layout Shift (CLS), First Contentful Paint (FCP), Interaction to Next Paint (INP), and Time to First Byte (TFB). These metrics help you assess the performance and stability of your web pages, ensuring a smoother and more responsive user experience. Analyzing these metrics allows you to pinpoint and improve areas impacting load times and interaction quality. Additionally, the exact HTML elements contributing to each web vital score are displayed, giving you deeper insights into specific issues. Learn more.
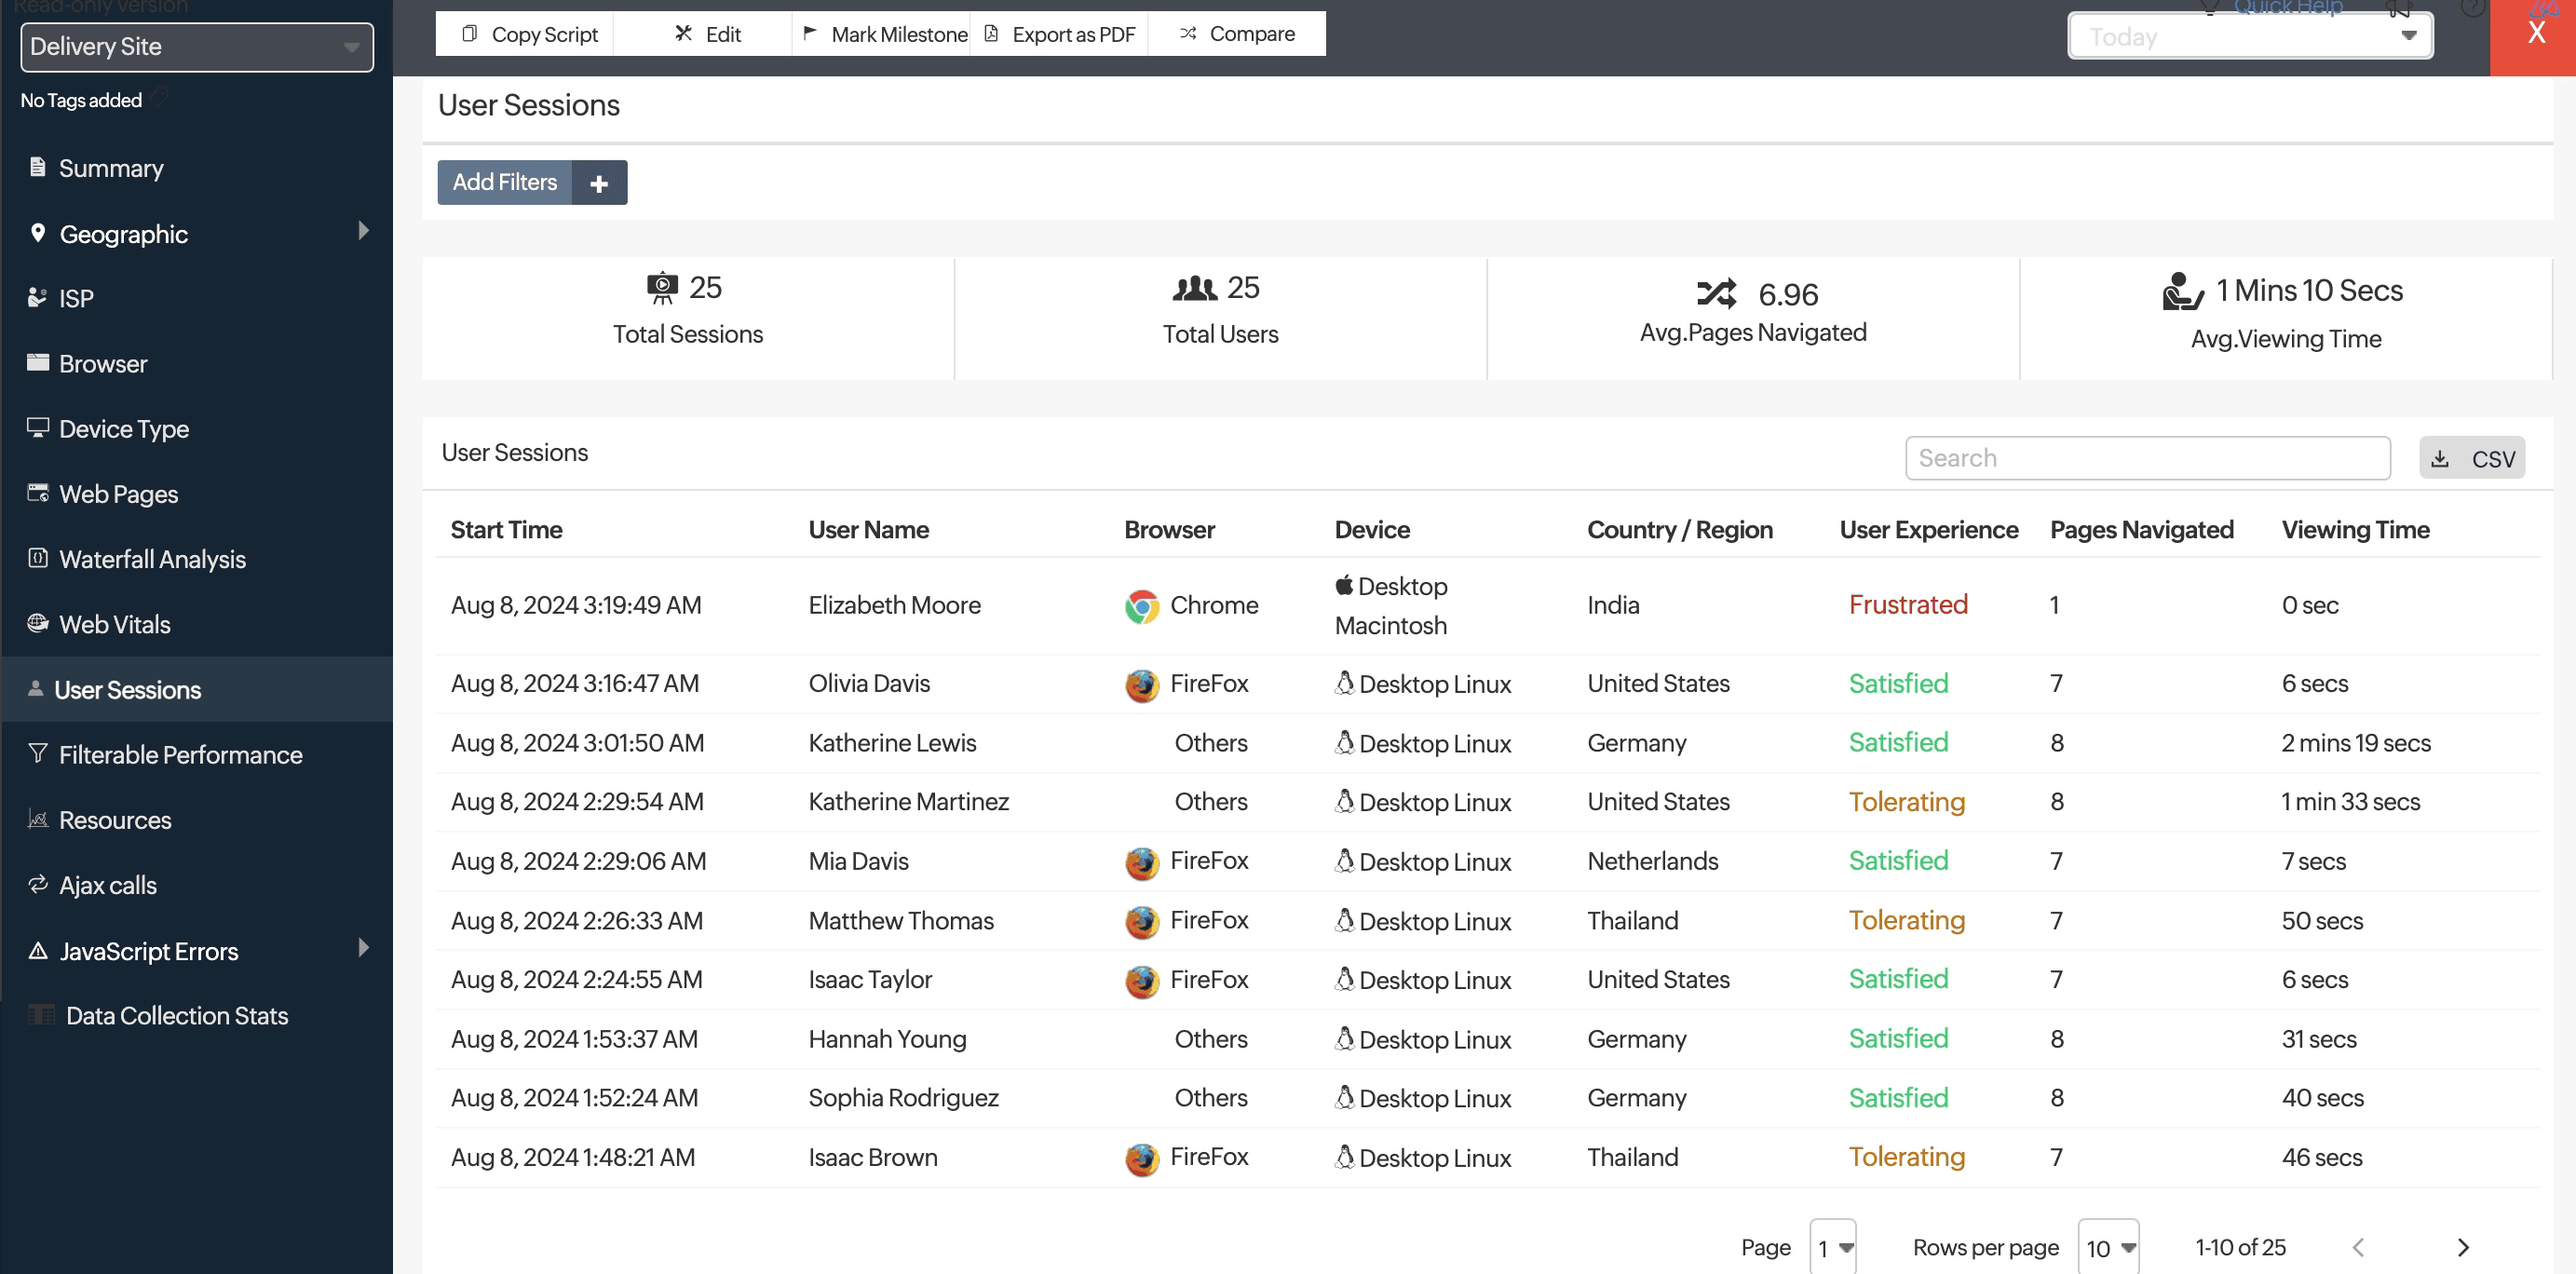
User Sessions tab
With User Sessions, you can analyze the user behavior of your website visitors. Understand how users navigate through your website and learn how much time they spend viewing each webpage and in each session. Additionally, the AJAX calls triggered by users during their sessions and any errors encountered are also captured, giving you deeper insights into the overall experience. Learn more.
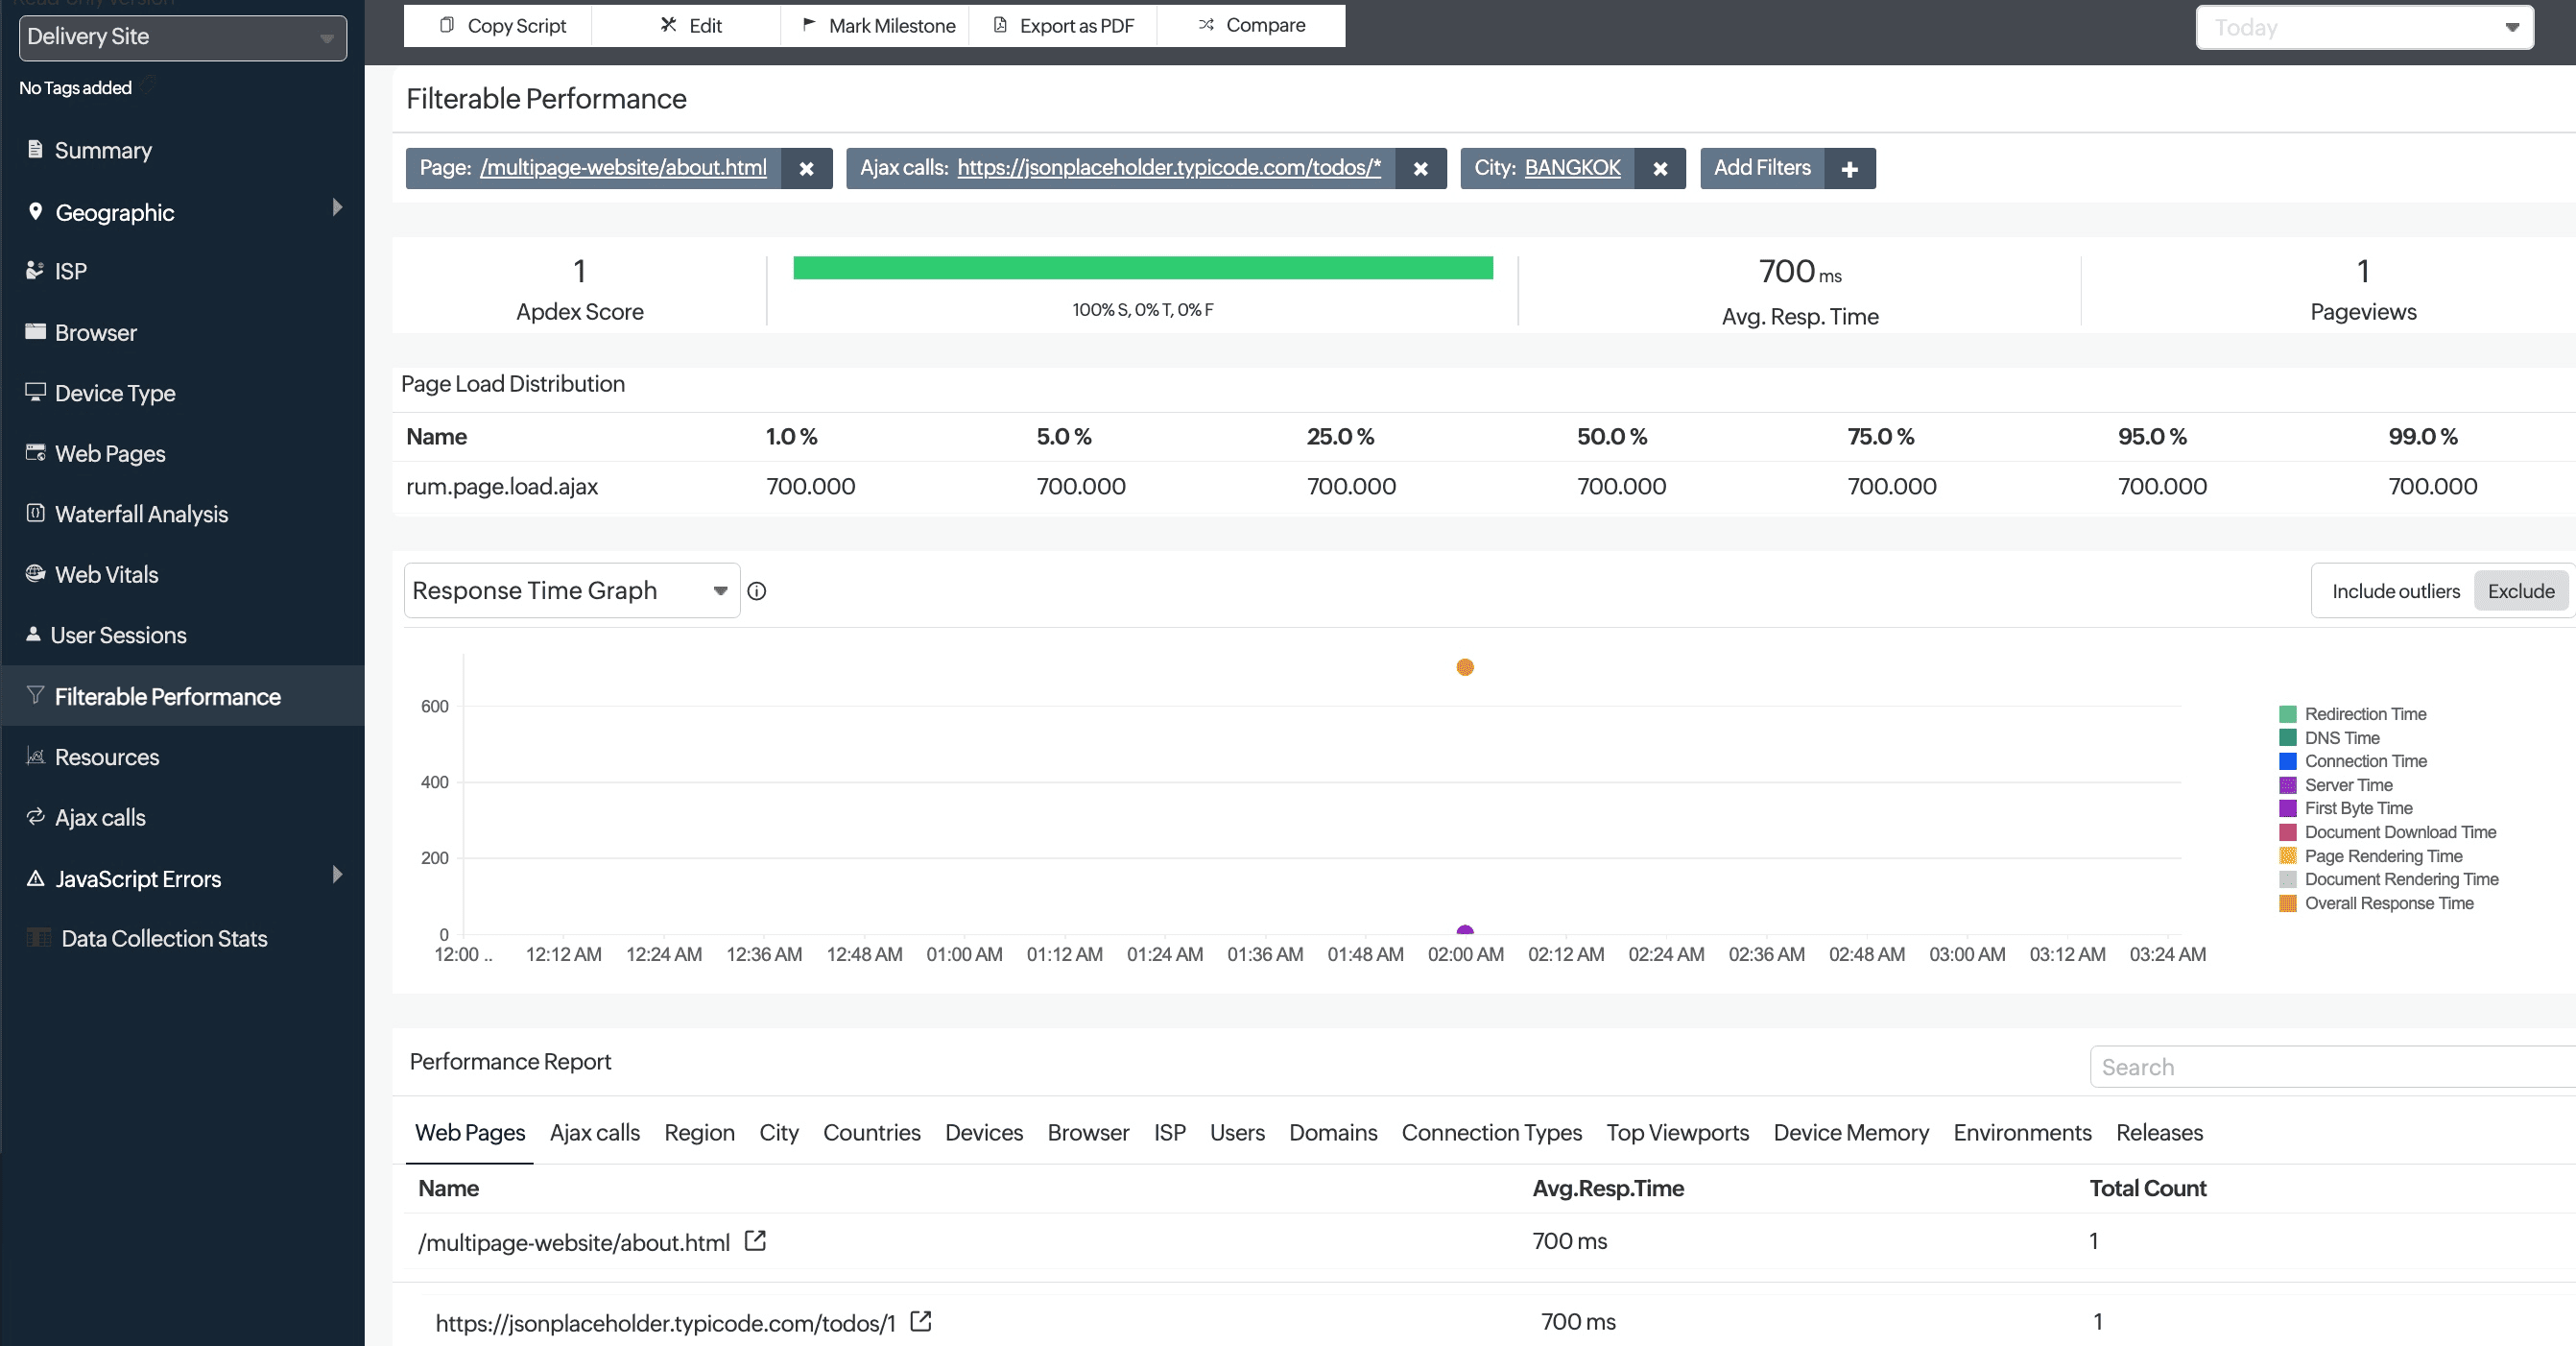
Filterable Performance tab
With Filterable Performance, you can analyze your website performance by filtering it based on various parameters, including users, devices, countries, users, domains, and ISPs. This helps you identify granular details that impact your website's performance and the end-user's experience.Learn more.
Resources tab
A webpage is made up of various resources, including images, CSS, XML, and HTTP requests. When a page loads, its load time is invariably influenced by the time it takes for its respective resources to load, too. By analyzing the response time of a page's resources, you can optimize your webpage performance to provide a better end-user experience.
How it works:
The impact of the response time of resources as well as the overall response time of your application is shown as a comparison graph. This helps you determine how your application response time is affected by resource load time.
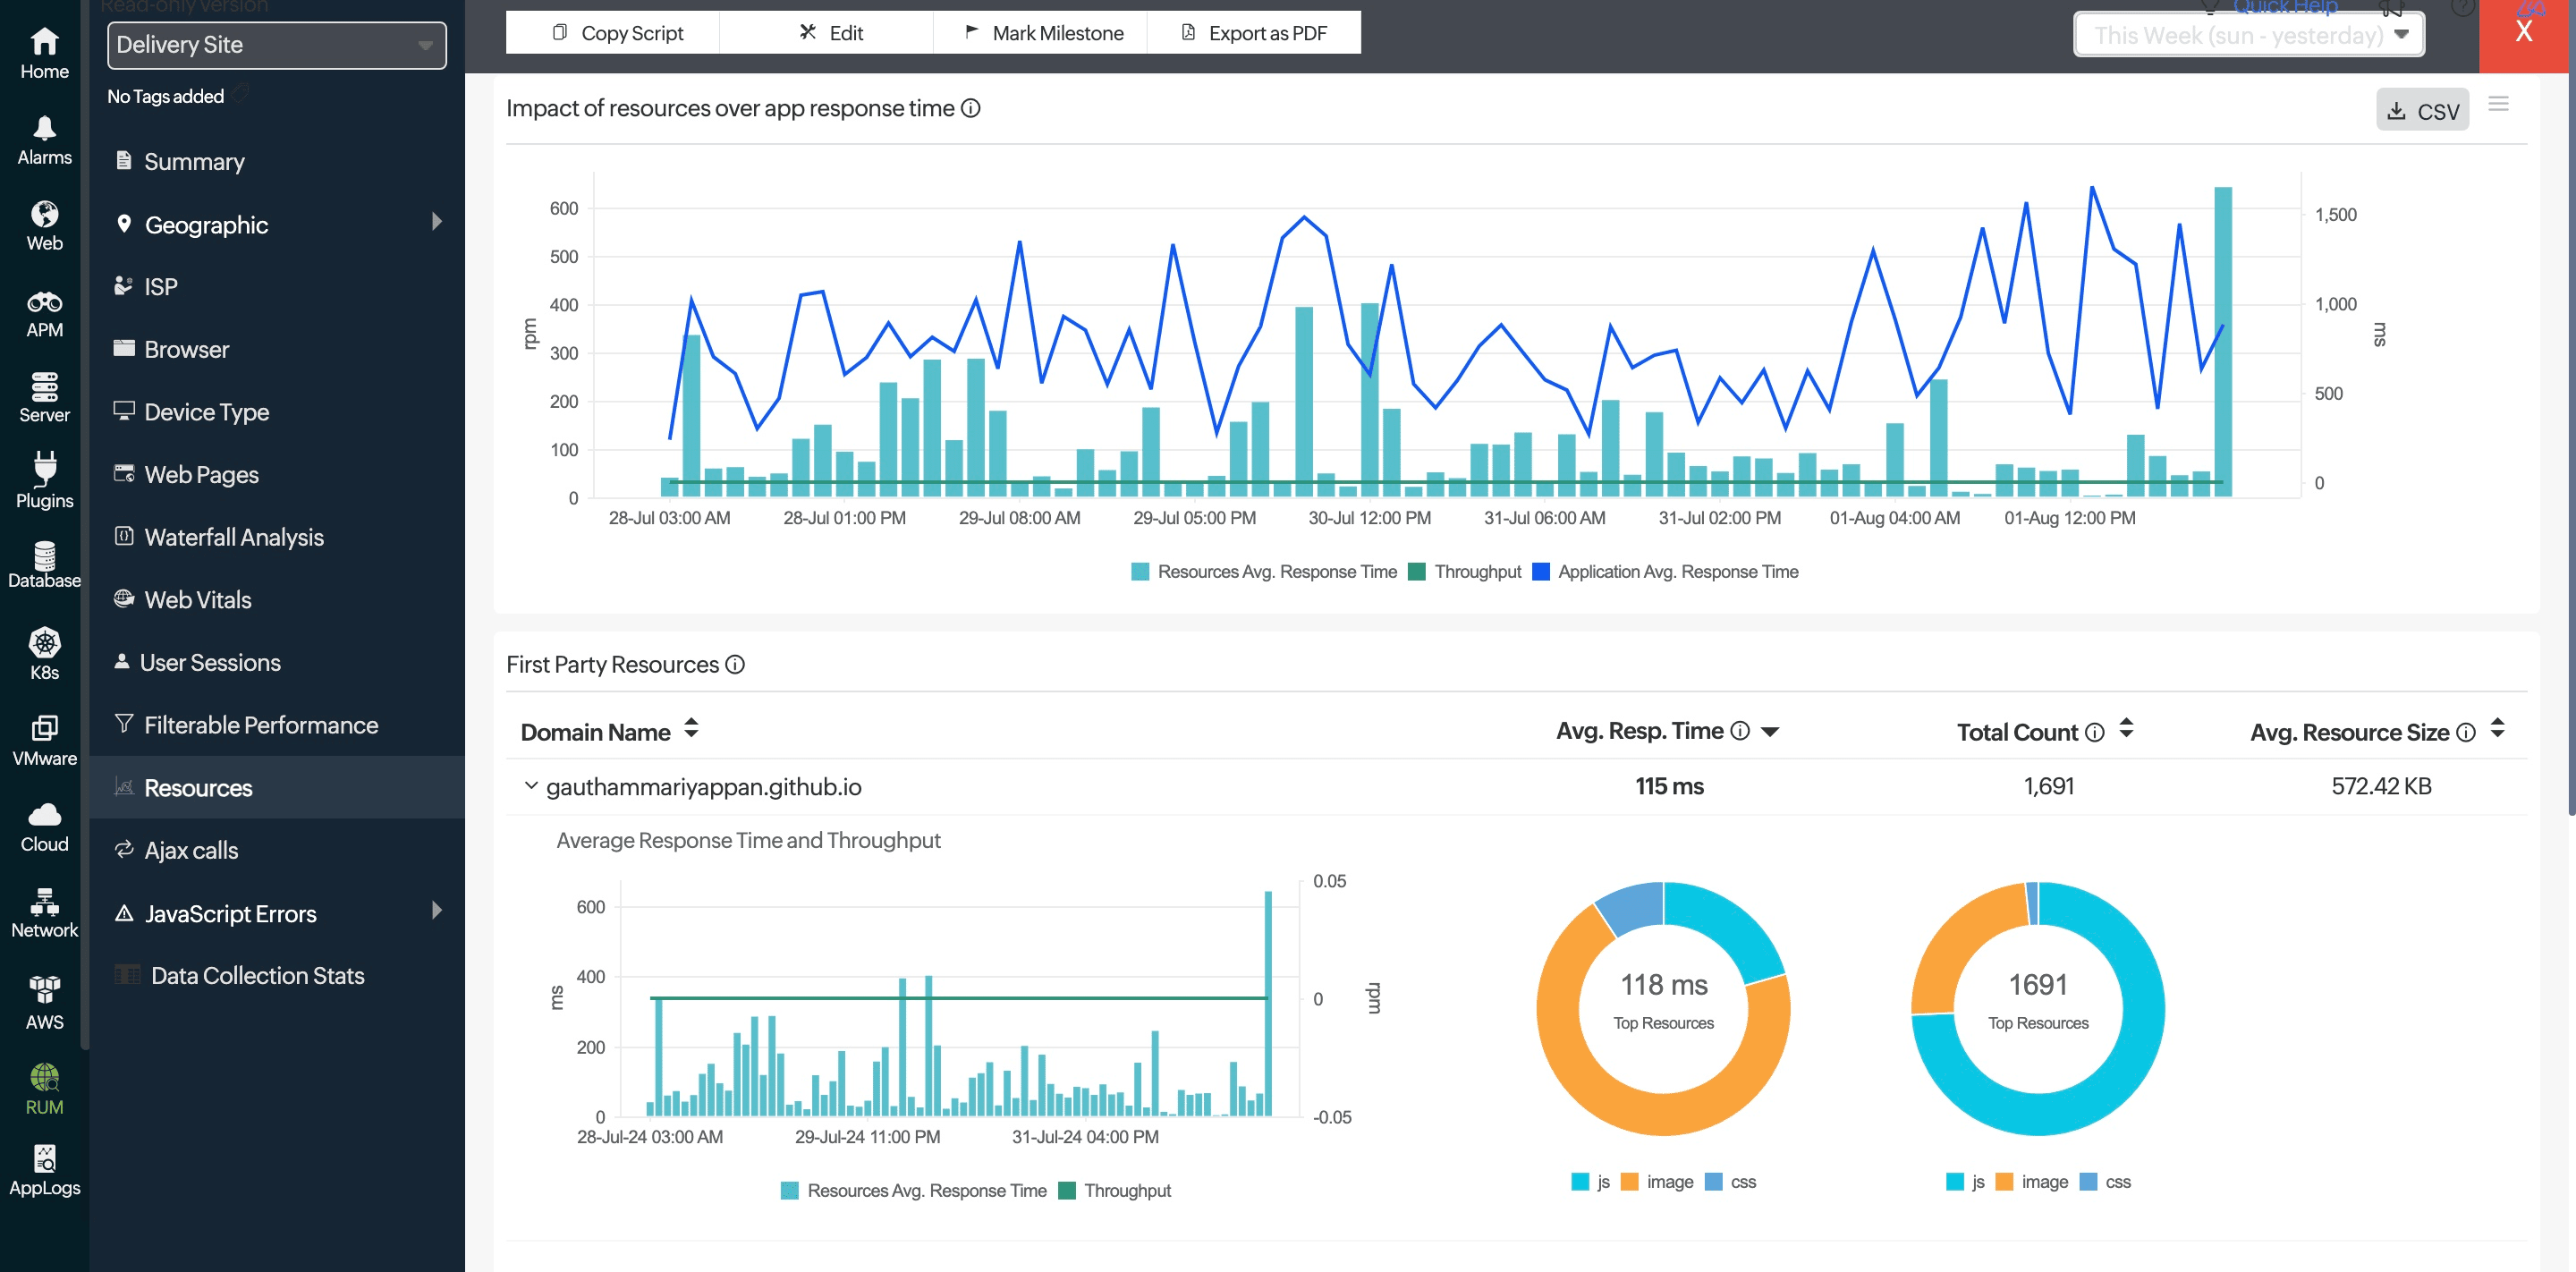
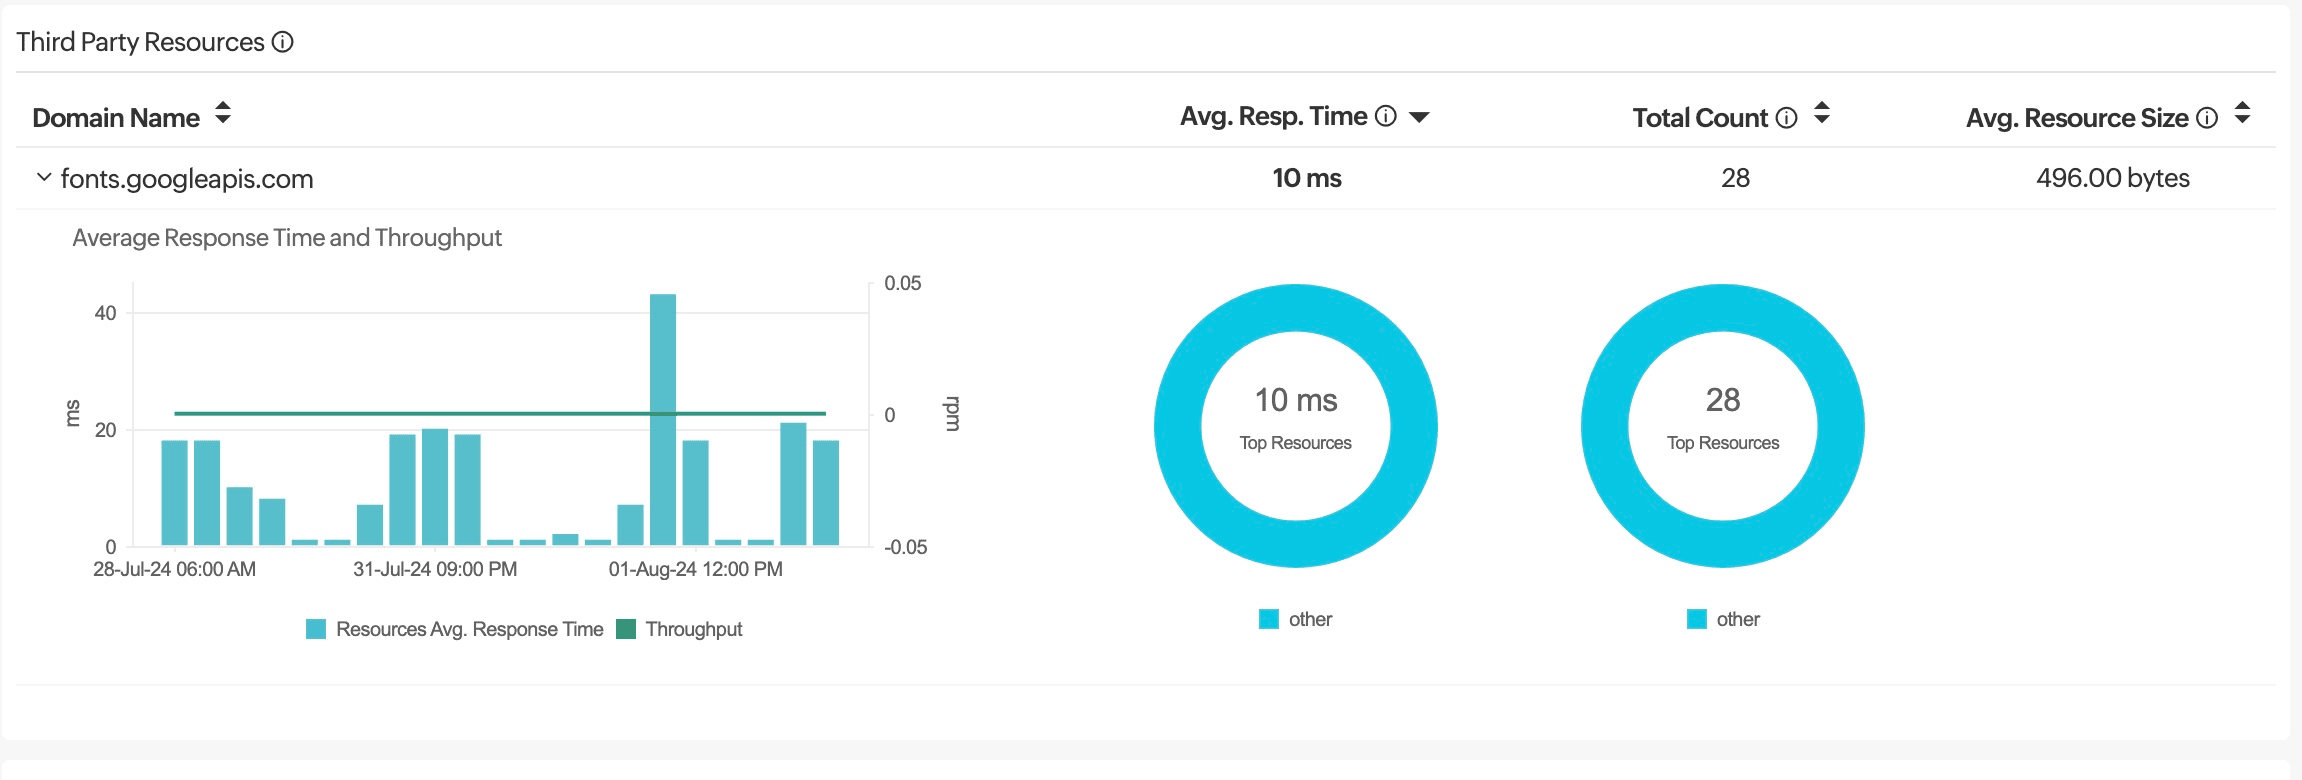
Classification of resources:
Resources are classified into first-party, third-party, and CDN resources based on the domains they're loaded from. For all these categories, you can see the average response time, throughput, and total count of resources by location. The average size of the fetched resources is also captured. Size of cross-origin resources are not captured unless they Access-Control-Allow-Origin in their headers.
These metrics help in identifying troubled location servers or the ISP in which they're hosted.
First-party resources: Resources that are loaded from the parent domain.
Third-party resources: Resources that are loaded from any external domain other than the parent domain.
CDN resources: Resources that are loaded from an external CDN network.
These details are gathered only from supported browsers.
AJAX Calls tab
AJAX calls are captured for both traditional and single-page applications. Response time, throughput, status, and count are captured for individual AJAX calls. Average resource size of individual calls is also captured. The size includes the response header fields and response payload body. Resource size of cross origin AJAX calls are not captured unless they have Access-Control-Allow-Origin in their response headers.
Cross-domain AJAX calls will be captured if Track Cross Domain AJAX Calls is enabled.
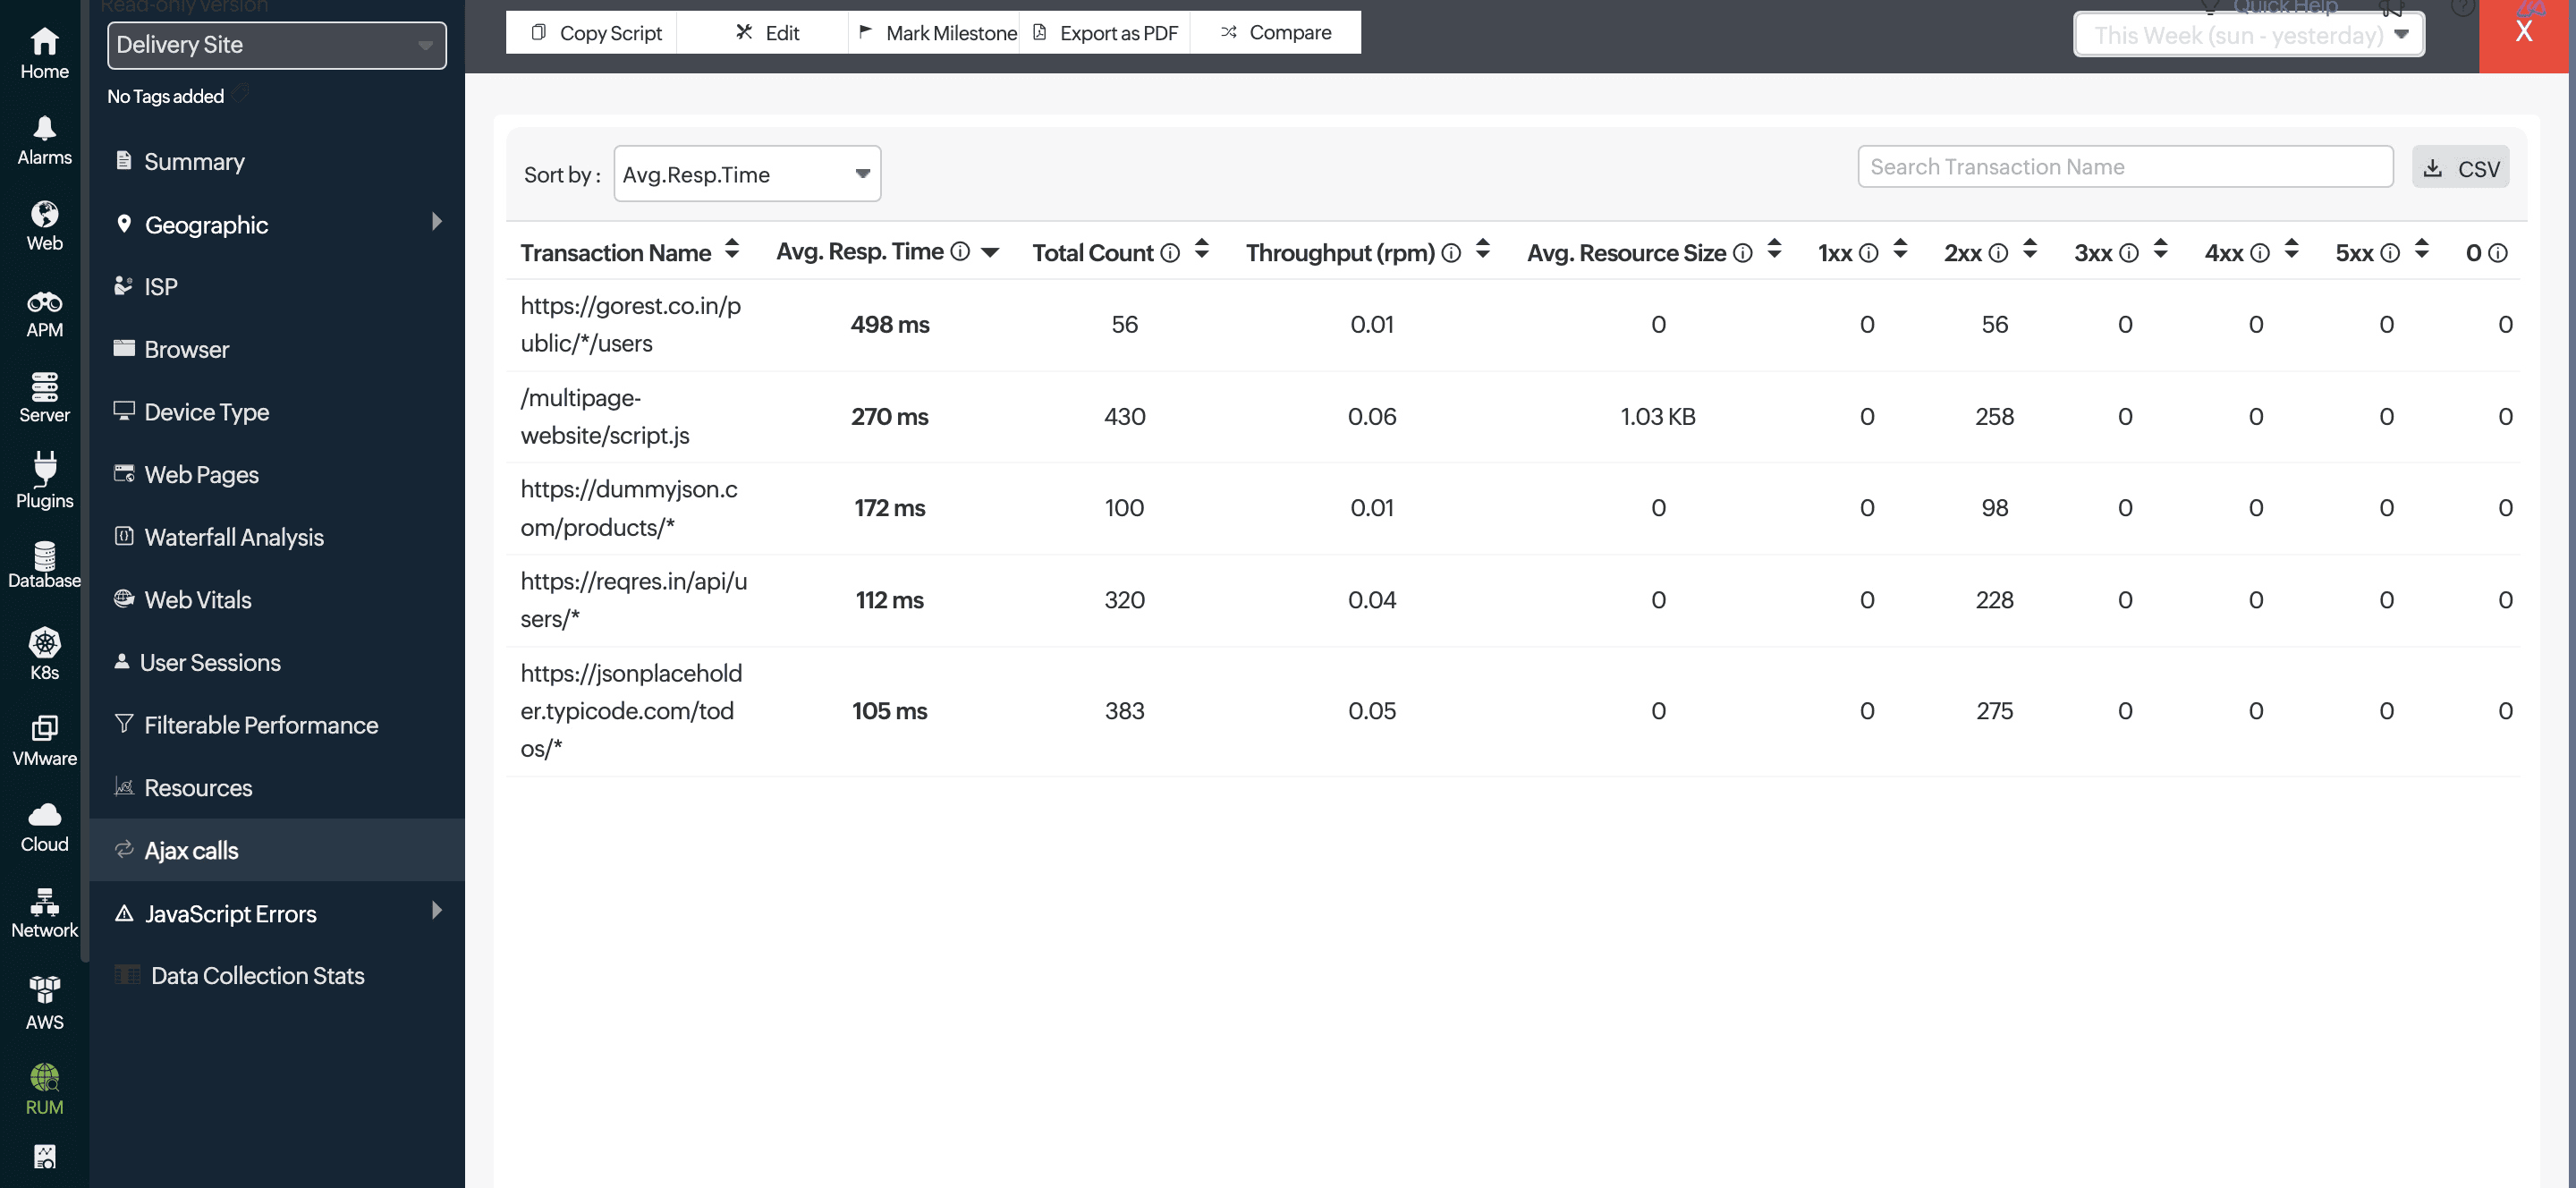
By default, AJAX calls are captured for SPA applications. You can edit your RUM configuration to capture AJAX calls for traditional applications. Refer here to do so.
JavaScript Errors tab
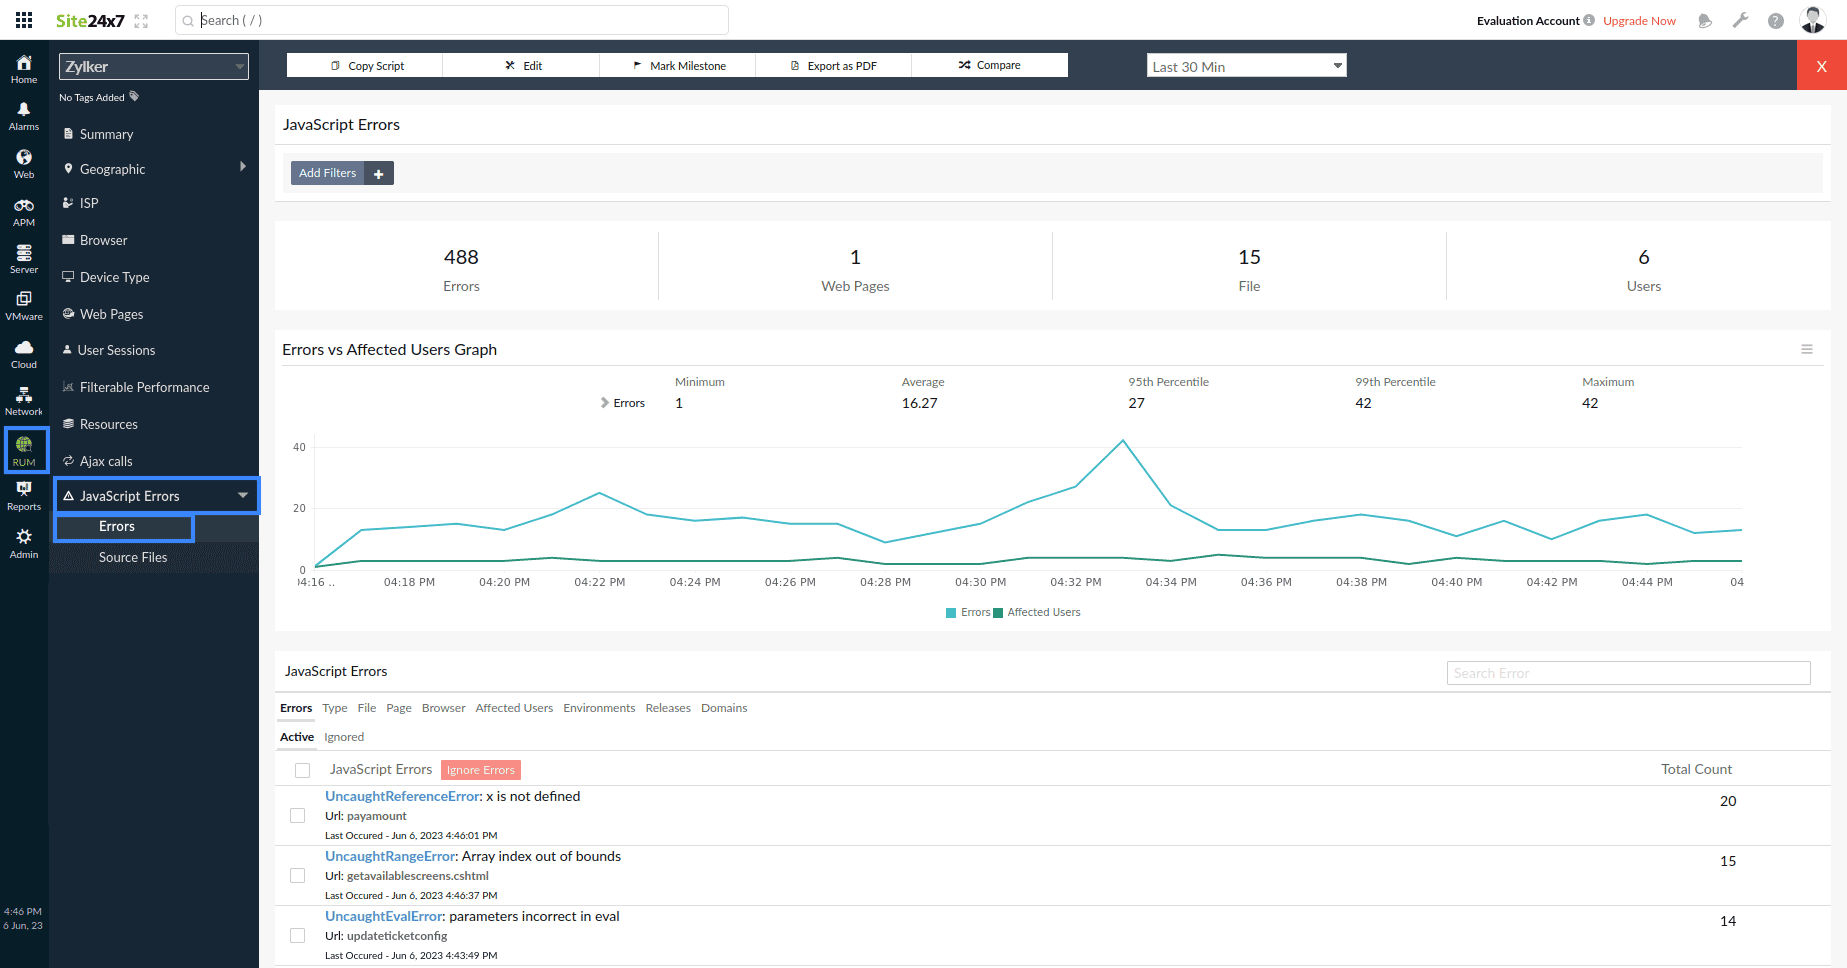
This tab allows you to monitor and debug JavaScript errors across your web applications. It enables you to view error details, analyze stack traces, and utilize source maps to deobfuscate JavaScript code, pinpointing the exact line of faulty code. This tab also provides filtering options and file upload capabilities for a more precise error diagnosis. Learn more.
Data Collection Stats tab
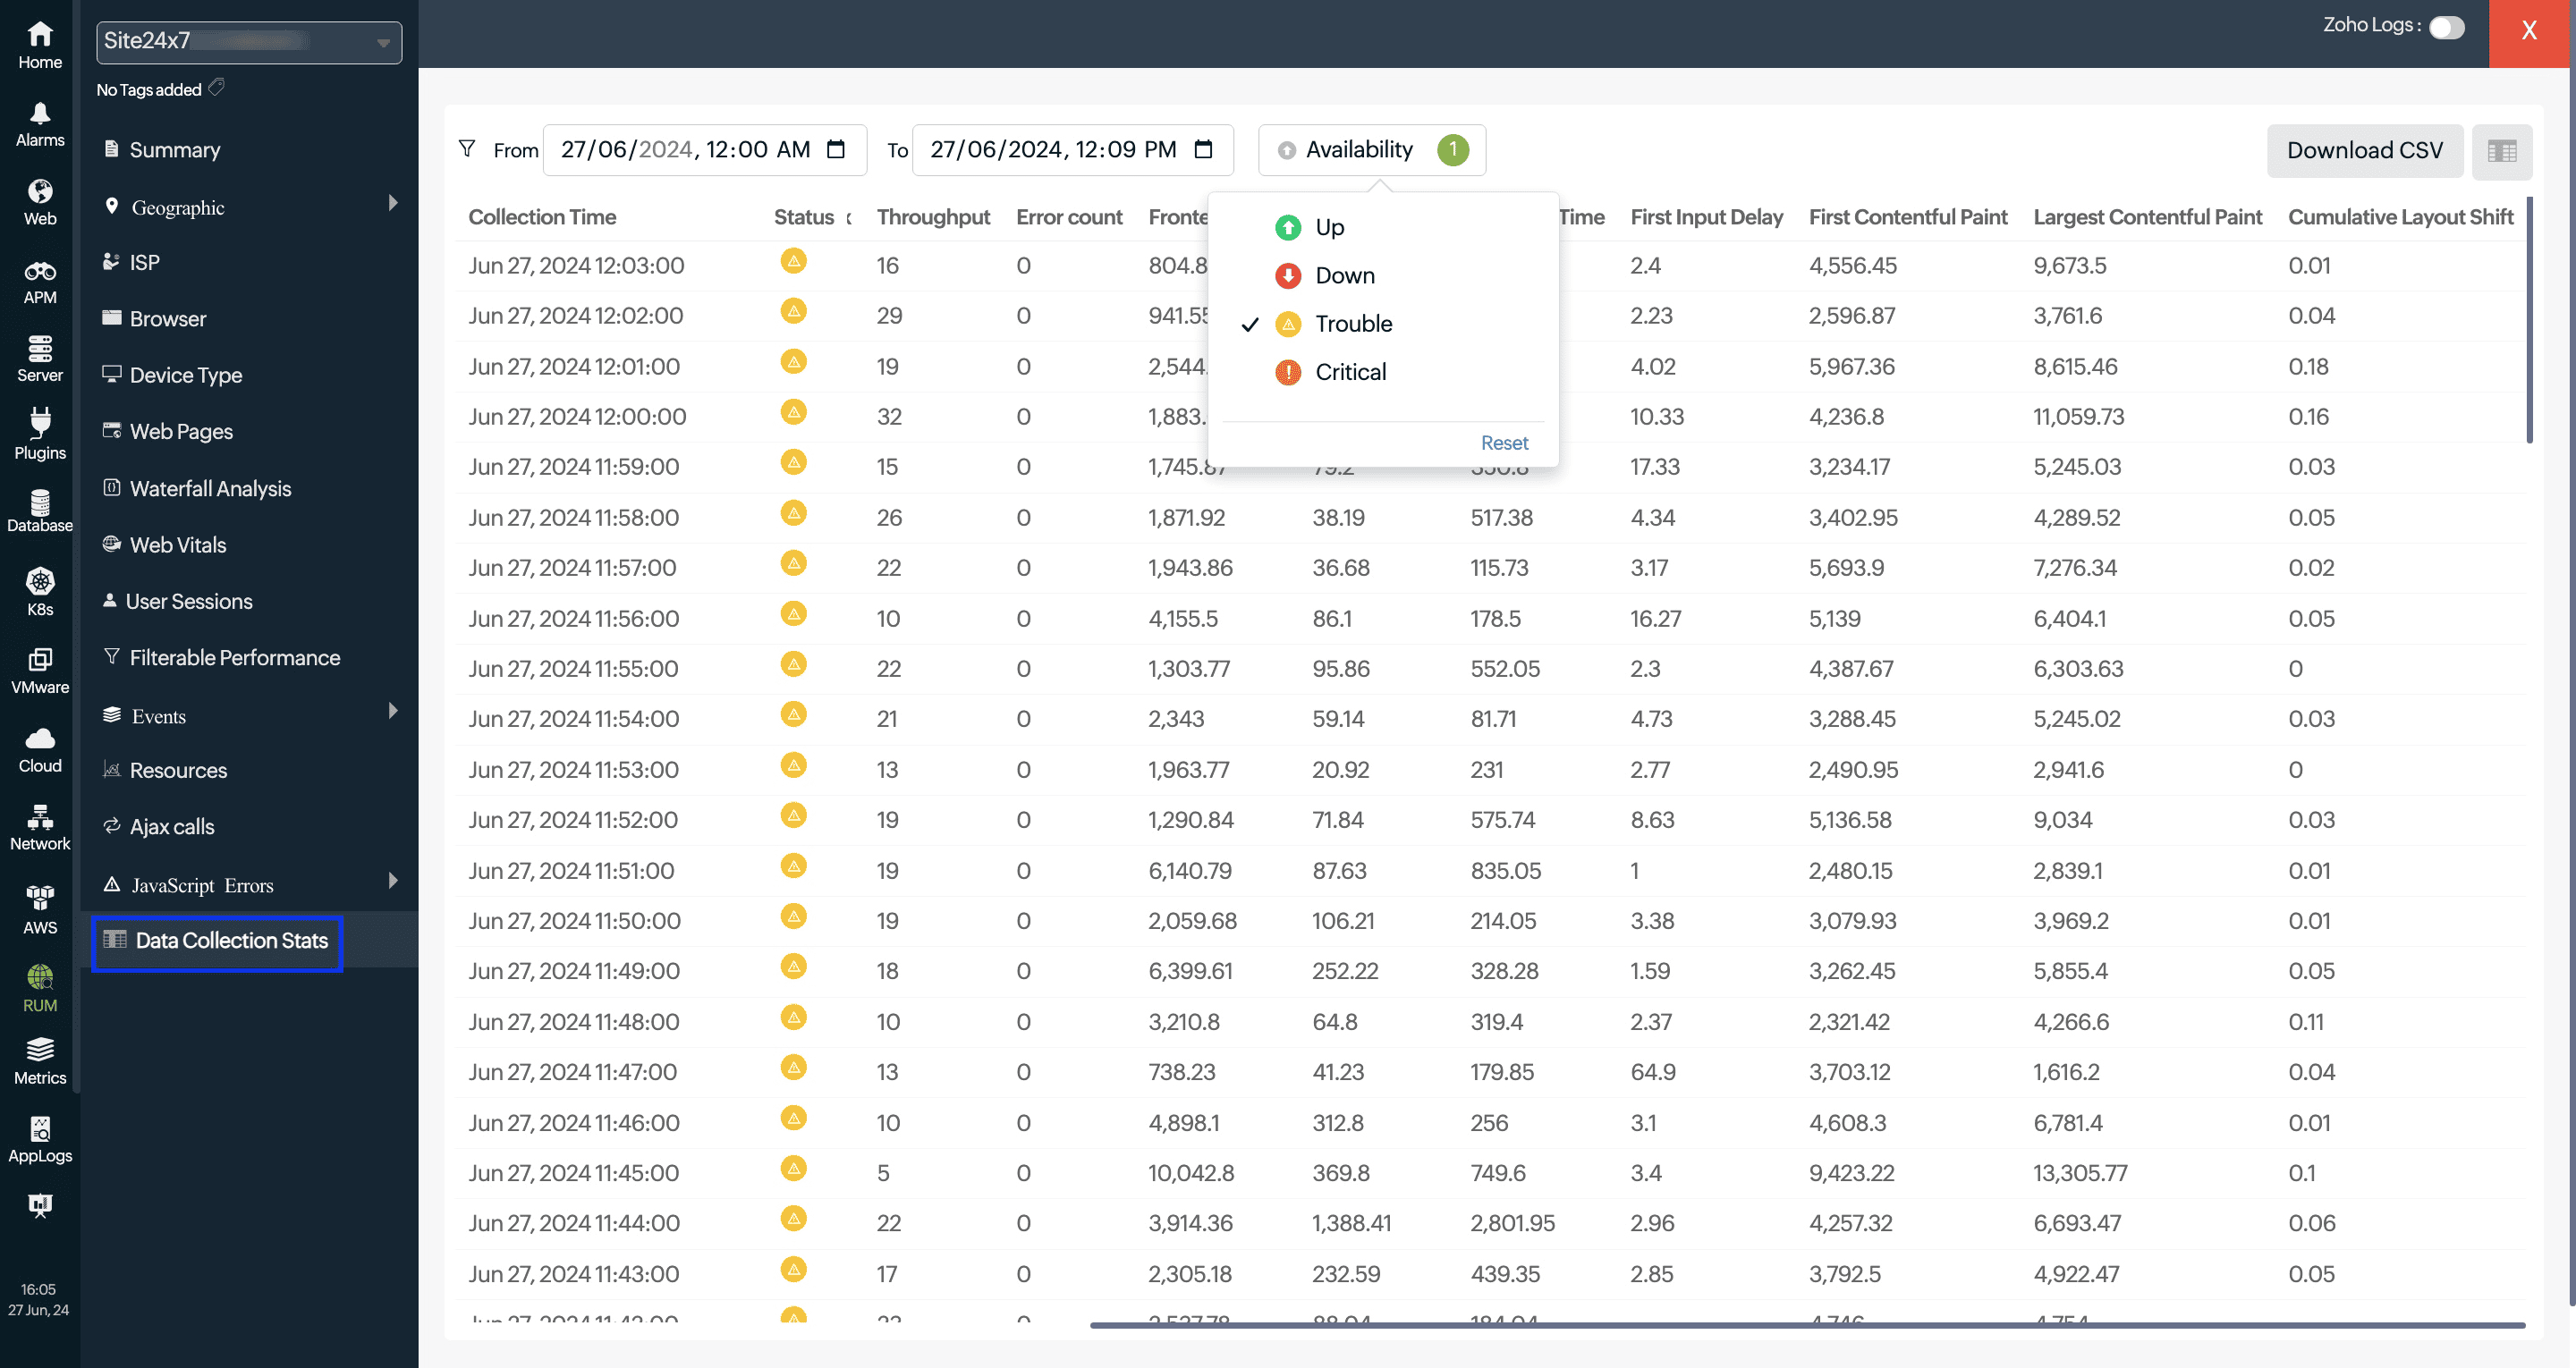
The Data Collection Stats tab in provides a comprehensive report on the performance and user experience metrics of a selected RUM application over a chosen time period. It includes key metrics such as response times, user satisfaction levels, and Web Vitals, allowing for detailed analysis and export reports. Learn more.