
CloudWatch Agent Integration with Amazon EC2 Servers
The Site24x7 CloudWatch agent can fetch detailed metrics from Amazon Elastic Compute Cloud (EC2) instances.
Prerequisites for monitoring using the CloudWatch agent
CloudWatch agent namespace
Site24x7 follows the default namespace CWAgent to collect metrics from Amazon CloudWatch. If you have a custom namespace, you must modify it to the default standards so Site24x7 can fetch data.
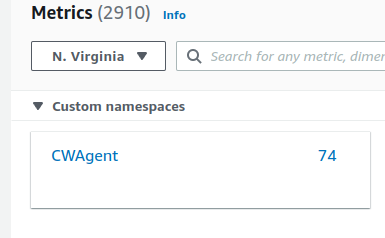
Adding dimensions to the CloudWatch agent configuration wizard
Site24x7 captures metrics using the following dimensions:
- ImageId
- InstanceId
- InstanceType

Enable these dimensions in order for Site24x7 to collect metrics from CloudWatch.
Policies and permissions
Site24x7 requires you to enable ReadOnly permissions for the following so the CloudWatch agent works seamlessly in your AWS environment:
CloudWatch agent policies
- CloudWatchAgentAdminPolicy
- CloudWatchAgentServerPolicy
EC2 permissions
- "ec2:DescribeInstances"
- "ec2:DescribeImages"
CloudWatch permissions
- "cloudwatch:GetMetricData"
- "cloudwatch:GetMetricStatistics"
- "cloudwatch:ListMetrics"
Enabling the CloudWatch agent in Site24x7
- From the Site24x7 web client, go to Cloud > AWS > your AWS Account > Advanced Configurations.
- Enable EC2 CloudWatch Agent into EC2: Toggle to Yes.
NoteBy default, this option will be set to No for existing Site24x7 users and to Yes for new users.
Criteria
- If you already integrated the Site24x7 Server Monitoring agent with your EC2 server, you cannot integrate a CloudWatch agent with that EC2 monitor.
- If a CloudWatch agent is integrated with your EC2 server, you cannot integrate a Site24x7 Server Monitoring agent with that EC2 monitor.
Supported metrics
CloudWatch agent for Windows
| Metric | Description | Unit |
| Memory % Committed Bytes In Use | The percent of memory currently committed and in use. | Percentage |
| Logical Disk % Free Space | The percent of free memory remaining on the logical disk. | Percentage |
| Paging File % Usage | The percent of free memory remaining on the paging file. | Percentage |
| Processor % Idle Time | The unused free processor or CPU capacity. | Percentage |
| Processor % Interrupt Time | The time the processor spent receiving and servicing hardware interrupts during sample intervals. | Percentage |
| Processor % User Time | The percent of time the processor spent executing in user mode. | Percentage |
| Physical Disk % Disk Time | The percent of time the selected disk drive was busy servicing read or write requests. | Percentage |
| Physical Disk Write | Disk write throughput per second. | Bytes/sec |
| Physical Disk Read | Disk read throughput per second. | Bytes/sec |
| Physical Disk Writes/sec | Disk write operations per second (IOPS that are write operations). | Writes/sec |
| Physical Disk Reads/sec | Disk read operations per second (IOPS that are read operations). | Reads/sec |
| TCPv4 Connections Established | The total number of TCP v4 connections established. | Count |
| TCPv6 Connections Established | The total number of TCP v6 connections established. | Count |
| Number of processes in Available status | The number of processes in Available status. | Count |
| Number of processes in Down status | The number of processes in Down status. | Count |
| Number of processes in Trouble status | The number of processes in Trouble status. | Count |
| Number of processes in Critical status | The number of processes in Critical status. | Count |
| Number of processes in Suspended status | The number of processes in Suspended status. | Count |
| Number of processes in Maintenance | The number of processes in Maintenance status. | Count |
| LogicalDisk Free Megabytes | Free disk space, in megabytes. | Average |
| Processor % Processor Time | The percentage of time a processor core spends executing an active, non-idle thread. | Average |
CloudWatch agent for Linux or Unix
| Metric | Description | Unit |
| Memory Used | The percent of memory currently in use. | Percentage |
| Swap Space Used | The percent of swap space currently in use. | Percentage |
| Free Disk Inodes | The number of available index nodes on the disk. | Count |
| Used Disk | The percent of total disk space in use. | Percentage |
| Disk I/O Time | The amount of time the disk has had I/O requests queued. | Milliseconds |
| Disk I/O Write in Bytes | The number of bytes written to the disk. | Bytes |
| Disk I/O Read in Bytes | The number of bytes read from the disk. | Bytes |
| Disk I/O Write Count | The number of disk write operations. | Count |
| Disk I/O Read Count | The number of disk read operations. | Count |
| CPU Usage Idle | The percent of time the CPU is idle. | Percentage |
| CPU Usage I/O Wait | The percent of time the CPU is waiting for I/O operations to complete. | Percentage |
| CPU Usage User | The percent of time the CPU is in user mode. | Percentage |
| CPU Usage System | The percent of time the CPU is in system mode. | Percentage |
| Netstat TCP Established | The number of TCP connections established. | Count |
| Netstat TCP Time Wait | The number of TCP connections currently waiting to ensure that the client received the acknowledgement of its connection termination request. | Count |
| Number of processes in Available status | The number of processes in Available status. | Count |
| Number of processes in Down status | The number of processes in Down status. | Count |
| Number of processes in Trouble status | The number of processes in Trouble status. | Count |
| Number of processes in Critical status | The number of processes in Critical status. | Count |
| Number of processes in Suspended status | The number of processes in Suspended status. | Count |
| Number of processes in Maintenance | The number of processes in Maintenance status. | Count |
| Memory Active | Memory recently used and not usually reclaimed unless the system runs low. | Average |
| Memory Available | Estimated memory available to start new applications without swapping. | Average |
| Memory Available Percent | Available memory as a percentage of total memory. | Average |
| Memory Buffered | Memory used by kernel buffers for raw disk block I/O. | Average |
| Memory Cached | Memory used by the page cache (cached file/disk data). | Average |
| Memory Inactive | Memory not recently used that can be reclaimed when needed. | Average |
| Memory Shared | Memory shared between multiple processes. | Average |
NVIDIA GPU metrics
These metrics are supported for the CloudWatch agent on Linux instances with NVIDIA GPUs.
| Metrics name | Description | Statistic | Unit |
| Nvidia GPU Utilization | Percentage of time the GPU was busy executing kernels (compute utilization). | Average | Percent |
| Nvidia GPU Temperature | GPU core temperature (°C). | Average | Celsius |
| Nvidia GPU Power Draw | Power currently drawn by the GPU (watts). | Average | Watts |
| Nvidia GPU Memory Utilization | Percentage of time the GPU memory controller was reading/writing (memory bandwidth utilization). | Average | Percent |
| Nvidia GPU Fan Speed | GPU fan speed as a percentage of maximum. | Average | Percent |
| Nvidia GPU Total Memory | Total GPU frame buffer memory. | Average | Bytes |
| Nvidia GPU Memory Used | GPU frame buffer memory currently in use. | Average | Bytes |
| Nvidia GPU Memory Free | GPU frame buffer memory available. | Average | Bytes |
| Nvidia GPU PCIe Link Generation Current | Current PCIe link generation in use by the GPU. | Sum | Count |
| Nvidia GPU PCIe Link Width Current | Current PCIe link width (number of lanes) in use. | Sum | Count |
| Nvidia GPU Encoder Session Count | Number of active hardware video encoder sessions. | Sum | Count |
| Nvidia GPU Encoder Average FPS | Average frames per second across encoder sessions. | Average | Frames per second |
| Nvidia GPU Encoder Average Latency | Average latency of the hardware video encoder. | Average | microseconds |
| Nvidia GPU Clocks Current Graphics | Current graphics (core) clock frequency. | Average | MHz |
| Nvidia GPU Clocks Current SM | Current streaming multiprocessor (SM) clock frequency. | Average | MHz |
| Nvidia GPU Clocks Current Memory | Current memory clock frequency. | Average | MHz |
| Nvidia GPU Clocks Current Video | Current video encoder/decoder clock frequency. | Average | MHz |
Threshold configuration
To configure thresholds for your integrated monitor:
- Navigate to Admin > Configuration Profiles > Threshold and Availability.
- Click Add Threshold Profile.
- Select CloudWatch Agent from the Monitor Type drop-down menu.
- Provide an appropriate name in the Display Name field. The supported metrics are displayed in the Threshold Configuration section. You can set threshold values for all the metrics listed above.
- After you set the threshold values for the applicable metrics, click Save.
You can manage all the alerts to ensure that the notifications are sent through the parent monitor with the status propagation feature.
Notify for Procstat status changes
The Notify for Procstat Changes option is set to No by default. Toggle this option to Yes, to get notified when the Procstat monitor is in Available, Down, Trouble, Critical, Suspended, or Maintenance status.
Licensing
The CloudWatch agent integration with EC2 servers can be used for free in Site24x7.