RabbitMQ monitoring for AWS
Amazon MQ is a managed message broker service that makes it easy to migrate to a message broker in the cloud. It supports Apache ActiveMQ Classic and RabbitMQ engine types.
Overview
Site24x7's AWS monitoring supports Amazon MQ for ActiveMQ and Amazon MQ for RabbitMQ. This document provides a detailed overview of the Site24x7 - RabbitMQ integration, metrics monitored, and the monitor data.
RabbitMQ is an open-source message broker that supports multiple protocols. Site24x7's integration with RabbitMQ enables smooth operation of your message broker and helps avoid issues that could impact your applications.
The integration provides you with the following two child monitors in addition to the RabbitMQ Broker monitor:
- RabbitMQ Node: Monitors node status and connectivity to ensure that the cluster is operating as expected and that nodes are communicating effectively.
- RabbitMQ Queue: Provides valuable insights into the overall efficiency and monitors the performance of your message queues.
Disable RabbitMQ Queue auto-discovery
In the Edit Monitor Details page of your RabbitMQ monitor, set the Disable RabbitMQ Queue Auto-discovery option to Yes to suspend all RabbitMQ Queue monitors. By default, this option is set to No.
Use case
Integrating your RabbitMQ with Site24x7 provides real-time insights into your RabbitMQ environment and helps to identify performance bottlenecks for maintaining the reliability, performance, and security of your messaging infrastructure.
Consider a scenario where a customer completes a financial transaction with Zylker bank. Let's assume that the transaction messages are sent, but remains uncleared from the message queue due to some application issues. This could lead to substantial financial and reputational damages for Zylker bank. However, if the bank's RabbitMQ environment is integrated with Site24x7, it can proactively manage the transactions and configure threshold alerts based on message count or consumer count in the queue. Thus, when a breach occurs, it will be promptly notified and Zylker bank can take appropriate actions to rectify the issue.
Benefits of the Site24x7 - RabbitMQ integration
Integrate your RabbitMQ with Site24x7 to:
- Obtain comprehensive monitoring of your RabbitMQ environments and optimize your infrastructure performance and reliability.
- Gain insights about your monitor brokers, nodes, and queues.
- Achieve critical visibility into the data flow of all your queues and identify performance trends.
- Monitor every queue in your broker individually, and proactively get notified in case of abnormal behavior.
Setup and configuration
- Log in to your Site24x7 account and create Site24x7 as an IAM user, or create a cross-account IAM role to enable access to your AWS resources for Site24x7.
- On the Integrate AWS Account page, select RabbitMQ from the Services to be discovered list.
Permissions
Ensure that Site24x7 receives the following permissions to monitor RabbitMQ:
- "mq:DescribeBroker"
- "mq:DescribeConfiguration"
- "mq:DescribeConfigurationRevision"
- "mq:DescribeUser"
- "mq:ListTags"
- "mq:ListBrokers"
- "mq:DescribeBrokerEngineTypes"
- "cloudwatch:ListMetrics"
- "logs:DescribeLogStreams"
- "logs:GetLogEvents"
Polling frequency
Site24x7 queries AWS service-level APIs per the set polling frequency (from once a minute to once a day) to collect metrics from the RabbitMQ monitor.
Supported metrics
The supported metrics for each RabbitMQ monitors are given below.
RabbitMQ Broker
The supported metrics for RabbitMQ Broker monitor are provided below:
| Metric name | Description | Statistics | Unit |
|---|---|---|---|
| System CPU Utilization | The percentage of allocated Amazon EC2 compute units that the broker currently uses. | Maximum | Percentage |
| Total Memory Usage | The percentage of memory usage calculated based on Memory Used and Memory Limit from the CloudWatch metrics. | Custom | Percentage |
| Exchange Count | The total number of exchanges configured on the broker. | Maximum | Count |
| Queue Count | The total number of queues configured on the broker. | Maximum | Count |
| Message Count | The total number of messages in the queues. Note : The number produced is the total sum of ready and unacknowledged messages on the broker. | Maximum | Count |
| Message Ready Count | The total number of ready messages in the queues. | Maximum | Count |
| Message Unacknowledged Count | The total number of unacknowledged messages in the queues. | Maximum | Count |
| Consumer Count | The total number of consumers connected to the broker. | Maximum | Count |
| Connection Count | The total number of connections established on the broker. | Maximum | Count |
| Channel Count | The total number of channels established on the broker. | Maximum | Count |
| Publish Rate | The rate at which messages are published to the broker. | Maximum | Count/sec |
| Confirm Rate | The rate at which the RabbitMQ server is confirming published messages. You can compare this metric with the Publish Rate to better understand how your broker is performing. | Maximum | Count/sec |
| Acknowledged Rate | The rate at which messages are being acknowledged by consumers. | Maximum | Count/sec |
| Memory Limit | The RAM limit for a RabbitMQ broker. For cluster deployments, this value represents the aggregate of all three RabbitMQ nodes' corresponding metric values. | Maximum | Bytes |
| Memory Used | The volume of RAM used by a RabbitMQ broker. | Maximum | Bytes |
| Disk Free Limit | The disk limit for a RabbitMQ broker. | Maximum | Bytes |
| Disk Free Space | The total volume of free disk space available in a RabbitMQ broker. | Maximum | Bytes |
| I/O Read Average Time | The average time (in milliseconds) for RabbitMQ to perform one read operation. The value is proportional to the message size. | Average | Percentage/milliseconds |
| I/O Write Average Time | The average time (in milliseconds) for RabbitMQ to perform one write operation. The value is proportional to the message size. | Average | Percentage/milliseconds |
| File Descriptors Used | Number of file descriptors used. | Maximum | Count |
RabbitMQ Node
The supported metrics for RabbitMQ Node monitor are provided below:
| Metric name | Description | Statistics | Unit |
|---|---|---|---|
| System CPU Utilization | The percentage of allocated Amazon EC2 compute units that the broker currently uses. | Maximum | Percentage |
| Total Memory Usage | The percentage of memory usage calculated based on Memory Used and Memory Limit from the CloudWatch metrics. | Custom | Percentage |
| Memory Limit | The RAM limit for a RabbitMQ node. | Maximum | Bytes |
| Memory Used | The volume of RAM used by a RabbitMQ node. | Maximum | Bytes |
| Disk Free Limit | The disk limit for a RabbitMQ node. | Maximum | Bytes |
| Disk Free Space | The total volume of free disk space available in a RabbitMQ node. | Maximum | Bytes |
| File Descriptors Used | Number of file descriptors used. | Maximum | Count |
RabbitMQ Queue
The supported metrics for RabbitMQ Queue monitor are provided below:
| Metric name | Description | Statistics | Unit |
|---|---|---|---|
| Message Count | The total number of Message Ready Count and Message Unacknowledged Count (also known as queue depth). | Maximum | Count |
| Consumer Count | The number of consumers subscribed to the queue. | Maximum | Count |
| Message Ready Count | The number of messages that are currently available to be delivered. | Maximum | Count |
| Message Unacknowledged Count | The number of messages for which the server is awaiting acknowledgement. | Maximum | Count |
Threshold configuration
To configure thresholds for a RabbitMQ monitor:
- Log in to your Site24x7 account and navigate to Admin > Configuration Profiles > Threshold and Availability.
- Click Add Threshold Profile.
- Select the applicable monitor type from the Monitor Type drop-down menu and provide an appropriate name in the Display Name field. The applicable monitor types are RabbitMQ Broker, RabbitMQ Queue, and RabbitMQ Node.
- The supported metrics are displayed in the Threshold Configuration section. You can set threshold values for all the metrics mentioned above.
- Click Save.
You can manage all the alerts to ensure that the notifications are sent through the parent monitor with the status propagation feature.
Licensing
- RabbitMQ Broker: Each RabbitMQ Broker monitor utilizes one basic monitor license.
- RabbitMQ Node: Five RabbitMQ Node monitors utilize one basic monitor license.
- RabbitMQ Queue: Each RabbitMQ Queue monitor utilizes one basic monitor license.
Viewing RabbitMQ data
To monitor your RabbitMQ, log in to your Site24x7 account and navigate to Cloud > AWS > RabbitMQ.
RabbitMQ monitor data
The monitor data for each RabbitMQ monitor is given below.
RabbitMQ Broker
You can view your RabbitMQ Broker data on the following tabs.
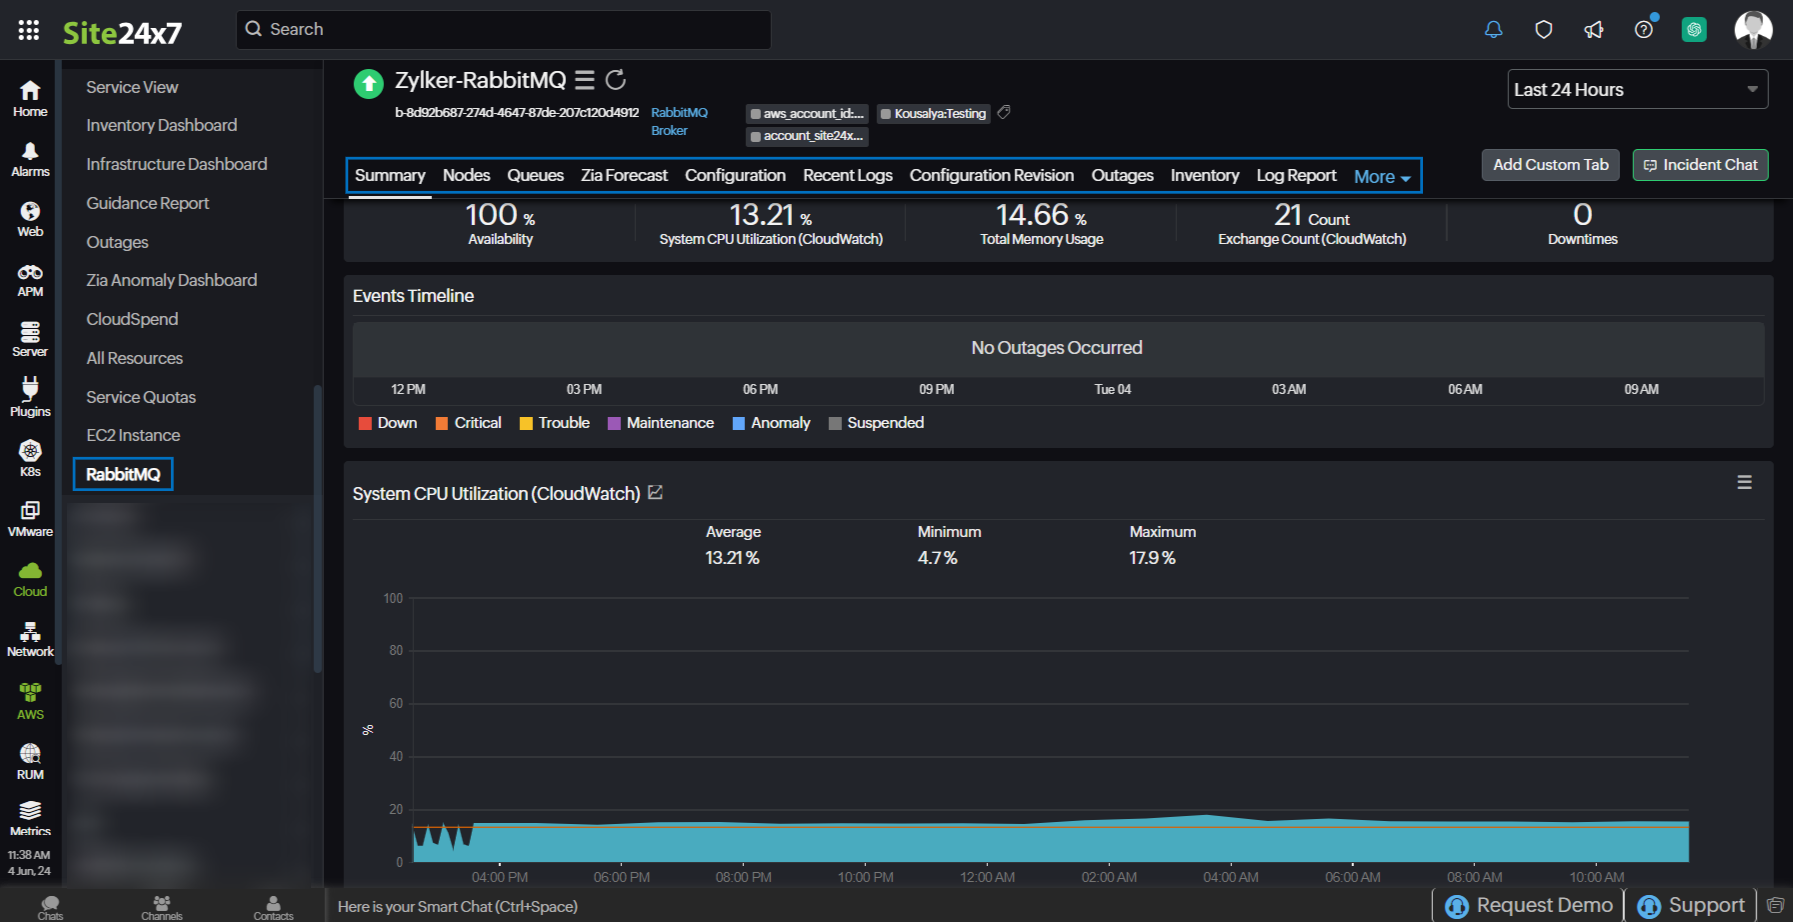
Summary
The Summary tab offers a comprehensive overview of the events timeline and metrics, presenting insightful charts that shed light on the performance and behavior of broker instances and queue within your RabbitMQ environment.
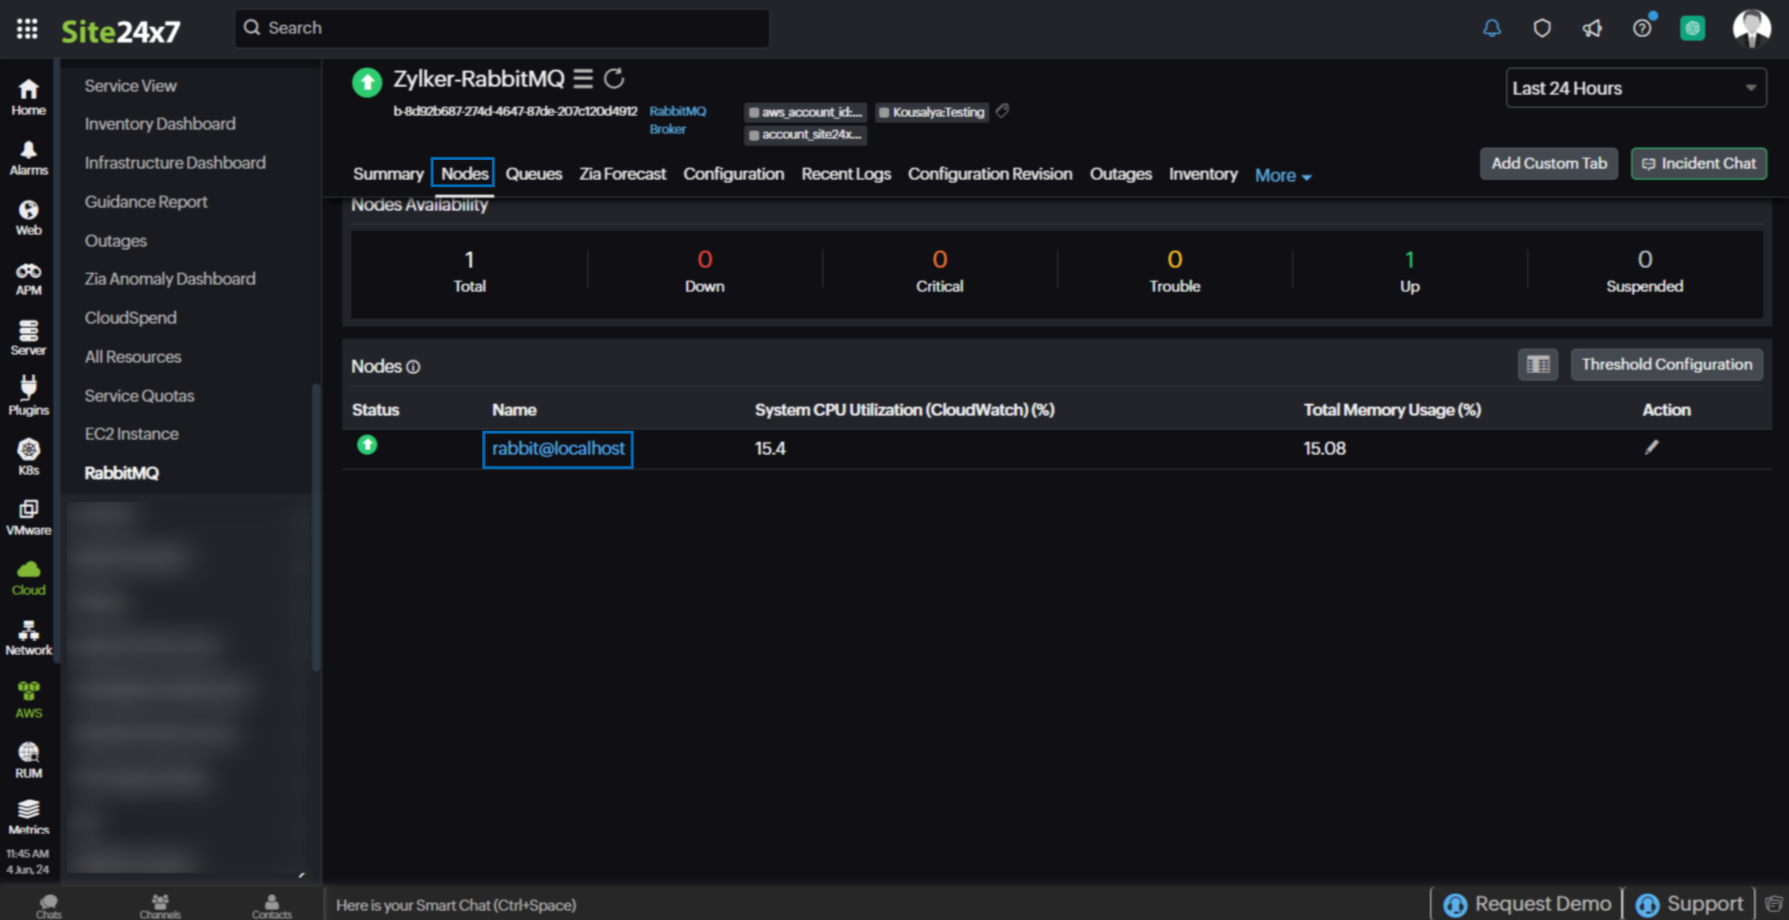
Nodes
In RabbitMQ, a node refers to an instance of the RabbitMQ message broker running on a server or a computing device. The Nodes tab provides the list of RabbitMQ Node monitors, their availability, and status. Click the monitor name hyperlink to view the RabbitMQ Node monitor data.
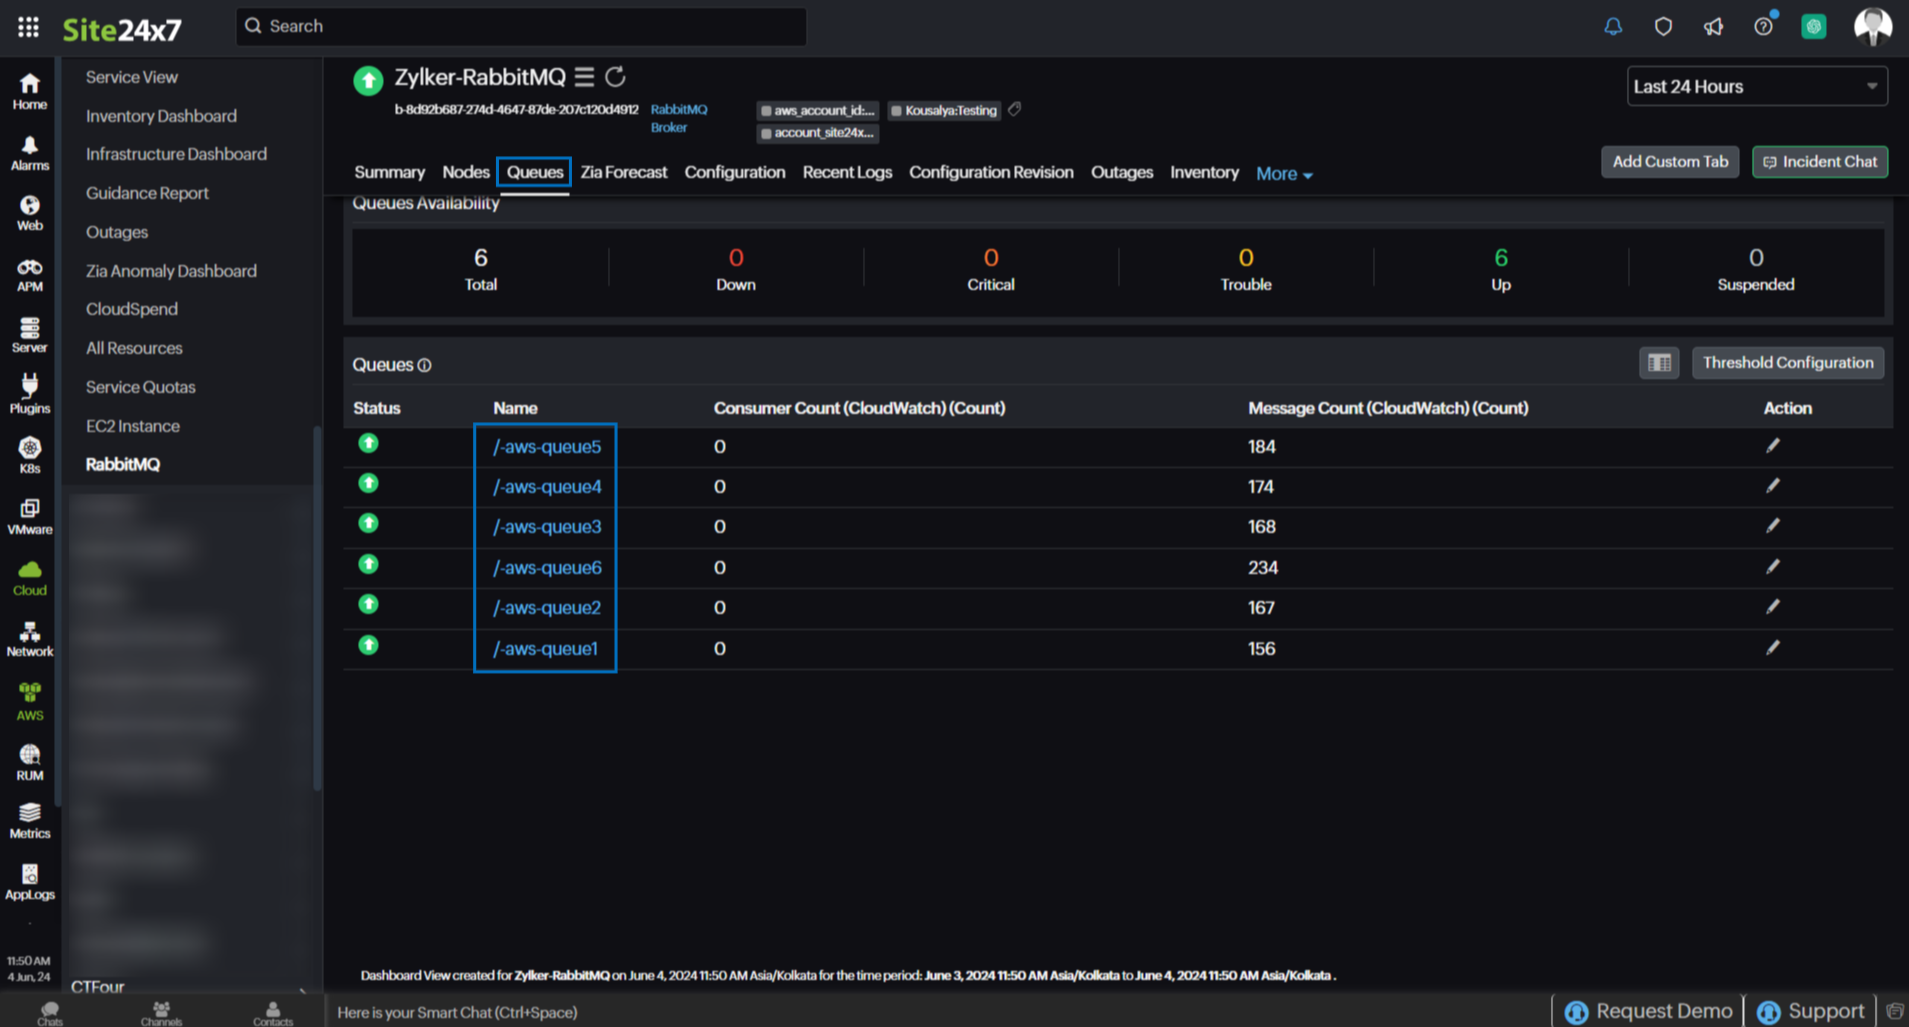
Queues
In RabbitMQ, a queue is a buffer that stores messages. The Queues tab provides the list of RabbitMQ Queue monitors, their availability, and status. Click the monitor name hyperlink to view the RabbitMQ Queue monitor data.
Configuration
The Configuration tab provides an overview of the RabbitMQ Broker monitor's configuration details.
Recent Logs
The Recent Logs tab provides the latest generated log details.
Configuration Revision
The Configuration Revision tab provides the history of configuration changes.
Outages
The Outages tab provides details on an outage's start time, end time, duration, and comments (if any).
Inventory
Obtain details like Resource Name, Region, Monitor Licensing Category, and much more from the Inventory tab. The Threshold and Availability Profile and the Notification Profile can be set according to the user and viewed in this tab.
Log Report
This tab offers a consolidated report of the RabbitMQ Broker monitor's log status, which can be downloaded as a CSV file.
RabbitMQ Node
You can view your RabbitMQ Node data on the following tabs.
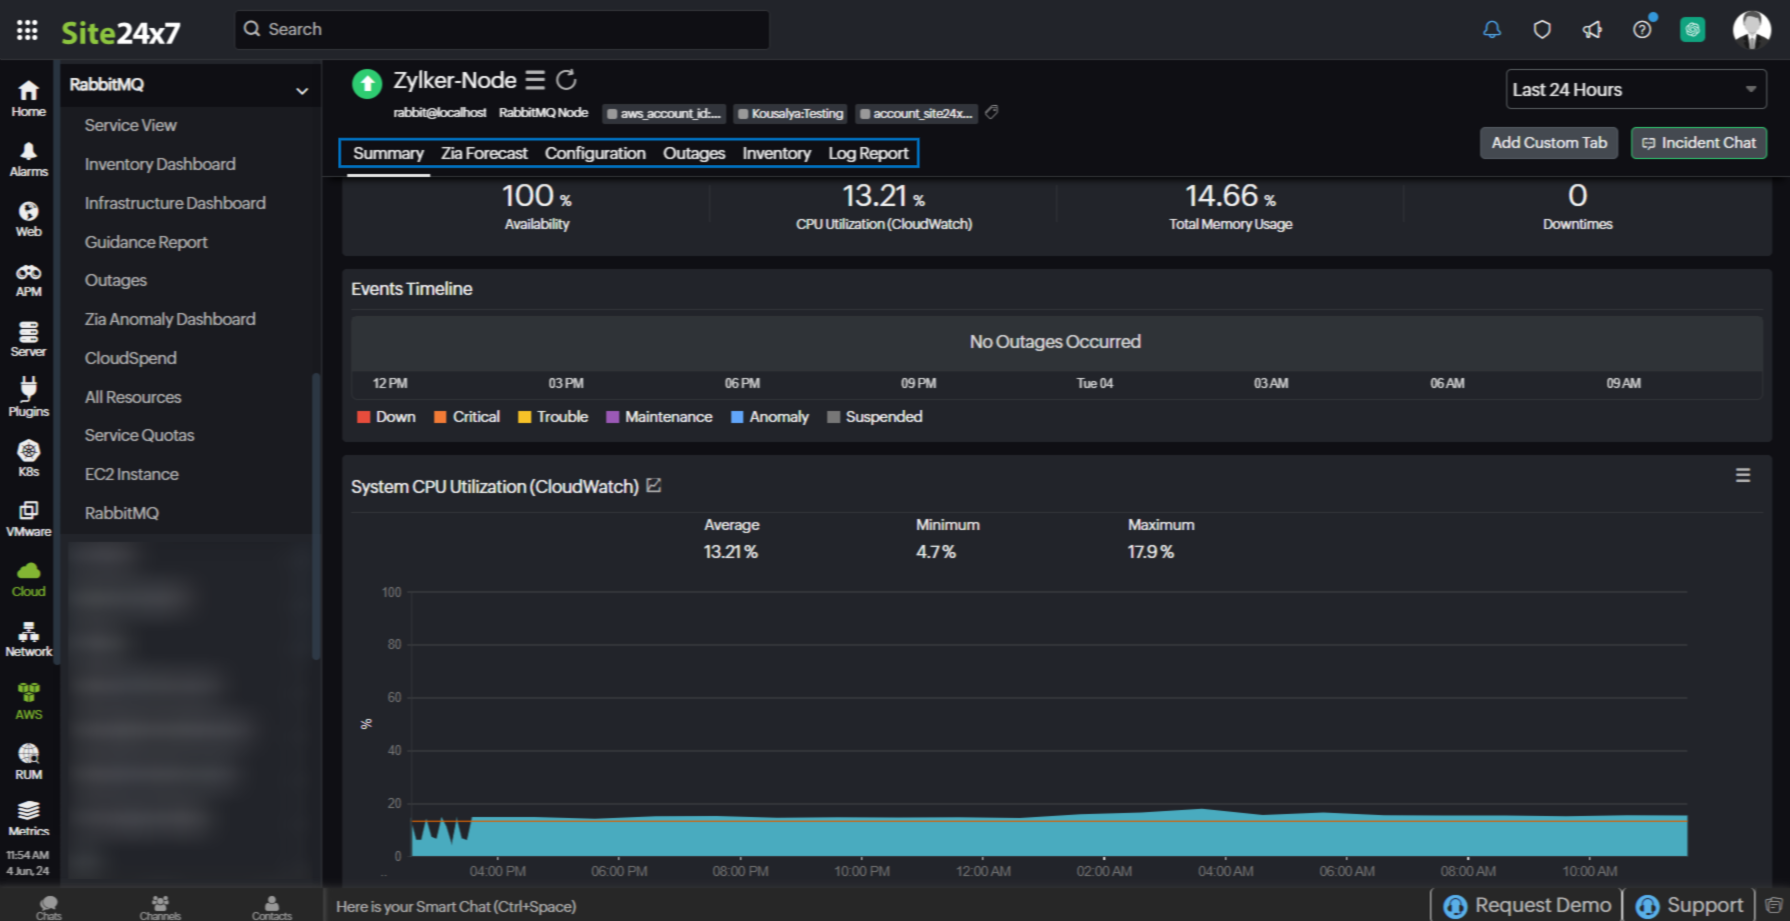
Summary
The Summary tab offers a comprehensive overview of the events timeline and metrics, presenting insightful charts that shed light on the performance and behavior of nodes within your RabbitMQ environment.
Configuration
The Configuration tab displays the configuration details of the RabbitMQ Node monitor.
Outages
The Outages tab provides details on an outage's start time, end time, duration, and comments (if any).
Inventory
Obtain details like Resource Name, Region, Monitor Licensing Category, and much more from the Inventory tab. The Threshold and Availability Profile and the Notification Profile can be set according to the user and viewed in this tab.
Log Report
This tab offers a consolidated report of the RabbitMQ Node monitor's log status, which can be downloaded as a CSV file.
RabbitMQ Queue
You can view your RabbitMQ Queue data on the following tabs.
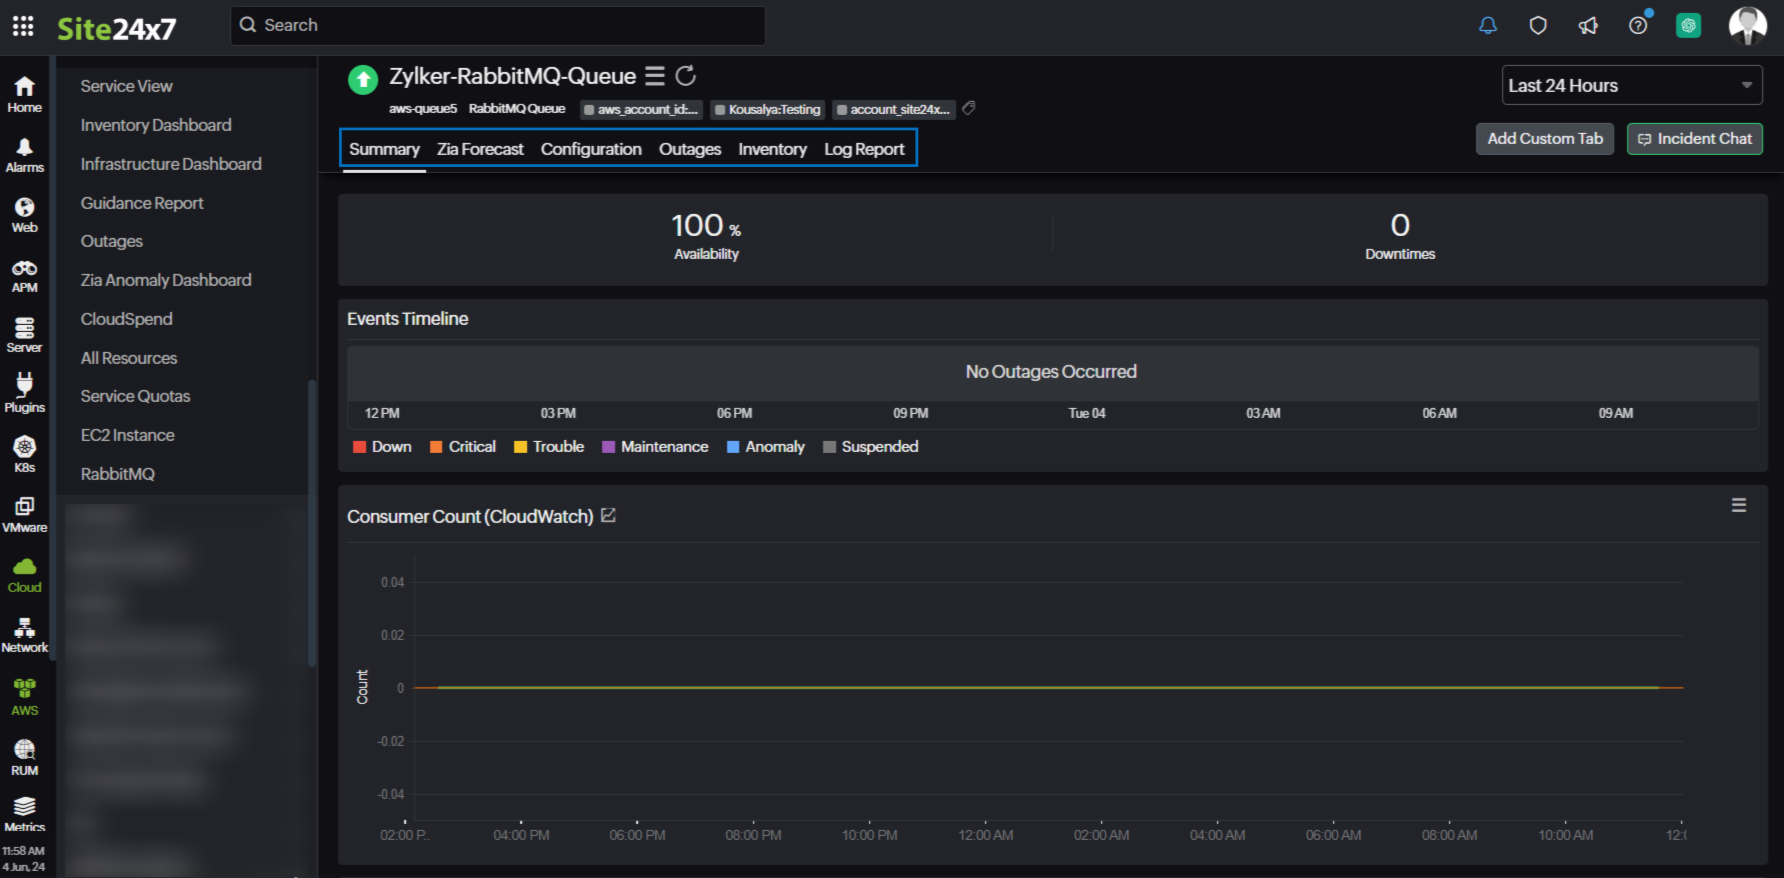
Summary
The Summary tab offers a comprehensive overview of the events timeline and metrics, presenting insightful charts that shed light on the performance and behavior of queue instances within your RabbitMQ environment.
Configuration
The Configuration tab displays the configuration details of the RabbitMQ Queue monitor.
Outages
The Outages tab provides details on an outage's start time, end time, duration, and comments (if any).
Inventory
Obtain details like Resource Name, Region, Monitor Licensing Category, and much more from the Inventory tab. The Threshold and Availability Profile and the Notification Profile can be set according to the user and viewed in this tab.
Log Report
This tab offers a consolidated report of the RabbitMQ Queue monitor's log status, which can be downloaded as a CSV file.
-
On this page
- Overview
- Use case
- Benefits of the Site24x7 - RabbitMQ integration
- Setup and configuration
- Permissions
- Polling frequency
- Supported metrics
- RabbitMQ Broker
- RabbitMQ Node
- RabbitMQ Queue
- Threshold configuration
- Licensing
- Viewing RabbitMQ data
- RabbitMQ monitor data
- RabbitMQ Broker
- RabbitMQ Node
- RabbitMQ Queue