Topology View
The Topology View is an intuitive visual interface that maps and displays your entire AWS infrastructure across multiple dimensions - account, region, and service type. This hierarchical, bird's-eye view enables users to comprehend the scope and interdependencies of AWS resources, simplifying the process of managing and troubleshooting cloud environments.
Overview
The Topology View automatically populates based on your monitored AWS accounts, visually representing resources as interactive nodes that are organized across three levels:
- AWS account level: Represents individual AWS account you’ve integrated with Site24x7.
- Region level: Segments resources geographically based on the AWS region in which they’re hosted.
- Service type level: Clusters AWS services under each region for detailed exploration and quick health assessment.
Use case
Consider a global e-commerce company that operates its applications across multiple AWS accounts, with services deployed in various regions to ensure high availability and low latency. During a promotional event, the operations team notices a spike in user complaints and transaction failures. Instead of manually inspecting logs and dashboards across each account, they turn to AWS Topology View. Instantly, the team spots a red indicator under the N.Virginia (us-east-1) region in their production account.
Drilling down, they identify that the issue is isolated to the RDS service, which is showing a critical status. With this clarity, they quickly investigate and resolve a storage threshold breach on one of the database instances, minimizing downtime.
The visual structure of the Topology View enabled the team to detect, isolate, and respond to the issue within minutes, something that would have taken significantly longer through traditional monitoring views.
Benefits of the Topology View
You can leverage the following benefits with the Topology View feature:
- Unified visualization: See all your AWS accounts, regions, and services in a single, interactive topology map.
- Faster troubleshooting: Identify impacted services and their regional dependencies quickly with a color-coded health view.
- Simplified resource discovery: Easily locate and navigate to specific services without needing to sift through multiple dashboards.
- Improved operational awareness: Gain real-time insight into infrastructure health, regional deployments, and cross-account resource distribution.
Topology View inside AWS integrated monitors
Along with the account-wide AWS Topology View, Site24x7 also shows resource-level topology inside supported AWS integrated monitors.
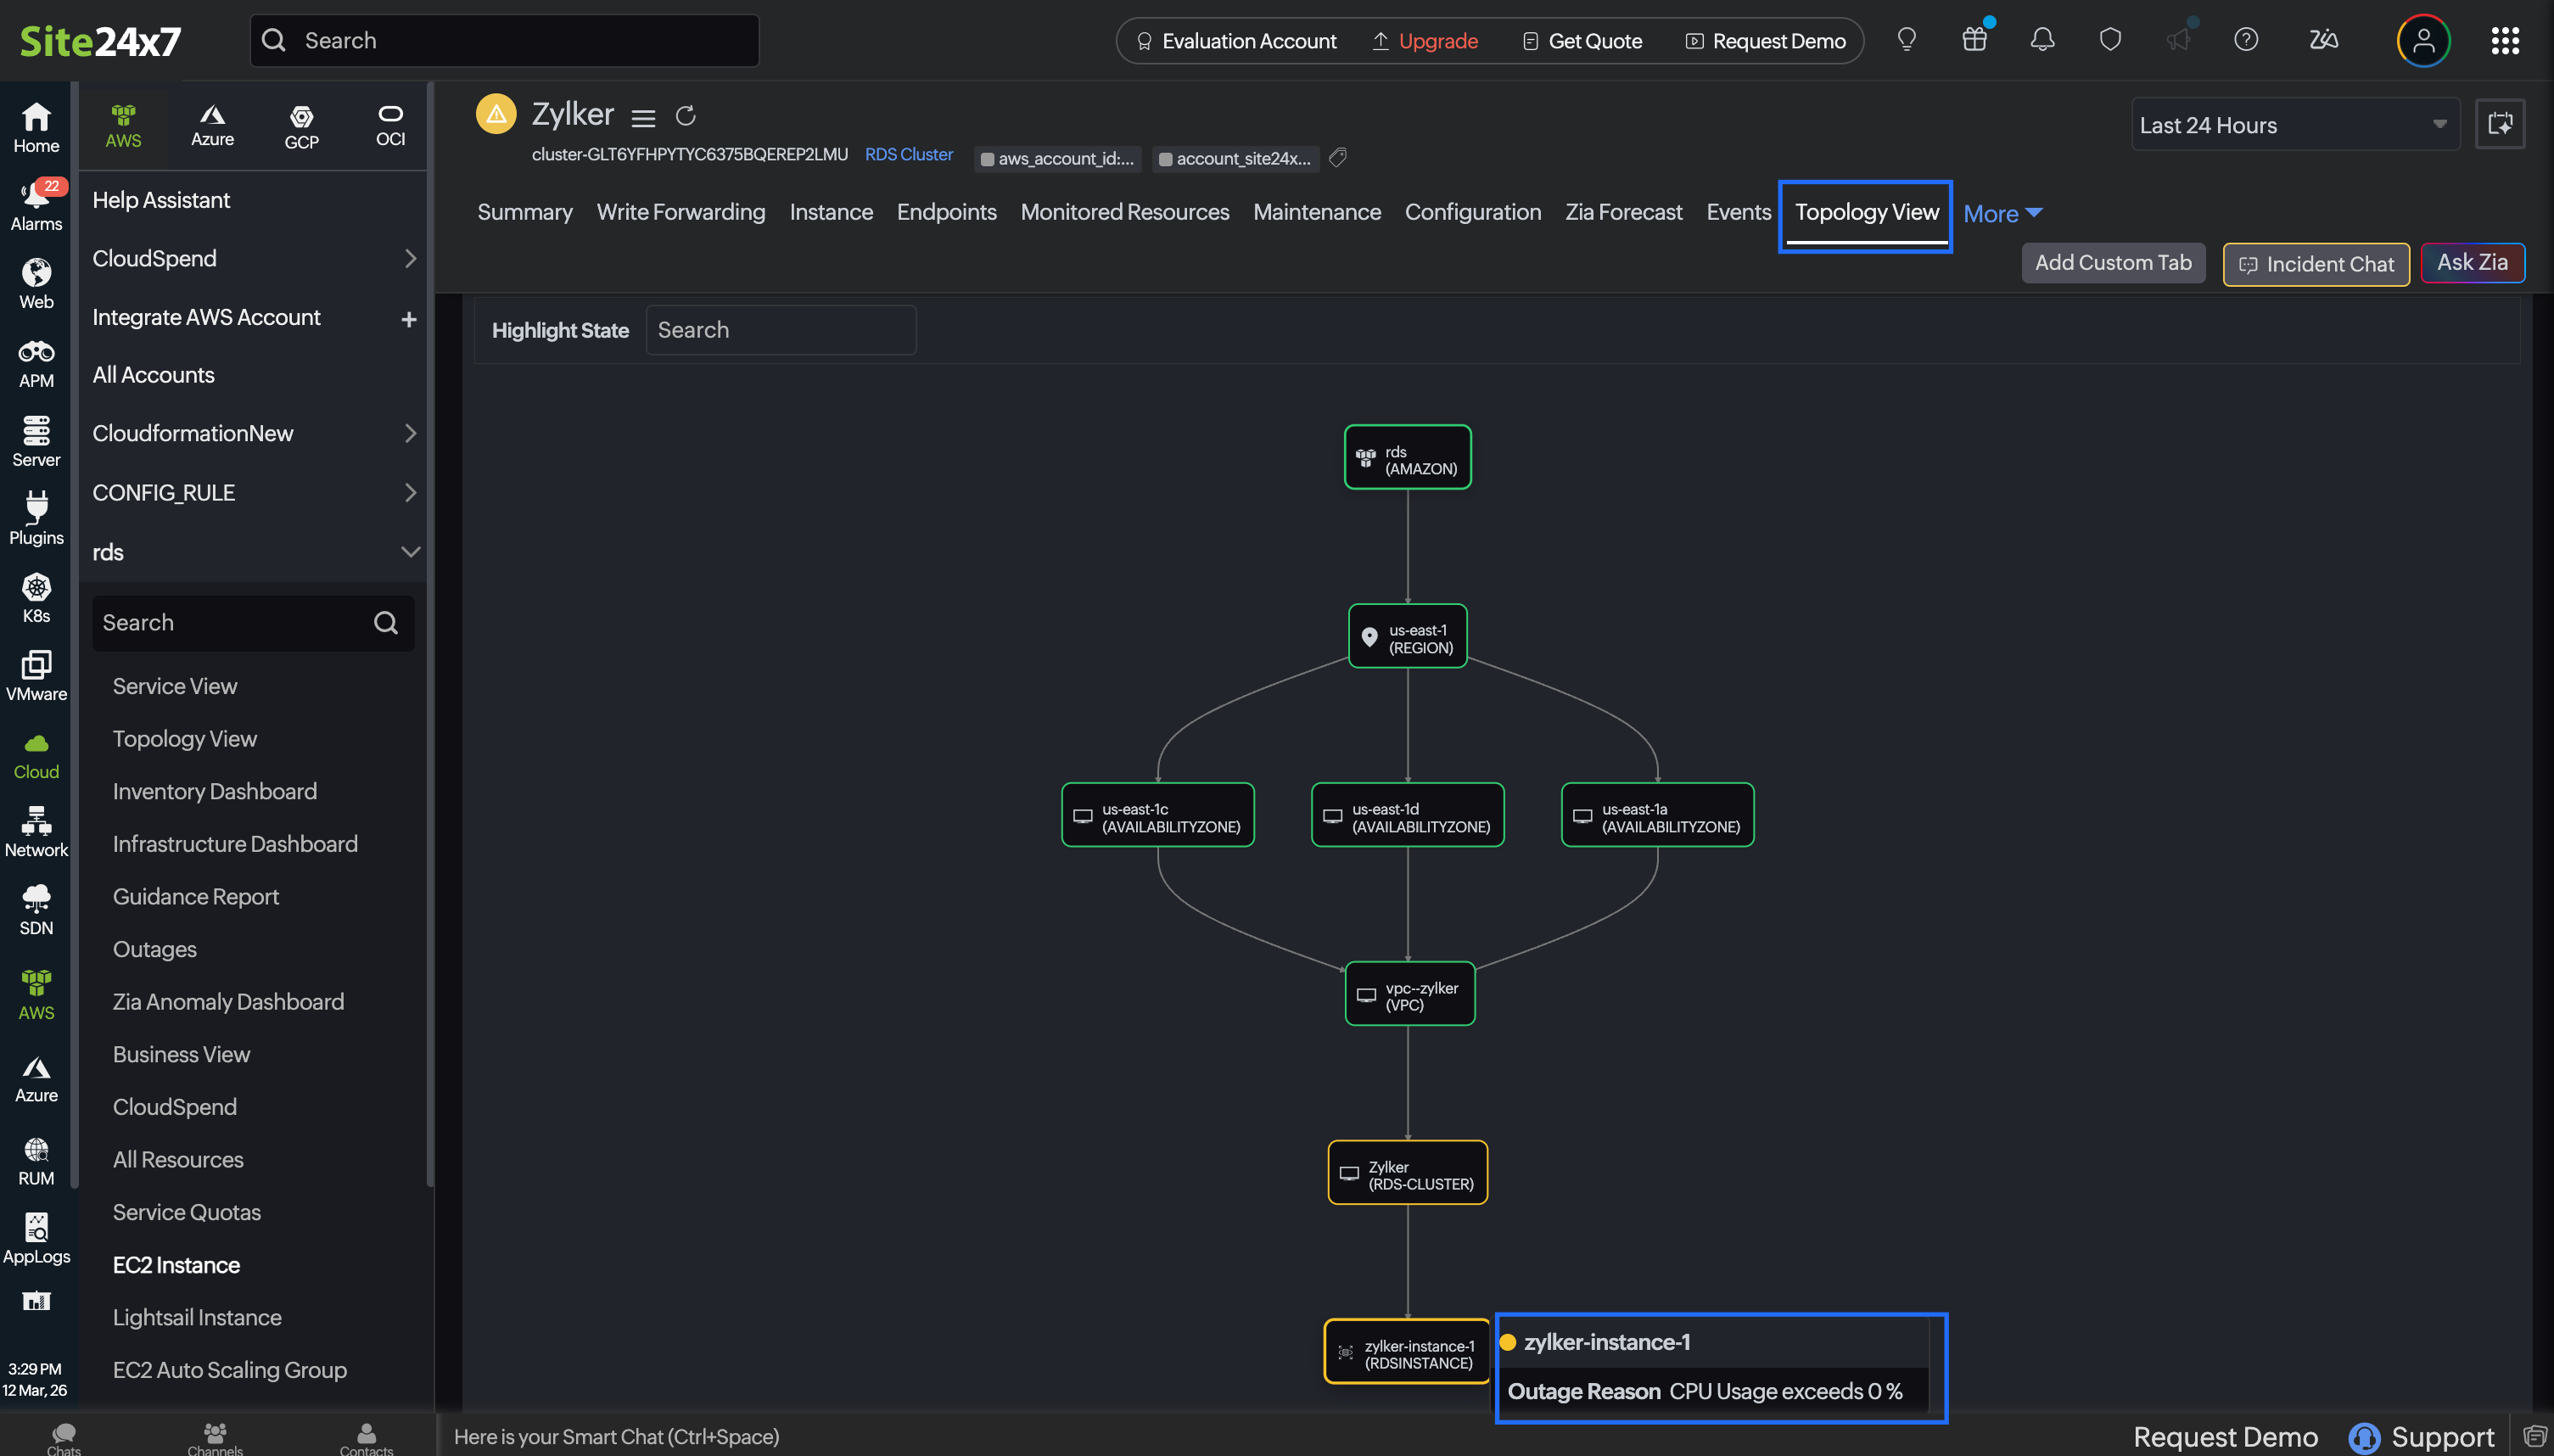
When you open an integrated monitor for a supported AWS service, you will see a Topology tab along with other tabs, such as Summary, Outages, and Inventory. This tab displays how that specific resource is connected to other related components.
The account-wide Topology View helps you understand the overall structure of your AWS environment. The topology inside an integrated monitor focuses on a single resource. It shows what that resource depends on and what other components may be affected if it fails. If any connected component is in a critical state, it is marked accordingly in the topology along with the outage reason. As a result, it is easier to spot the affected resource and understand whether the issue is caused by a related component. This is useful during troubleshooting because you can quickly understand the impact without leaving the monitor page.
Consider a scenario where an on-call engineer receives an alert that an RDS instance is in a critical state. The engineer opens the RDS monitor and checks the Topology tab where you can view the outage reason. The outage reason shows that the instance belongs to a subnet inside vpc-zylker and is linked to a parameter group and a security group that are shared with other database instances.
This helps the engineer quickly check whether the issue is limited to one instance or related to shared network or configuration settings, reducing the time needed to find the root cause.
Key UI components
The Topology View provides a dynamic, node-based visual representation of your entire monitored AWS infrastructure. The interface is designed to help users quickly identify the health and structure of their AWS environments across different accounts, regions, and service types.
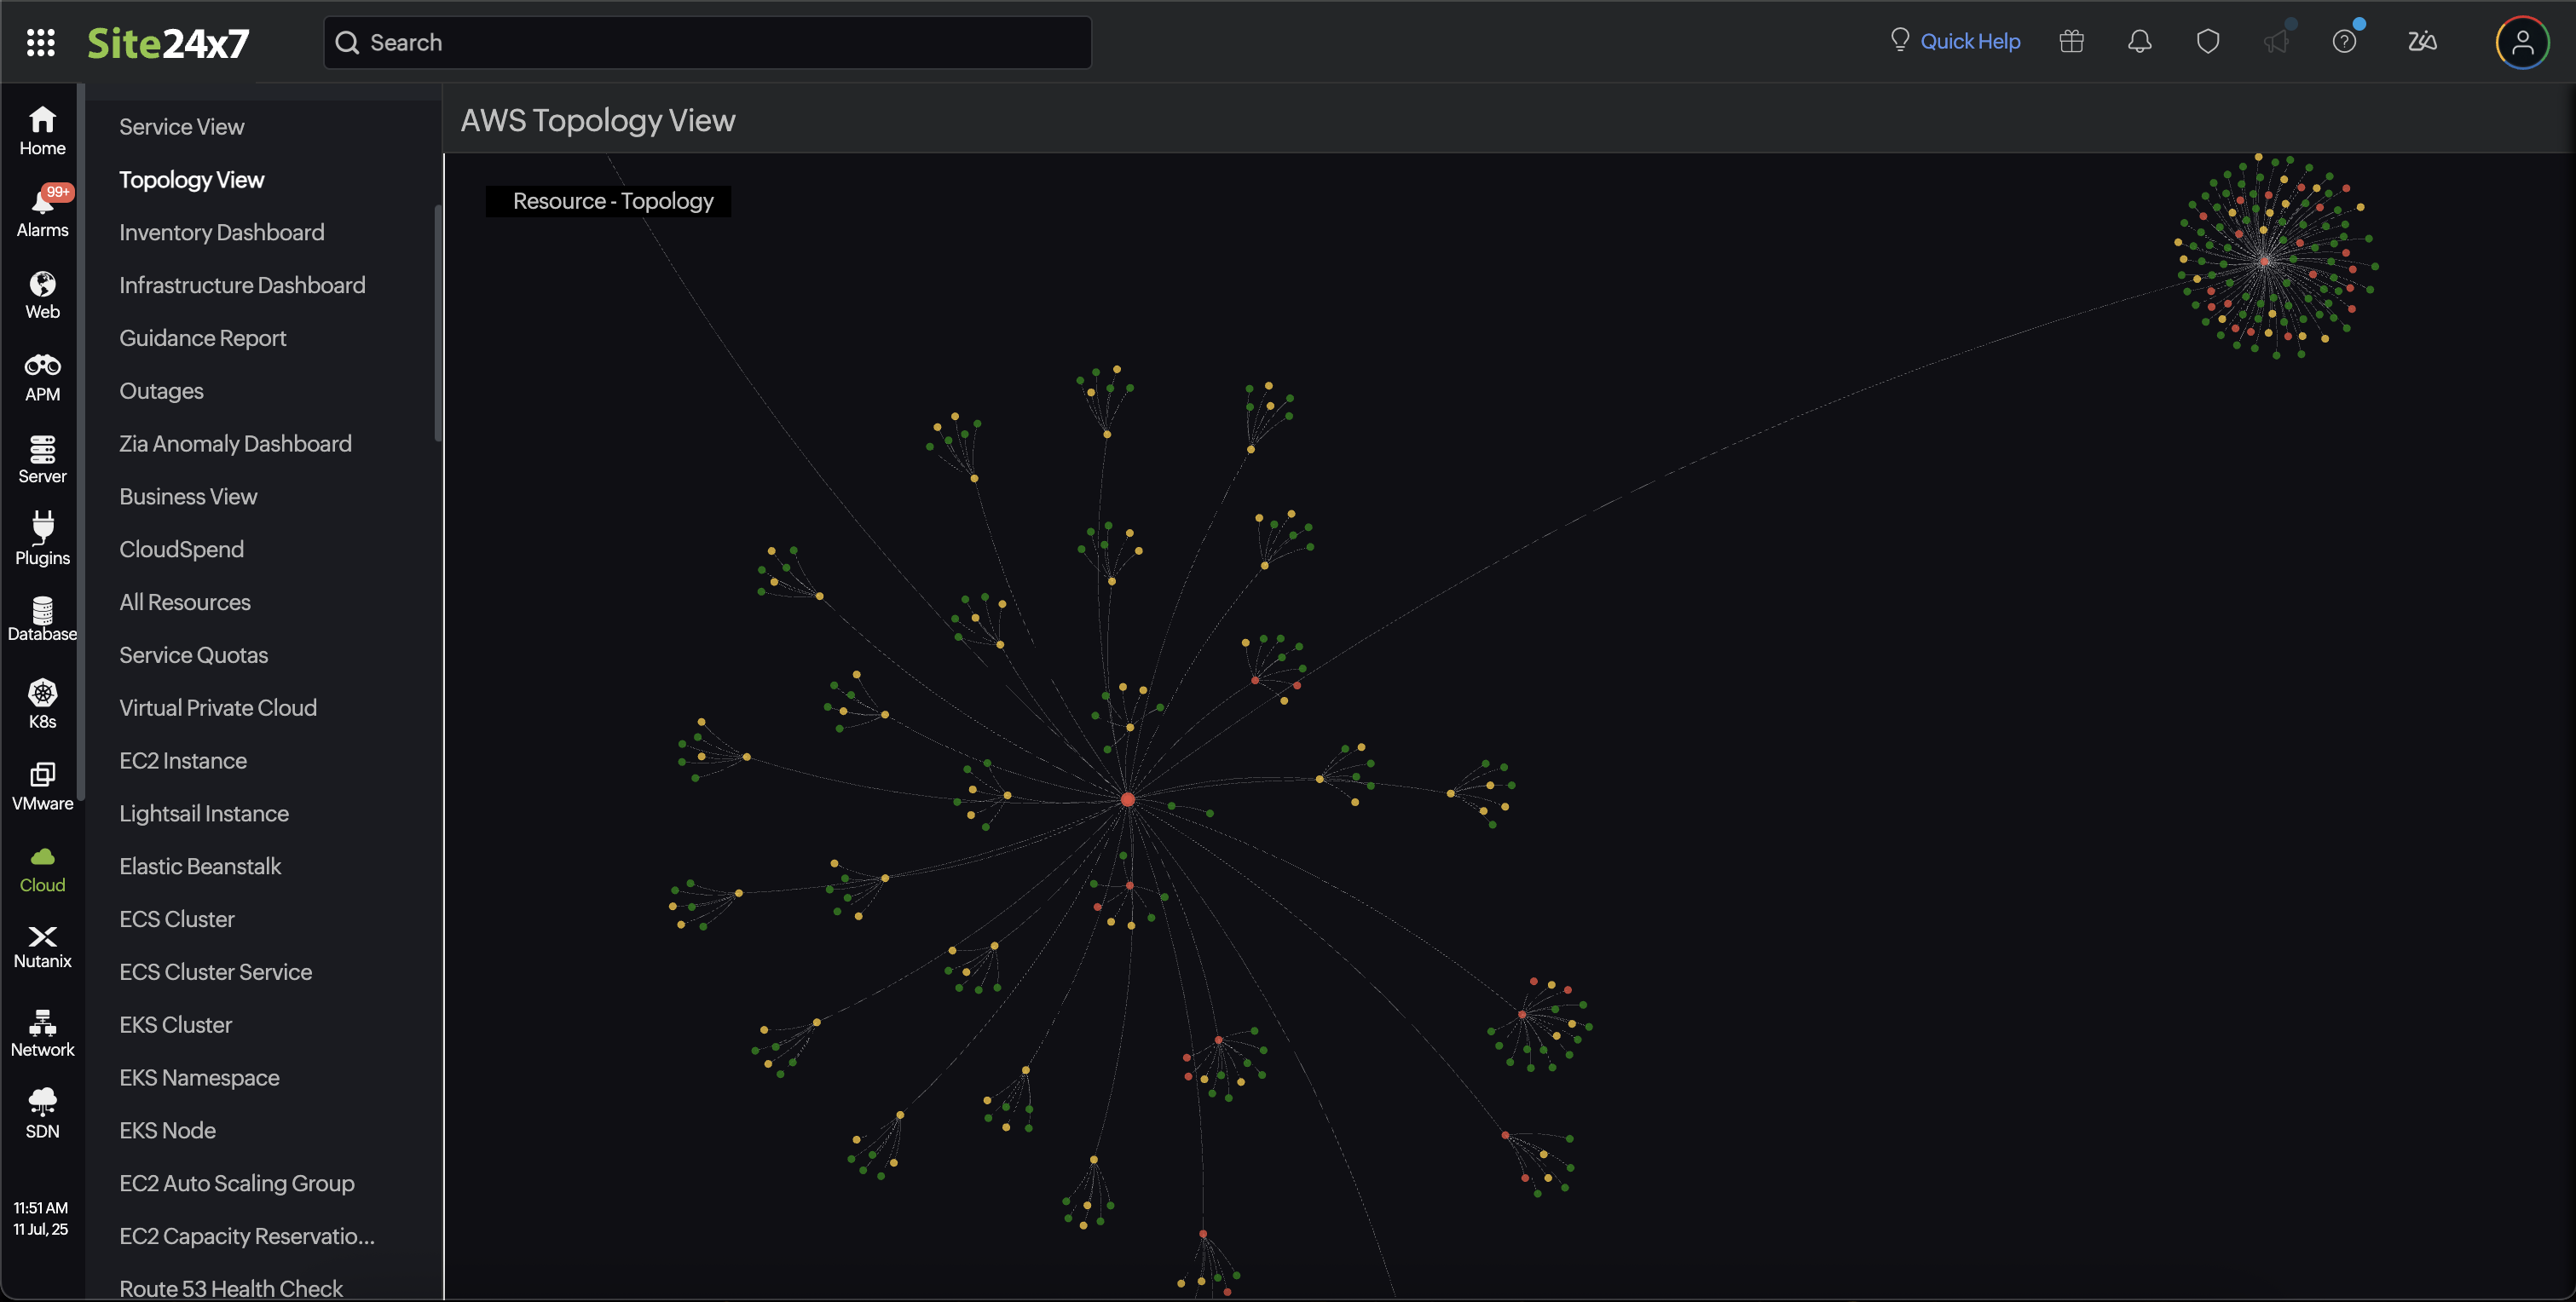
Central node
At the center of the visualization is the root node, which represents the top-level grouping of all your AWS accounts and associated regions.
Radial node layout
Branching out from the central node are multiple interconnected nodes, each representing different AWS regions. These, in turn, expand into service types within each region. The radial layout helps users easily trace paths from the top level to individual services.
Zoom and pan
Explore large topologies efficiently using zoom controls and pan navigation. Clicking a node typically displays the Component Details View panel with more in-depth details for that service or region.
Health status legends
A legend panel is provided to interpret color codes and understand resource health at a glance. Each node is color-coded to reflect the health of the corresponding component.
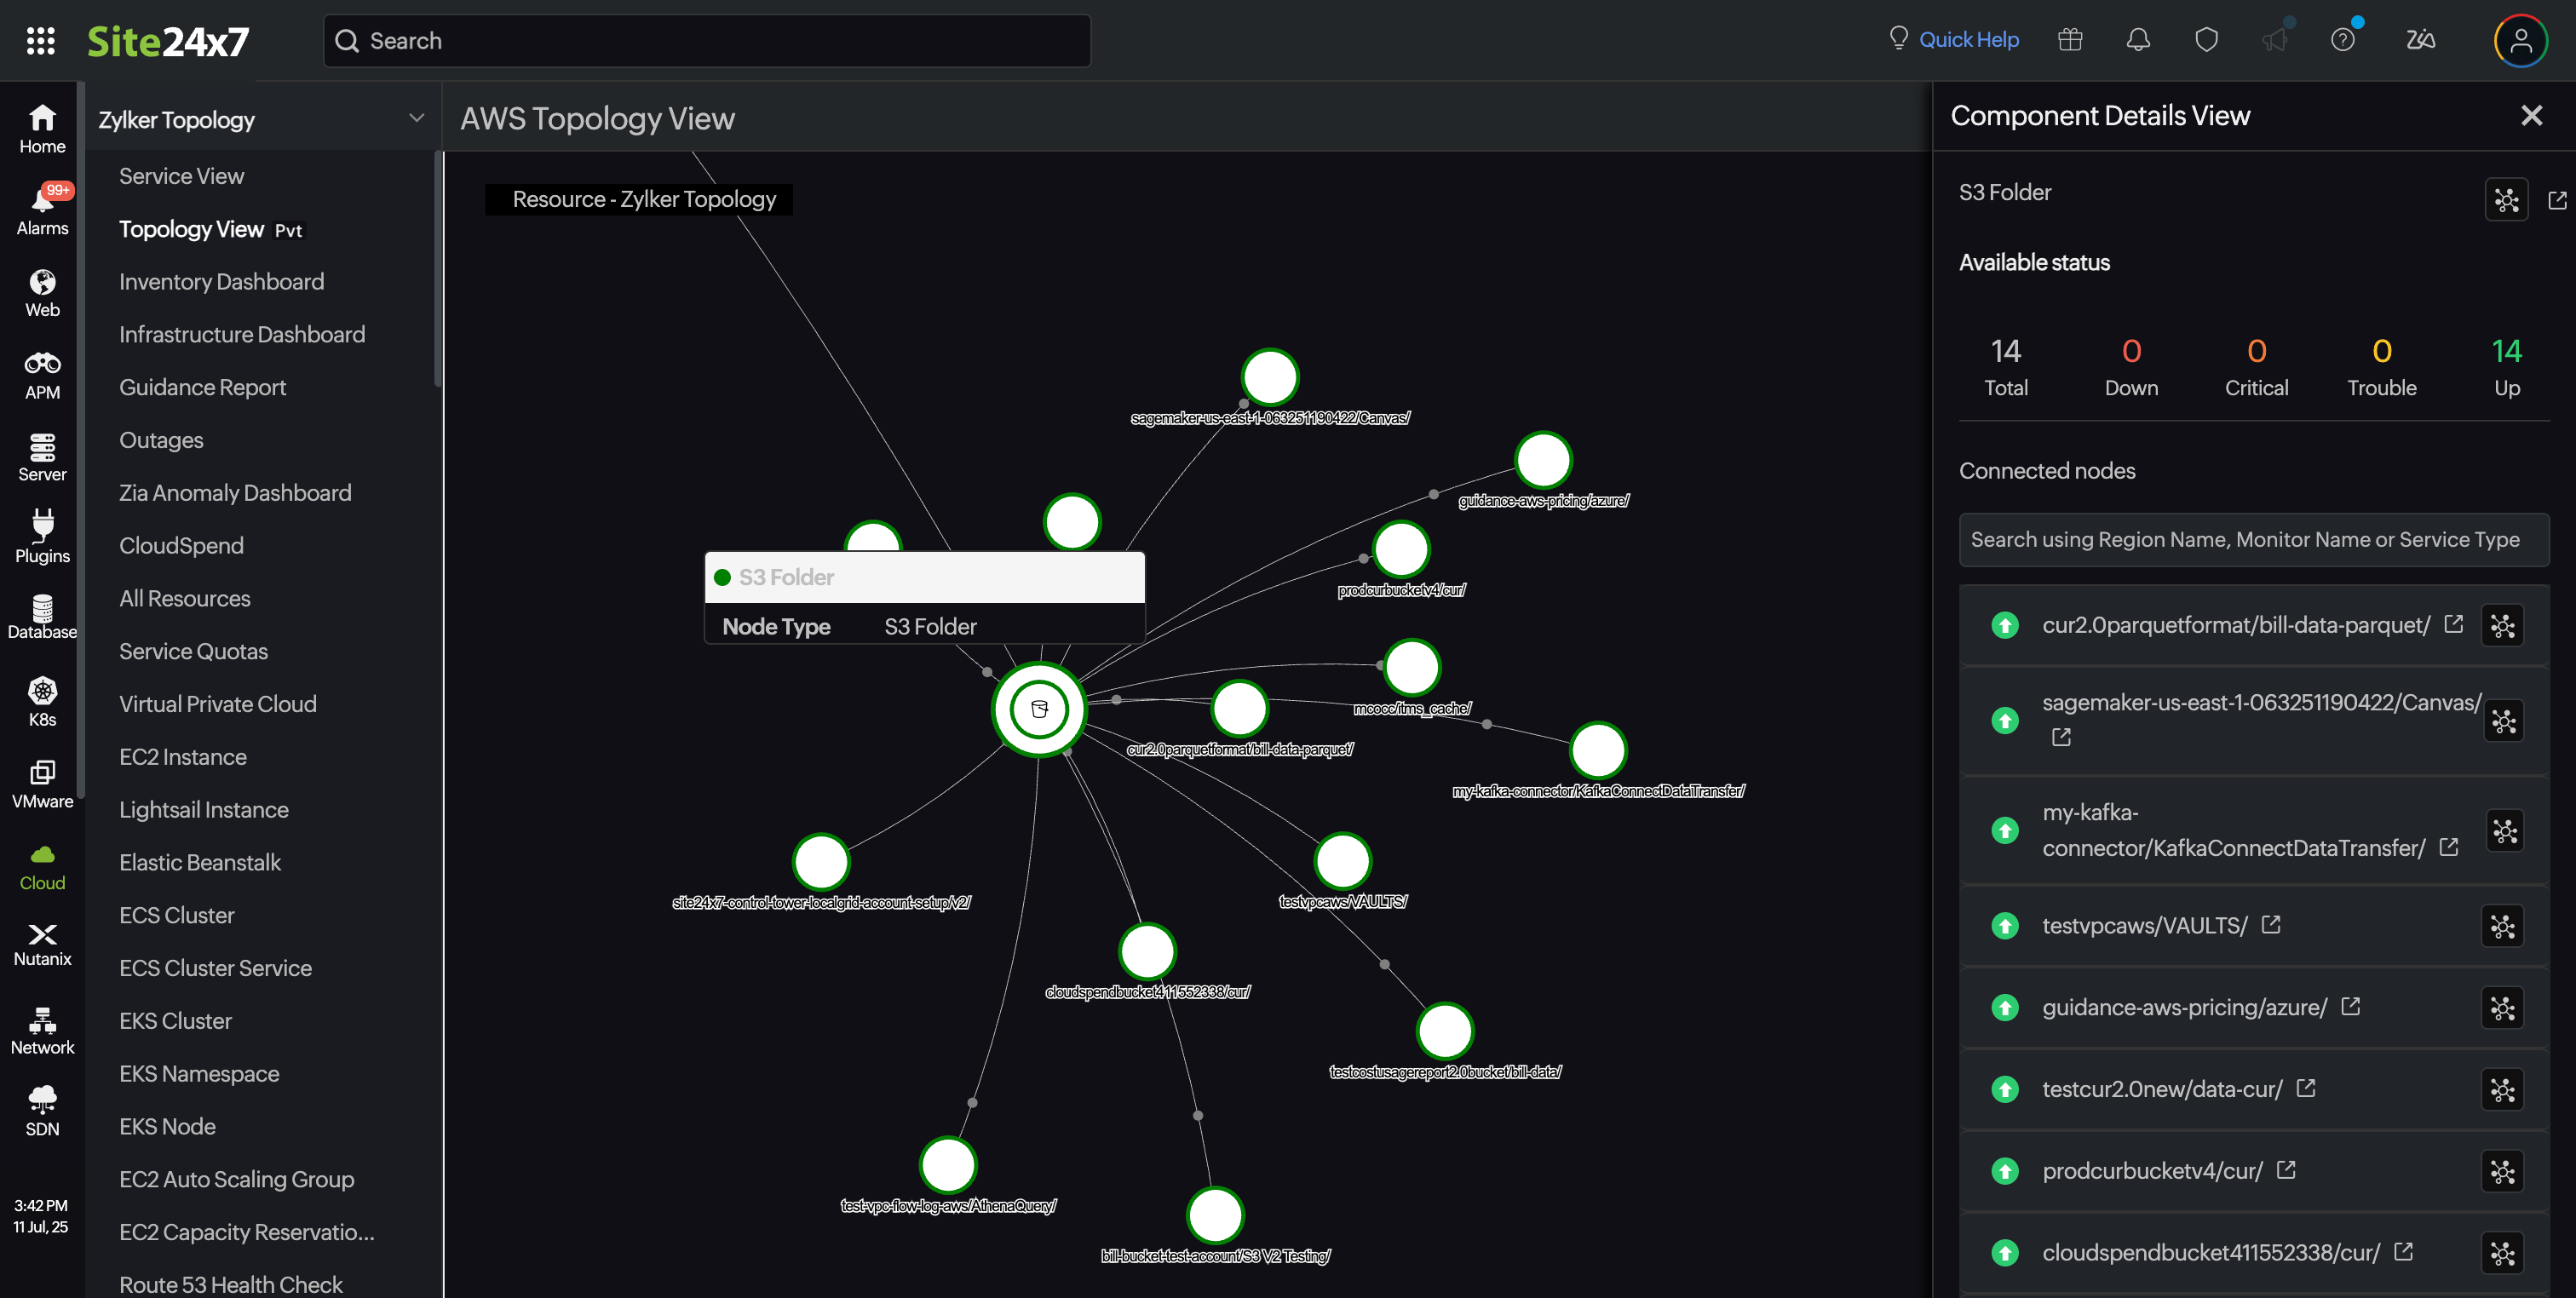
Component Details View (right panel)
When you click on a node, the Component Details View panel appears on the right side. You can drill down into the specific region or service type. The UI visually shifts focus to that part of the topology, expanding or collapsing views accordingly. This makes root cause isolation faster and more intuitive.
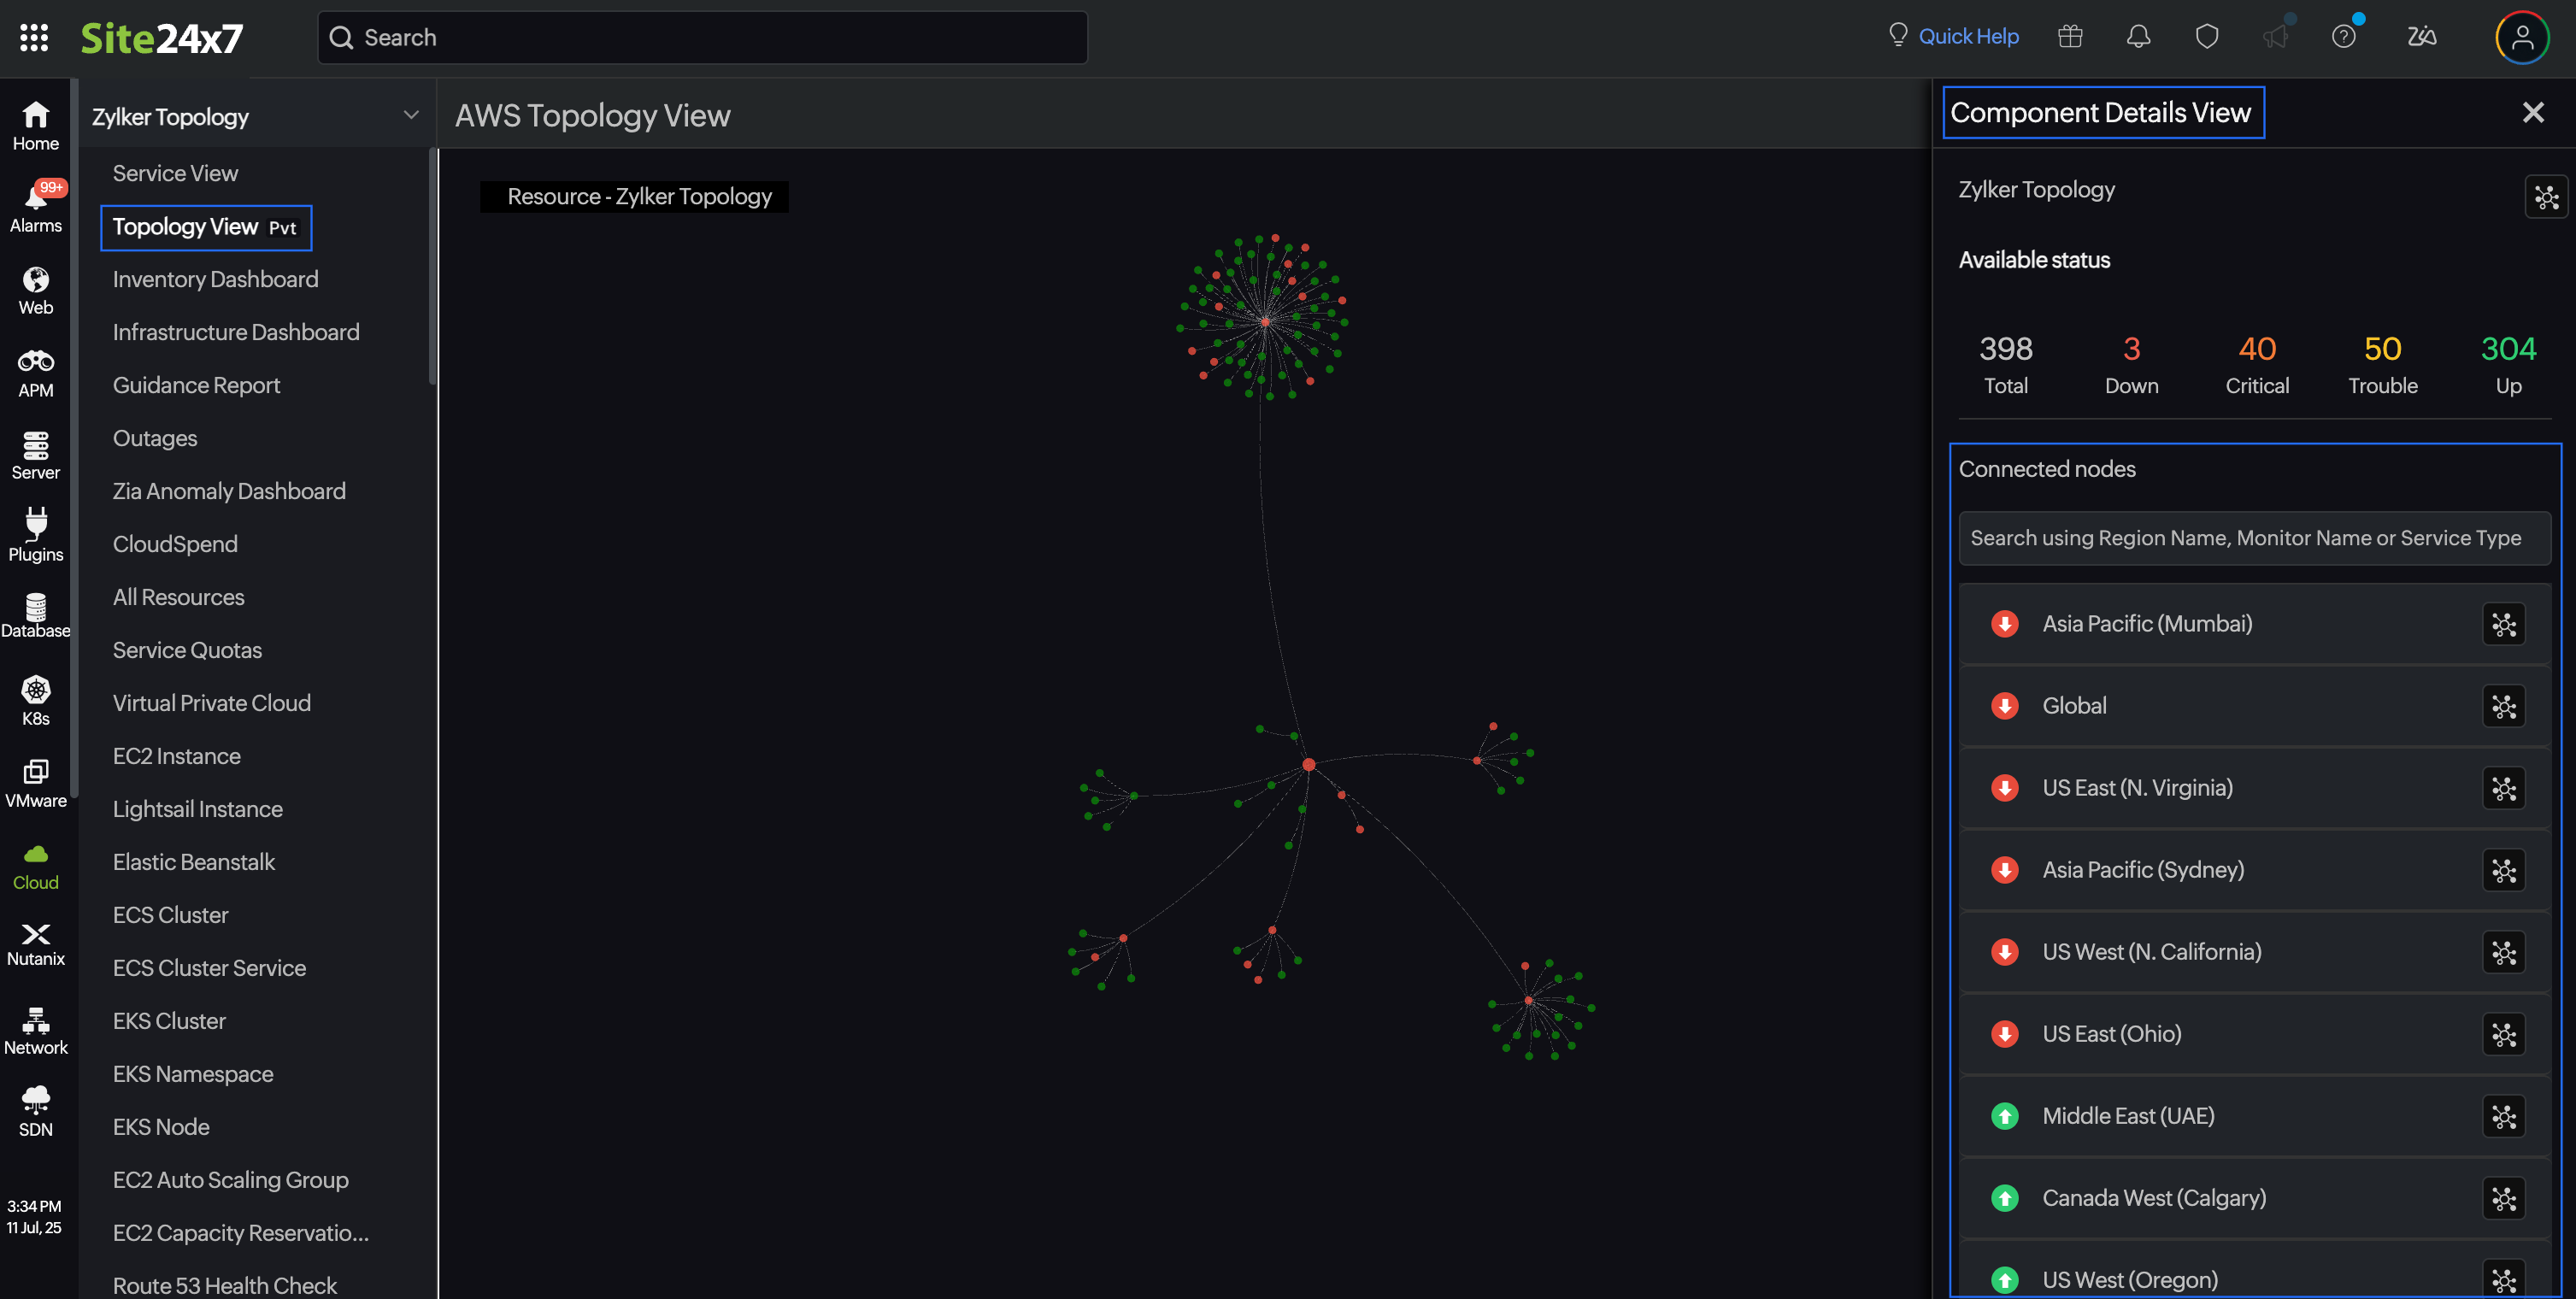
The Component Details View panel displays:
- Region or Service name: Click the View Connections icon against the region or service name to focus on the region or service. To view the monitor summary for a service type, click the new tab icon next to the service type.
- Availability Status: View details such as Total monitored resources , current Down , Critical , Trouble , and Up statuses.
- Search bar: The search bar within the panel enables you to locate a specific region, monitor, or service type for faster navigation.
- Region-wise or service-wise breakdown: A list of AWS regions or services is displayed, each with an associated health icon. This helps quickly pinpoint problematic regions or service areas.
- Monitor list view: To view the monitor list page, click the new tab icon next to the service type name in the Component Detail View panel.
Interacting with the Topology View
When you access the Topology View, the root AWS account is automatically highlighted with double circles, and the view is zoomed in to bring it into focus. This serves as the central point from which all regions and services are mapped.
You can zoom in to focus on a region and click on the desired region (like US East or Asia Pacific) in the topology graph to explore it further. Simultaneously, the Component Details View panel on the right side of the screen will display detailed information about the selected region, such as the total number of resources, their health status, and any existing issues.
To focus on a particular region and understand its resource relationships, you can click the View Connections icon next to that region in the Component Details View panel. This action filters the topology to display only the selected region and its connected resources, helping you gain a clearer view of the dependencies and interactions within that specific region. This focused view is especially useful for troubleshooting region-specific issues or analyzing service impact in isolation.
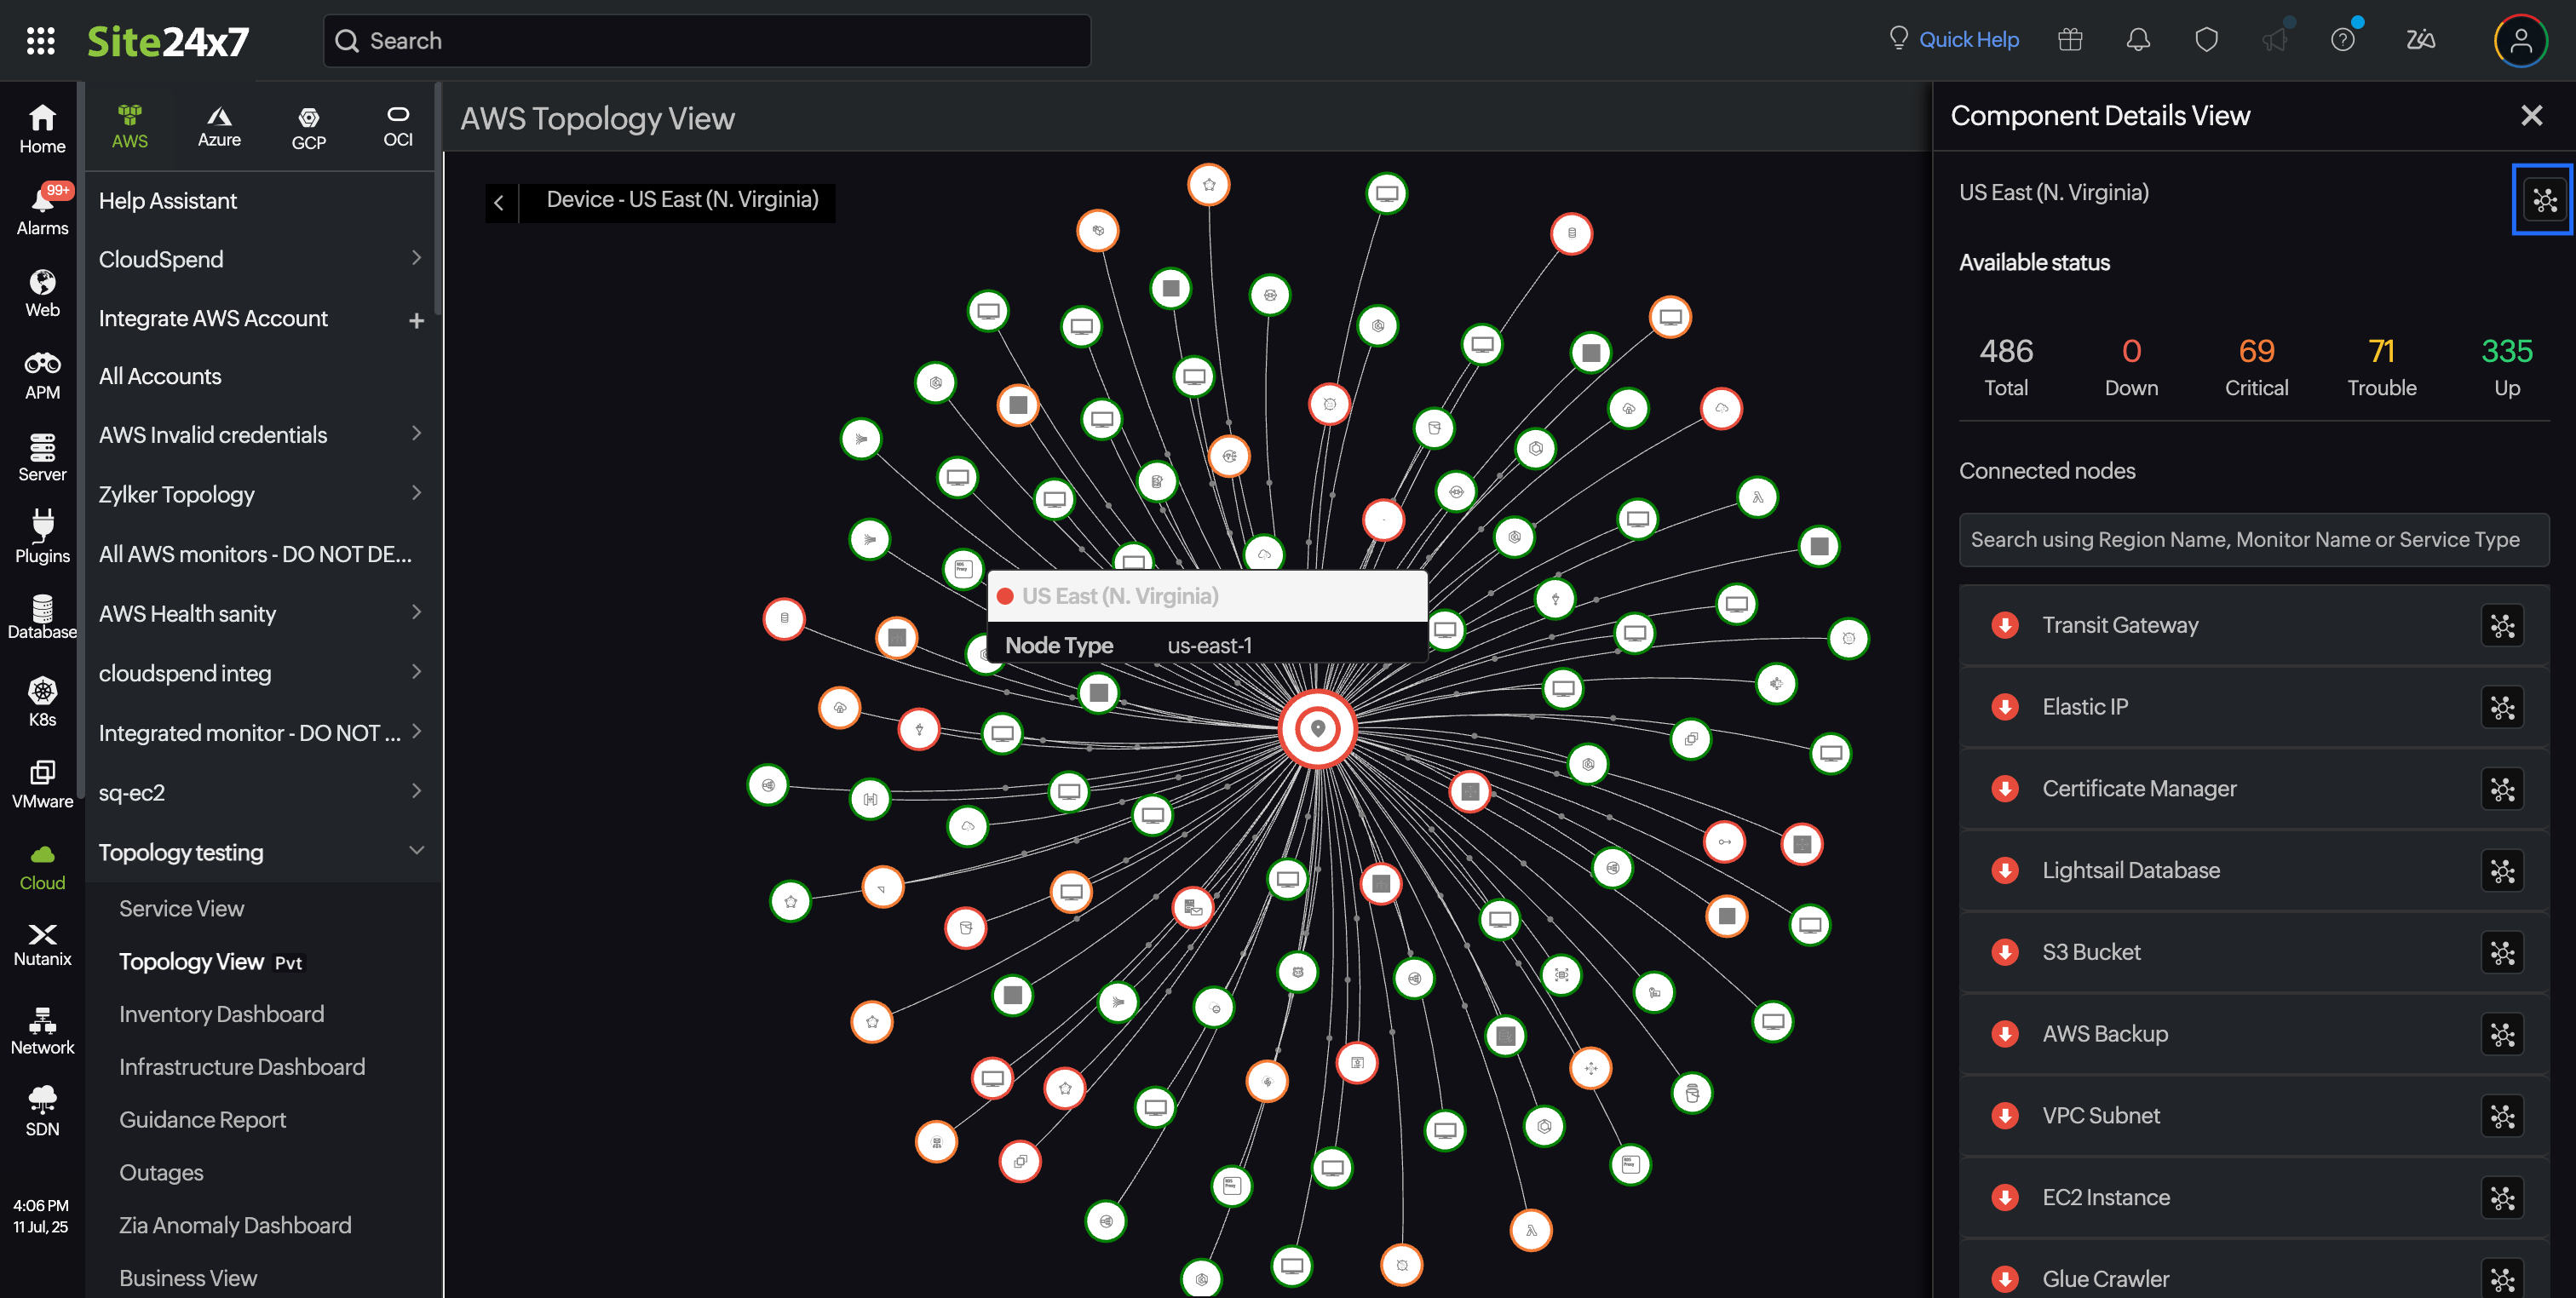
You can also click on a specific service type (like S3 Bucket or RDS) in the Component Details View > Connected Nodes section, within a region to view its individual status. The corresponding details will be displayed in the same Component Details View panel.
Additionally, you can use the search bar within the Component Details View to quickly find and highlight a specific region or service type. Upon selecting a search result, the topology view will automatically navigate to and focus on the selected item, allowing for quick and seamless navigation.
When you drill down to a specific service type within the Topology View (for example, EC2 or RDS), Site24x7 displays all the monitors associated with that service.This view shows how the monitors of the selected service are connected to other AWS resources and how it fits within the overall structure of your AWS account.
To focus on a particular monitor and understand its resource relationships, you can click the View Connections icon next to that monitor name in the Component Details View panel. From this perspective, you gain a comprehensive understanding of how a specific monitor is linked or integrated within the AWS infrastructure. For instance, the connections can be traced step-by-step: starting from an EC2 instance, which is associated with one or more Security Groups, then linked to a Subnet, followed by its corresponding Availability Zone. This Subnet is part of a larger Virtual Private Cloud (VPC), which resides within a specific AWS region, and ultimately, the entire hierarchy is tied to an AWS account. This structured view helps visualize the dependencies and relationships across different AWS components.
This detailed drill-down helps you visualize dependencies and understand the relationships between each monitor. If there's a status change or issue with a particular monitor, you can easily identify which related resources might be affected. This enables faster troubleshooting and better impact analysis in the event of an outage or performance issue.