Azure Monitoring
Site24x7's Azure Monitoring allows you to discover and monitor your Azure resources and gain insight into the key performance metrics that are critical for the healthy functioning of your Azure environment.
Currently, we support monitoring for 100+ service types with their exclusive set of metrics that help you drill down into your resources.
Get notified about any potential issues or anomalies in your Azure resources by setting up alerts when specific metrics or thresholds are breached and automate redemptive actions.
Prerequisites:
Use any one of the three methods listed below to authenticate Site24x7 to monitor your Azure resources.
- Create and authenticate with a custom application.
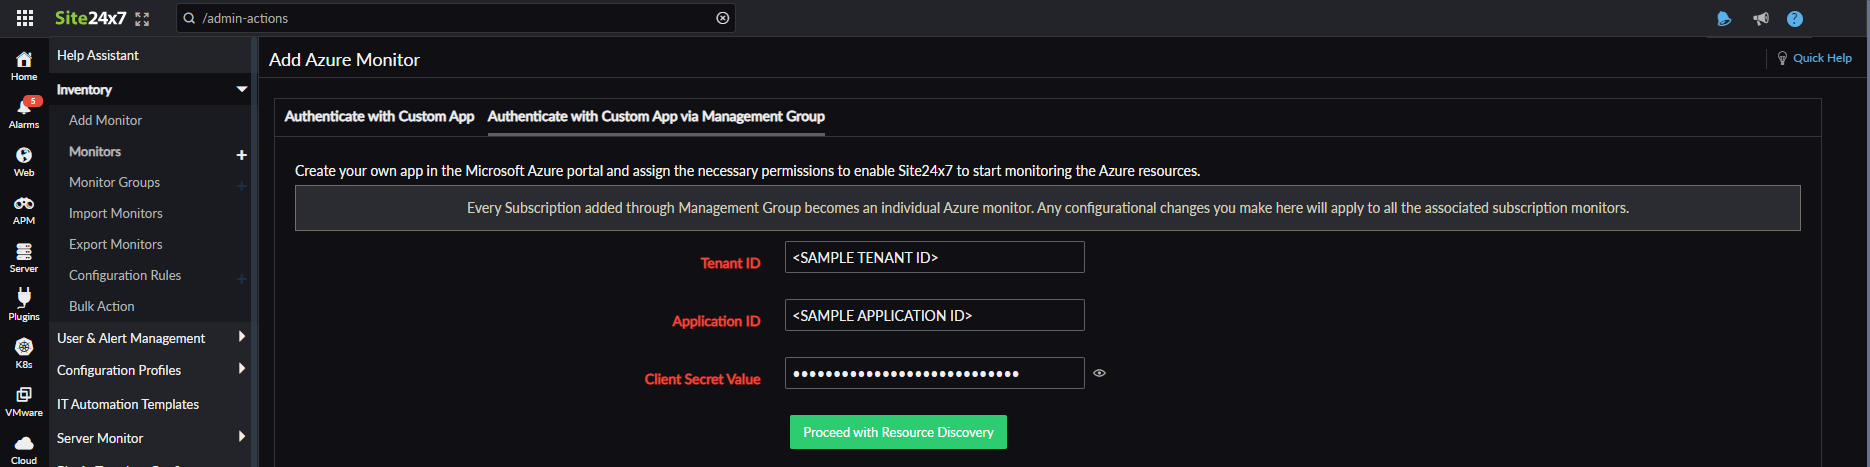
- Create and authenticate with a custom application via Management Group (recommended)
- Recommended because each Subscription is added as an individual Azure monitor which helps in better management.
- Use an existing application by using the Directory (tenant) ID, Application (client) ID, and Client Secret from the Azure portal.
Now, you can proceed to add an Azure monitor.
Adding a monitor
- Log in to your Site24x7 account.
- Navigate to Cloud > Azure > Add Azure Monitor. Alternatively, you can also click Admin in the left navigation pane and under Cloud Monitoring click Azure.
- Paste the Tenant ID, Client ID, and the Client Secret Value, obtained from completing the prerequisite steps, in their respective fields.
- Click Proceed with Resource Discovery.
Once the access is successfully granted, you will be redirected to the Site24x7 console to add a monitor.

In the Add Azure Monitor page:
- Provide a Display Name for identification purposes.
- Set the Client Secret Expiry date.
- Associate the monitor with existing or new Monitor Groups.
- In the Add Azure Monitor page:
- Select the Subscriptions you want to monitor from the list of discovered Azure subscriptions in the Subscriptions drop-down menu.
- Toggle Auto-add New Subscriptions for Monitoring to Yes to automatically discover and add new subscriptions for monitoring.
- Select the Resource Groups to monitor from the Resource Groups drop-down menu.
- Toggle Auto-add New Resource Groups for Monitoring to Yes to automatically discover and add new resource groups for monitoring.
- Select the Azure service types you want to monitor from the Service/Resource Types drop-down.
- By default, all subscriptions, resource groups, and supported service types in your Azure account will be selected for monitoring.
-
Include Azure Resources based on Tags: Toggle between OR or AND based on your preference. Type the Key and also the values to match the resources that you want to include for monitoring. You can add as many tags as you need by clicking the + icon near the Value tab.
This option will include the matching resources from your Azure Account and add them for monitoring.
-
Exclude Azure Resources based on Tags: Toggle between OR or AND based on your preference. Type the Key and also the values to match the resources that you want to exclude from monitoring. You can add as many as you need by clicking the + icon near the Value tab.
This option will exclude the matching resources from your Azure Account and exclude them from monitoring.
- Toggle Auto-discover New Resources to Enable to automatically discover and monitor any new resources in the upcoming discovery cycle.
- If auto-discovery is triggered by the user from Site24x7, new resources will be discovered irrespective of the preference provided here.
- Under the Advanced Configuration section, make the relevant changes.
- Configure a Default Threshold Profile for every service supported: Select the service type for which you want to assign a threshold profile.
- Under Resource Termination Settings:
- Toggle Yes to Mute Resource Termination Alerts if you don't want to receive alerts when the terminated resources are automatically suspended or deleted from Site24x7.
- Toggle Yes to Monitor Terminated Resources to ensure monitoring continues for terminated resources. The monitor will be labeled Down, and the polling will continue until manually suspended.
- Toggle Yes to Automatically Remove Terminated Resources from monitoring. You can also choose to define a specific time period (in days) to determine how long the terminated resources should be retained in the Site24x7 web console before being permanently deleted.
- If this field is set to Yes: The monitored resource will move to deleted state
- If this field is set to No: The monitored resource will move to suspended state for the stipulated time period.
- To configure Azure Activity Log Collection:
Under Activity Logs Collection Configuration, enable Activity Logs Collection, set the Log Collection Interval, and select the Log Categories to be collected. - Select existing Notification Profiles, User Groups, Site24x7 Tags, or add new ones. This will apply to the resources that are added in the upcoming discovery. These will be applied to all the associated resource monitors too. For each resource, a Site24x7 Azure tag consisting of Resource Group, Location, Subscription, and Resource Type will be created. You can also integrate Site24x7 alarms with your preferred third-party service.
The following is the tag format:
subscription: {subscription_name}
resourceGroup : {resourcegroup_name}
location: {location}
serviceType: {monitortype} - Under the Advanced settings, if Auto-create monitor group is set to Yes and tag key and value/value RegEx is given, a system-generated monitor group will be created along with the subgroups for each tag key-value pair.
- Click Discover Azure Resources to start monitoring.
It takes upto 30 minutes to discover all your Azure resources.
List of services monitored by Site24x7
Monitor 100+ Azure resources including virtual machines, scale sets, storage accounts, IoT Hub, and Cosmos DB.
Dashboards
Once your Azure monitor has been successfully created, you will be directed to the Subscriptions page.
All of your Azure resources will be added to the Site24x7's user console within a few minutes.
In addition to this Subscriptions dashboard, there are three exclusive dashboards. You can also create custom dashboards, perform management actions, and detect critical anomalies.
Customizing your Azure monitor
Tailor your Azure monitor with advanced configurations and manage your resources with maximum visibility.
Azure Uptime monitoring
Site24x7’s Azure Uptime monitoring enables proactive tracking of your Azure resources’ availability and uptime, along with their configuration and inventory details.
Service Quota monitoring
Site24x7's Azure service quota monitoring allows you to monitor quota usage proactively, establish alerts based on thresholds, and prevent unexpected service limitations. By monitoring quotas for storage, compute, networking, and other important resource categories, you can guarantee seamless cloud operations and plan capacity effectively.

Logs
Activity Logs

Every action that you perform in the Azure portal will be registered as a log entry. Logs will be collected in the user-preferred time-interval and will get listed on the Activity Logs page.
To get the list of Logs:
- Go to Azure > click the Azure monitor > Activity Logs.
NoteThe Activity Logs tab will not be visible if you have not integrated with Site24x7 AppLogs. To start collecting logs, go to Admin > AppLogs > Settings > select Yes for the option Collect application logs from servers using AppLogs. - Type in a query and click the search icon to search through the logs.
- Choose a time range to show logs for a specific period.
Resource Logs
Resource Logs for all your Azure resources will be collected using Diagnostic Settings. With the help of these logs, you can monitor the operations performed within the Azure resources.
To enable this feature, go to the Azure App Service monitor and click Resource Logs. Click Enable Resource Log Collection and select the log categories to be monitored. In the next data collection, the requested logs will be collected.
For now, this feature is supported for Azure App Service only.
Resource dependencies
Most Azure resources will be dependent or will have a dependent resource for their proper and continued functioning. This page lists all the discovered resources with the resources they are dependent on, along with their status (reason), service type, and location. Listing the dependent resources helps to find out the reason behind the downtime of the parent resource.
Bulk actions
Apply changes to multiple Azure resource monitors filtered based on their subscriptions, resource groups, types, or locations using bulk actions.
Monitor groups
- Go to Cloud > Azure and click the Azure monitor. Click any of the service types listed in the left panel, then select the desired resource monitor.
- Hover over the hamburger icon
 beside the display name, then click Edit.
In the Edit Azure Resource Monitor page under Advanced Configuration, toggle the Auto-create monitor groups option to Yes, and add filters. The Azure monitor group will be automatically created based on the given filter under the Group by Tags option.
Auto-assign Threshold Profile
- Go to Cloud > Azure and click the Azure monitor. Click any of the service types listed in the left panel, then select the desired resource monitor.
- Hover over the hamburger icon beside the display name, then click Edit.
In the Edit Azure Resource Monitor page under Advanced Configuration > Auto-assign Threshold Profile:
- Overwrite Existing Settings: Toggle Yes to overwrite the existing threshold profile settings.
- Configure a Default Threshold Profile for every service supported: Select the threshold profile which you want to overwrite.
- You can also create new threshold profiles by clicking the + icon.
Alerting
You can create new or associate existing threshold profiles for every Azure resource being monitored. Follow the steps below to create a threshold profile:
- Go to the Azure resource monitor you'd like to associate with a threshold profile.
- Hover over the hamburger icon next to the display name. Click Edit.
- Under Advanced Configuration > Threshold and Availability, click the plus icon (+) to create a new profile. Click the pencil icon to edit an existing profile.
- Click Save.
Reports
Go to Reports > Azure. The reports available for Azure monitors are based on the service types available in your Azure account.
- Availability Summary Report
- Performance Report
- Health Trend Report
- Inventory Report
- Server Integration Report
Azure Discovery Report
The Azure Discovery Report provides a consolidated view of all resources in your Azure account, helping you track inventory, growth, and configuration changes for complete cloud visibility.
Guidance Report
Get best practice recommendations to optimize costs and increase performance and reliability of your Azure resources.
Forecasting
Predict future metrics, like Azure resource usage, based on historical observations.
Site24x7 uses machine learning and traditional time series forecasting models like exponential smoothing to predict future values. To choose the right model, the time series data is broken down into systematic and unsystematic components like level, trend, seasonality, and noise. The last 30 days of historical data is used to predict your metric usage in the next 30 days.
To view the forecast charts:
- Go to Cloud > Azure > click the Azure monitor. Click any of the service types listed in the left panel, then select the desired resource monitor.
- Navigate to the Forecast tab to view the charts.
Supported service types: Virtual Machines (VM), Sites, Databases, App Service Plans
Capacity Planning
Optimize your Azure resources and track capacity utilization using metrics such as CPU, memory, and disk utilization with Capacity Planning.
Tags
Tags will help you include or exclude specific resources from monitoring. Every resource can have one or more tags associated with it in the Azure portal. When resources are discovered and added for monitoring in Site24x7, the tags created in the Azure portal are automatically associated with the right resources in the Site24x7 web console.
In addition to these imported tags, you can also create new tags or associate existing Site24x7 Tags with your resource monitors for easy filtering. You also have the option to add resource groups, service types, and subscriptions as tags.
New tags added in the Azure portal will get reflected after 3 hours in the Site24x7 web client.
Azure Resource Monitor page
All your Azure resources will be listed based on their service type. Select any desired service type and then a particular resource monitor. You will find five tabs on the Azure Resource Monitor page:
- Summary: View the performance metrics of your Azure resources and the last polled data of your numeric attributes.
- Configuration Details:
- ID - The unique ID created for each Azure resource
- Name of the resource
- Associated service type
- Location
- Outages
- Inventory
- Log Report
- Server integration report
Azure Deployment Manager (ADM) Health Check
Monitor the health of your services to detect any service health issues and ensure reliable deployments and high availability of your services. Follow the steps below to start the health check:
- Go to Azure > click the Azure monitor > ADM Health Check.
- Select the Subscriptions and Resource Groups for which you want to perform a health check.
- Click Copy to Clipboard to copy the JSON snippet.
- Paste the copied JSON snippet into the health checks part of your ADM rollout JSON file.
Once completed, Site24x7 will begin the health check and verify every step of your Azure deployment(s). If successful, the deployment will move to the next service unit. If any issue is detected, Azure will stop the deployment and let you troubleshoot and reduce the scale of impact.
IT automation
Monitor your Azure resources and schedule IT automation actions when there is a breach in the configured threshold.
Management Actions

Go to Azure > click the Azure monitor > Management Actions. Under these management actions, you can perform bulk actions like deletion, re-addition, and VM actions on your Azure resource monitors. You can group or filter resources based on subscription, resource group, service, and location for better visibility.
- Delete Resources: Use the trash icon
 to delete a single resource. Delete multiple resources at once by using the Delete button at the top-right corner. When you delete a resource, Site24x7 will stop monitoring it, but the resource will not be deleted from your Azure account.
 - Actions specific to VMs: You can Start/Stop VMs and Install the Site24x7 Server Monitoring Agent Extension for every single discovered VM. Use the Bulk Action for VMs button to perform these actions on multiple VMs in one action.
Ensure that you have provided the contributor role for the application used to create the monitor. Also ensure the VM is up and running before installing the Site24x7 Server Monitoring agent extension.
How does data collection (DC) happen?
Site24x7 sends one or more requests for the Azure metric API of each resource and derives the data for each minute. Data collection happens every five minutes. Site24x7 analyzes the data and presents it in user-desired report or dashboard formats. If the user has set thresholds, Site24x7 checks if the derived data corresponds to the configured threshold limit. If there is any breach, an alert will be triggered and the configured remediation action will be initiated.

For resource health check:
Similarly, Site24x7 Azure monitor sends resource health API requests to Azure every three minutes and updates the status of the resources along with the data collection for further diagnosis.
Security
Site24x7 Azure monitoring is done using the OpenID Connect Authentication, a Microsoft-approved workflow. Site24x7 will neither increase the costs incurred in your Azure environment nor will it perform any modifications to the settings in place.
Get to know the security best practices to fortify your Azure accounts.
Licensing
The main Azure account consumes one basic monitor license. Every Azure resource uses up one basic monitor. For example, if you want to monitor an Azure account that has 10 resources, it will be consuming 11 basic monitors. For example:
Main Azure account = 1 basic monitor
10 resources = 10 basic monitors
Total = 11 basic monitors
If you have installed the server monitoring agent extension in your VMs, the VM will consume two basic monitors and the server monitor will consume two basic monitors.
Track and manage the Microsoft Azure billing for your entire organization and optimize your cloud cost with our cloud cost management tool, ManageEngine Cloudspend.
FAQ
How often does Site24x7 sync data from Azure?
Site24x7 polls Azure every 1 minute and collects data for the preceding 5-minute window. The collected data is persisted at the 6th minute. For example, data from 10:00–10:05 is stored at 10:06, giving five data points per cycle. Synchronization is near-real-time, updating every 5 minutes.
What happens in Site24x7 when an Azure resource is deleted?
Site24x7 marks the monitor as Down with the reason "Resource is Removed." No alert is triggered immediately. The status is confirmed across 2 consecutive data collections. If the resource is still not found after both checks, the monitor is suspended or deleted based on your Azure monitor termination settings, and an email notification is sent.
Where can I find the audit trail for a deleted or suspended Azure monitor?
Every suspension or deletion triggered by Azure resource termination is recorded in the Audit Log, with an entry specifying the reason. Audit logs are retained for 1 year and are available for compliance and audit purposes.
What happens to Azure monitoring data if a sync fails or is delayed?
If a data collection fails, it is skipped and no data is stored for that interval. For example, if Site24x7 experiences a delay at 10:00, collection is skipped and the next successful run is at 10:16. Data from 10:05–10:15 is collected and persisted at 10:16. Polls from 10:00–10:04 remain as gaps. For data inconsistency concerns, contact Site24x7 support to request a validation report.
-
On this page
- Prerequisites
- Adding a monitor
- List of services monitored by Site24x7
- Dashboards
- Customizing your Azure monitor
- Azure Uptime monitoring
- Service Quota monitoring
- Logs
- Resource dependencies
- Bulk actions
- Monitor groups
- Auto-assign Threshold Profile
- Alerting
- Reports
- Azure Discovery Report
- Guidance Report
- Forecasting
- Capacity Planning
- Tags
- Azure Resource Monitor page
- Azure Deployment Manager (ADM) Health Check
- IT automation
- Management Actions
- How does Data Collection (DC) happen?
- Security
- Licensing
- FAQ