PostgreSQL Server Monitoring
Track the performance, availability, and health of your PostgreSQL instances and databases by monitoring the key performance indicators including the connections, the number of backend processes, cache hit ratios, rows fetched/returned, deadlocks, transactions, and locks—and get instant alerts whenever there is a breach.
Once the agent is successfully installed, the PostgreSQL server running in the server will be auto-discovered and added for monitoring.
Supported versions
- PostgreSQL versions 10.23 and above
- Linux Site24x7 server monitoring agent version 19.4.0
Prerequisites
You need to create a PostgreSQL user for the Site24x7 agent on each PostgreSQL server. With the following instructions, you can create a user and grant the PostgreSQL user with the permission to log in from the localhost.
CREATE USER <username> WITH ENCRYPTED PASSWORD '<password>';
Example:
CREATE USER site24x7 WITH ENCRYPTED PASSWORD 'Monitoring@123';
The Site24x7 agent needs a few privileges to collect the metrics. You need to provide the PostgreSQL user with the following limited privileges:
GRANT EXECUTE ON FUNCTION pg_ls_waldir TO site24x7;
GRANT pg_read_all_stats TO site24x7;
GRANT pg_read_all_settings TO site24x7;
GRANT CONNECT ON DATABASE <database_name> to site24x7;
Add a PostgreSQL monitor
If there are multiple PostgreSQL instances, repeat the above steps for each PostgreSQL instance. After providing the required permissions, you can proceed to add a PostgreSQL Server Monitor using the following steps:
For Linux
- Install the Site24x7 Linux server monitoring agent on your Linux server.
- Site24x7 server monitoring agent automatically discovers PostgreSQL instances in your servers and adds a sample view of PostgreSQL monitor at the Home tab. To start monitoring, follow the instructions below to authenticate Site24x7 to collect metrics.
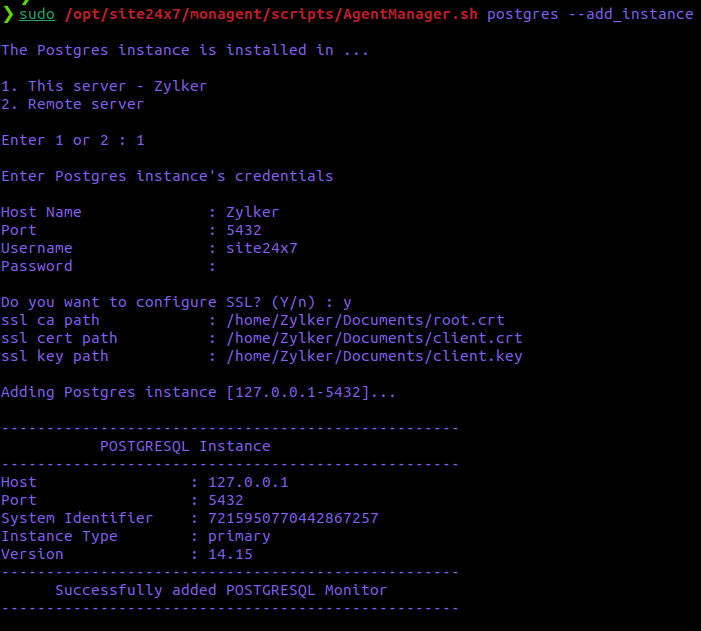
- Execute the following command in your terminal to authenticate and configure PostgreSQL monitoring:
sudo /opt/site24x7/monagent/scripts/AgentManager.sh postgres --add_instance

-
Enter your PostgreSQL instance's user credentials, including the host name, the port of the PostgreSQL instance to be monitored, and the username and password previously created for the Site24x7 agent.
-
If you want to configure SSL, respond with Y. If not, respond with N. Provide the necessary certificates (CA certificate or Client certificates -public and private keys) to establish a secured connection.
NoteSteps 3 and 4 have to be repeated for every PostgreSQL instance in the server. -
After logging in to Site24x7, click Database > PostgreSQL on the navigation pane.
-
You will be directed to the monitor page to view the list of the PostgreSQL instances you have added to monitor.
-
Under the PostgreSQL instance, click Databases to view the list of databases in the selected instance.
- The username and the password you provide will be securely encrypted in the agent and will not be stored in any of the Site24x7 databases.
- If you don't want PostgreSQL to be auto-discovered and added for monitoring, toggle the option Auto discover applications on the server option to No in the Settings page (Admin > Server Monitor > Settings).
- By default, ten databases will be auto-discovered in each PostgreSQL instance.
Performance metrics
Monitoring the key performance metrics of your PostgreSQL instance and your PostgreSQL database is highly crucial. By closely tracking these parameters, you can proactively identify potential bottlenecks, troubleshoot issues, and optimize the overall efficiency of your PostgreSQL environment.
Health Dashboard
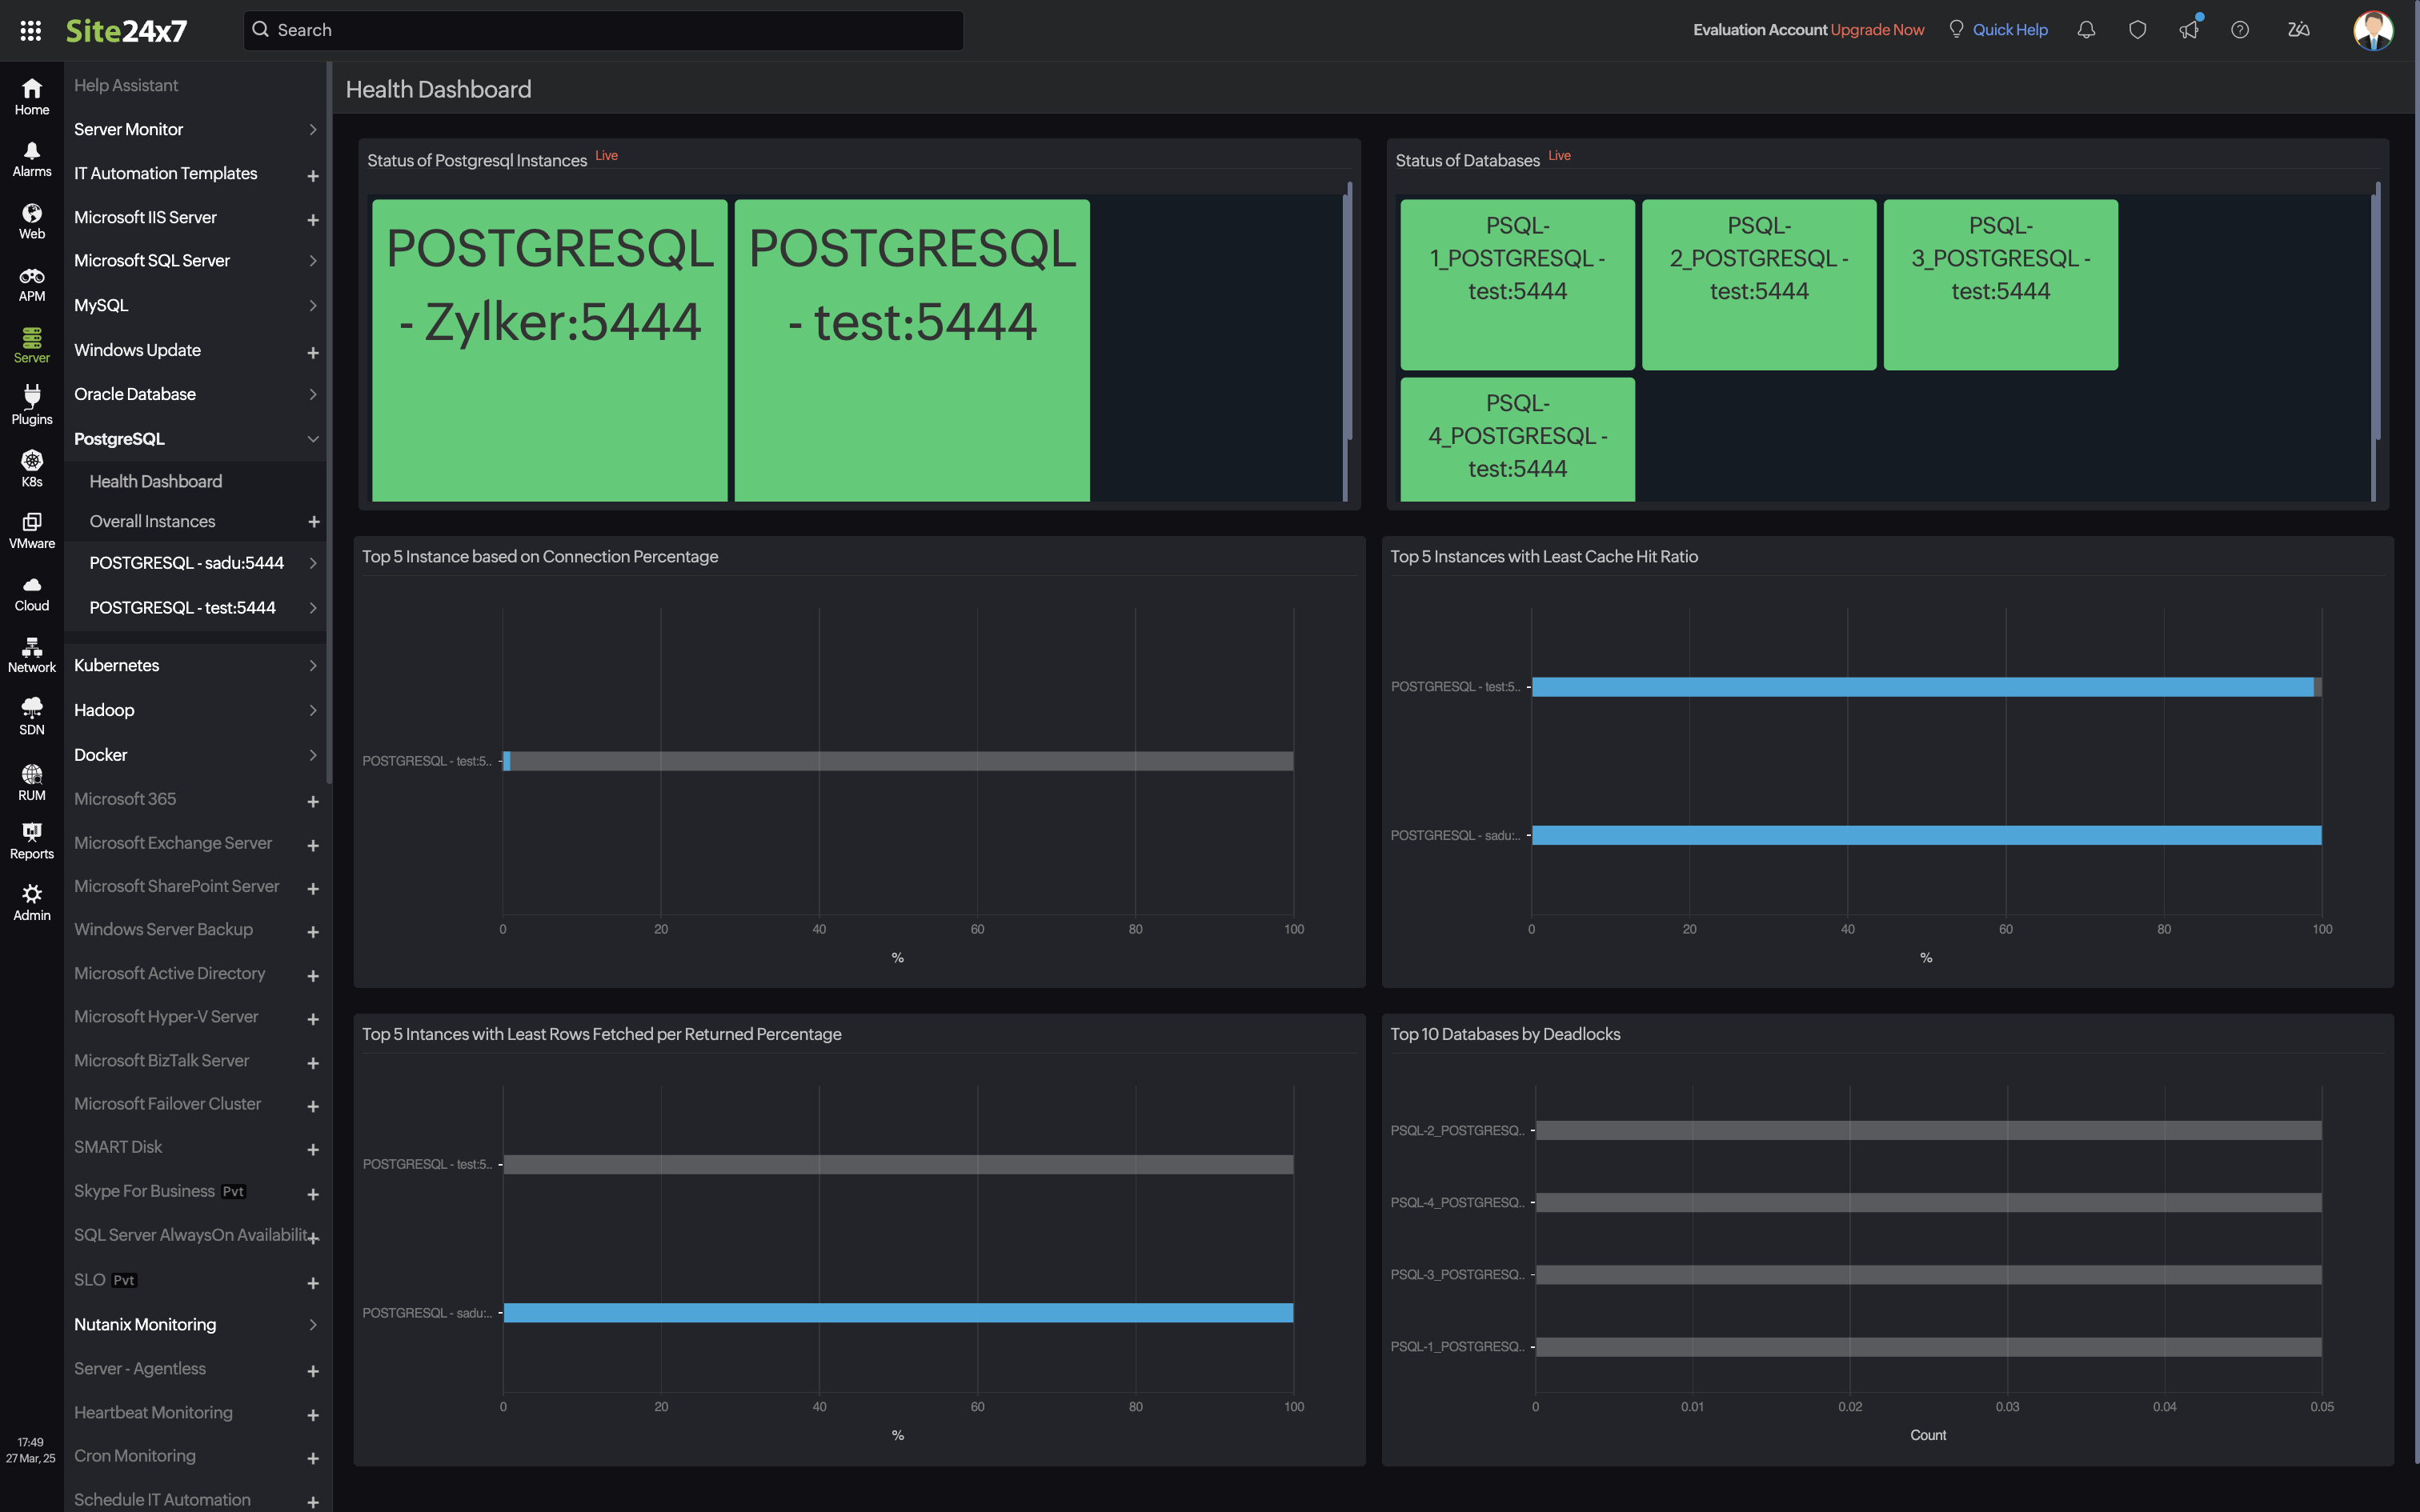
The PostgreSQL Health Dashboard in Site24x7 provides a comprehensive, at-a-glance view of the status and performance of your PostgreSQL instances and databases. It helps you quickly identify performance bottlenecks, resource utilization issues, and database health anomalies.
Key components:
-
Status of PostgreSQL Instances
-
Status of Databases
-
Top 5 Instances Based on Connection Percentage
-
Top 5 Instances with Least Cache Hit Ratio
-
Top 5 Instances with Least Rows Fetched per Returned Percentage
-
Top 10 Databases by Deadlocks

Benefits:
-
Real-time insights into performance and availability
- Consolidated view to get insight across your PostgreSQL instances
-
Quick root cause identification through visual trends
-
Proactive optimization with actionable metrics
Navigate to Databases > PostgreSQL > select the instance > Health Dashboard to access this view.
PostgreSQL individual database monitoring
Site24x7 PostgreSQL individual database monitoring provides in-depth performance monitoring at the individual database level. Gain instant visibility into key performance metrics such as cache hit ratio, database size, rows fetched/returned, transaction specifics, and more to manage and enhance the performance of your PostgreSQL databases.
Threshold configuration
After adding the PostgreSQL monitor to your Site24x7 account, you can add a Threshold and Availability profile to set thresholds and receive alerts when there is a breach.
To set a threshold and availability profile,
- Select the PostgreSQL monitor, click the hamburger
 icon > Edit.
 - In the Edit PostgreSQL page, you will find the Threshold and Availability tab under Configuration Profiles. Click the + icon to add a new threshold profile. Or click the pencil icon to edit a threshold profile.
- Click Save.
You will receive alerts when a particular threshold is breached and the specific resource will be declared trouble or critical.
Reports
View the reports of your PostgreSQL databases by clicking Reports > PostgreSQL > report you want to view.
Licensing
Each PostgreSQL Instance consumes one advanced monitor license and includes monitoring for twenty-five databases. For each additional database, one basic monitor license will be consumed.
FAQs on PostgreSQL monitoring:
The Site24x7 server monitoring agent never stores your data in the Site24x7 app servers. The username and password are encrypted in the agent for security reasons.
Check out some FAQs on the security aspects of our PostgreSQL server monitoring:
- Does Site24x7 need write permission to access databases?
No. - What performance data is collected by Site24x7 for monitoring PostgreSQL servers?
Site24x7 collects data for the performance metrics listed in this document for monitoring PostgreSQL servers. - How do you collect performance metrics for PostgreSQL monitoring?
Performance metrics are collected by connecting to the PostgreSQL server with the user credentials given by the user, which has read-only access. - How do you connect with PostgreSQL server?
Site24x7 connects with the PostgreSQL server with the user credentials given in the terminal console, and collects data. - Do you keep the PostgreSQL connection open?
No. Site24x7 creates a connection to the PostgreSQL server for collecting performance metrics. Once the data collection is complete, the connection created will be closed. - Do you store the PostgreSQL user password directly?
No. Site24x7 encrypts the password given. The username and password are encrypted in the agent for security reasons. They will not be saved or stored in the Site24x7 app servers.
Related content
Database monitoring: Amazon RDS for PostgreSQL and Aurora PostgreSQL | MySQL | MSSQL | MySQL NDB Clusters
Server monitoring: Linux | Windows
