Monitor Google Cloud Platform
Monitoring resources hosted in GCP allows you to check their availability, get a birds-eye view of their health and performance, and better plan resource allocation. Click here to view the complete list of GCP services supported for monitoring.
Benefits of Site24x7's GCP monitoring
- Maintain availability at individual resource levels.
- Use the Guidance Report, inventory reports, and many more reports to optimize resource allocation.
- Leverage instant alerts in case of outages or performance degradation.
Types
How to set up monitoring
- Log in to the Site24x7 portal.
- Click Cloud in the left navigation pane, then click GCP > Add GCP Monitor.
- Provide an appropriate Display Name for the monitor and fill in the Project ID.
- Choose your preferred authentication method:
- In the Filter Resources section:
- Service/Resource Types: Select the Google Cloud resource types you would like to monitor.
- Metric Profile: Select an existing metric profile from the drop-down menu, or create a new profile using the + icon next to this field to select only the metrics for which you would like Site24x7 to make API calls and collect.
- Exclude/Include Resources using Labels/Tags: Enter the tags you have used in Google Cloud so that only the resources with those tags will be included in or excluded from monitoring.
- Auto-discover New Resources: Enabling this field automatically discovers and monitors any new resource created in the Google Cloud console.
- Discovery Interval: Set the frequency at which resource auto-discovery should happen.
- In the Advanced Configuration section:
- Receive Notifications for GCP Service Recommendations:Enable to receive proactive notifications from Site24x7 when Google Cloud provides service optimization or cost-saving recommendations.
- Mark Stopped VM Instances as Maintenance: Enable to automatically categorize stopped virtual machines (VMs) as being in scheduled maintenance. Reduces unnecessary alerts and false positives when a known VM is temporarily shut down.
- Notify for the Exhaustion of Basic Monitor License Units: Enable to get alerted when your usage of Basic Monitor units approaches or reaches the allocation limit.
- Stop Rediscovery if the License Units Have Exhausted: Enable to prevent automatic rediscovery of new resources once license limits are exceeded, avoiding monitoring delays or errors.
- Auto create monitor groups:
- Yes: A monitor group will be created with the name of the project, and all resources in the project will be listed under the monitor group.
- No: A monitor group will not be created.
- Display Server Monitor After Integration:
- Yes: The VM's performance and health metrics will be listed in both the Servers tab and also on the Google Cloud VM's monitor page.
- No: The VM's performance and health metrics will be listed only on the Google Cloud VM's monitor page.
- Sync Display Name from Agent Configuration:
- Yes: The server monitor name will be synchronized with the resource name.
- No: The server monitor name will be synchronized with the VM's hostname.
- Enable Service Quotas:
- Yes: Enables Google Cloud quotas monitoring. Enabling service quotas at the organization level enables quota monitoring for all associated projects.
- No: Disables Google Cloud quotas monitoring.
- Service Quota Metric Profile: Select the GCP service quota metric profile that has the required cloud quotas selected for monitoring.
- In the Resource Termination Settings section:
- Mute Resource Termination Alerts:
- Yes: Mutes all the alerts triggered when a Google Cloud resource terminates.
- No: Alerts will be triggered when a Google Cloud resource terminates.
- Monitor Terminated Resources:
- Yes: When a resource is terminated in the Google Cloud portal, monitoring will continue, but the monitor's status will be displayed as down.
- No: Automatically removes the resources terminated in the Google Cloud portal from monitoring.
- Automatically Remove Terminated Resources:
- Yes: If a resource is terminated in the Google Cloud portal, the respective monitor will be removed after a preset time limit. You can set the time limit in the Remove Terminated Resources After field, and it will be enabled only after setting Yes.
- No: Moves the respective monitors for the resources terminated in the Google Cloud portal to a suspended state, and then they will be deleted. Suspended monitors do not consume monitoring licenses.
- Mute Resource Termination Alerts:
- In the Guidance Report Configuration section:
- Enable all Best Practice Checks and Use Default Baselines
Site24x7's Guidance Report analyzes your GCP account using our best practice recommendation checks and provides insights to reduce costs and improve performance. If you want to enable all checks and use default baselines, keep the toggle at Yes. If you're going to choose the recommendations and configure custom baselines (only applicable for the following checks: VM Instances - Underutilization and VM Instances - Highutilization) toggle the option to No. -
How can I create a new baseline for the VM Instances check?
-
Toggle the Enable all Best Practice Checks and Use Default Baselines option to No. The page should refresh, and a new section listing all the guidance report checks should appear.
- Select VM Instances - Underutilization and VM Instances - Highutilization checks and configure new values for the metrics CPU Usage, Network In, and Network Out.
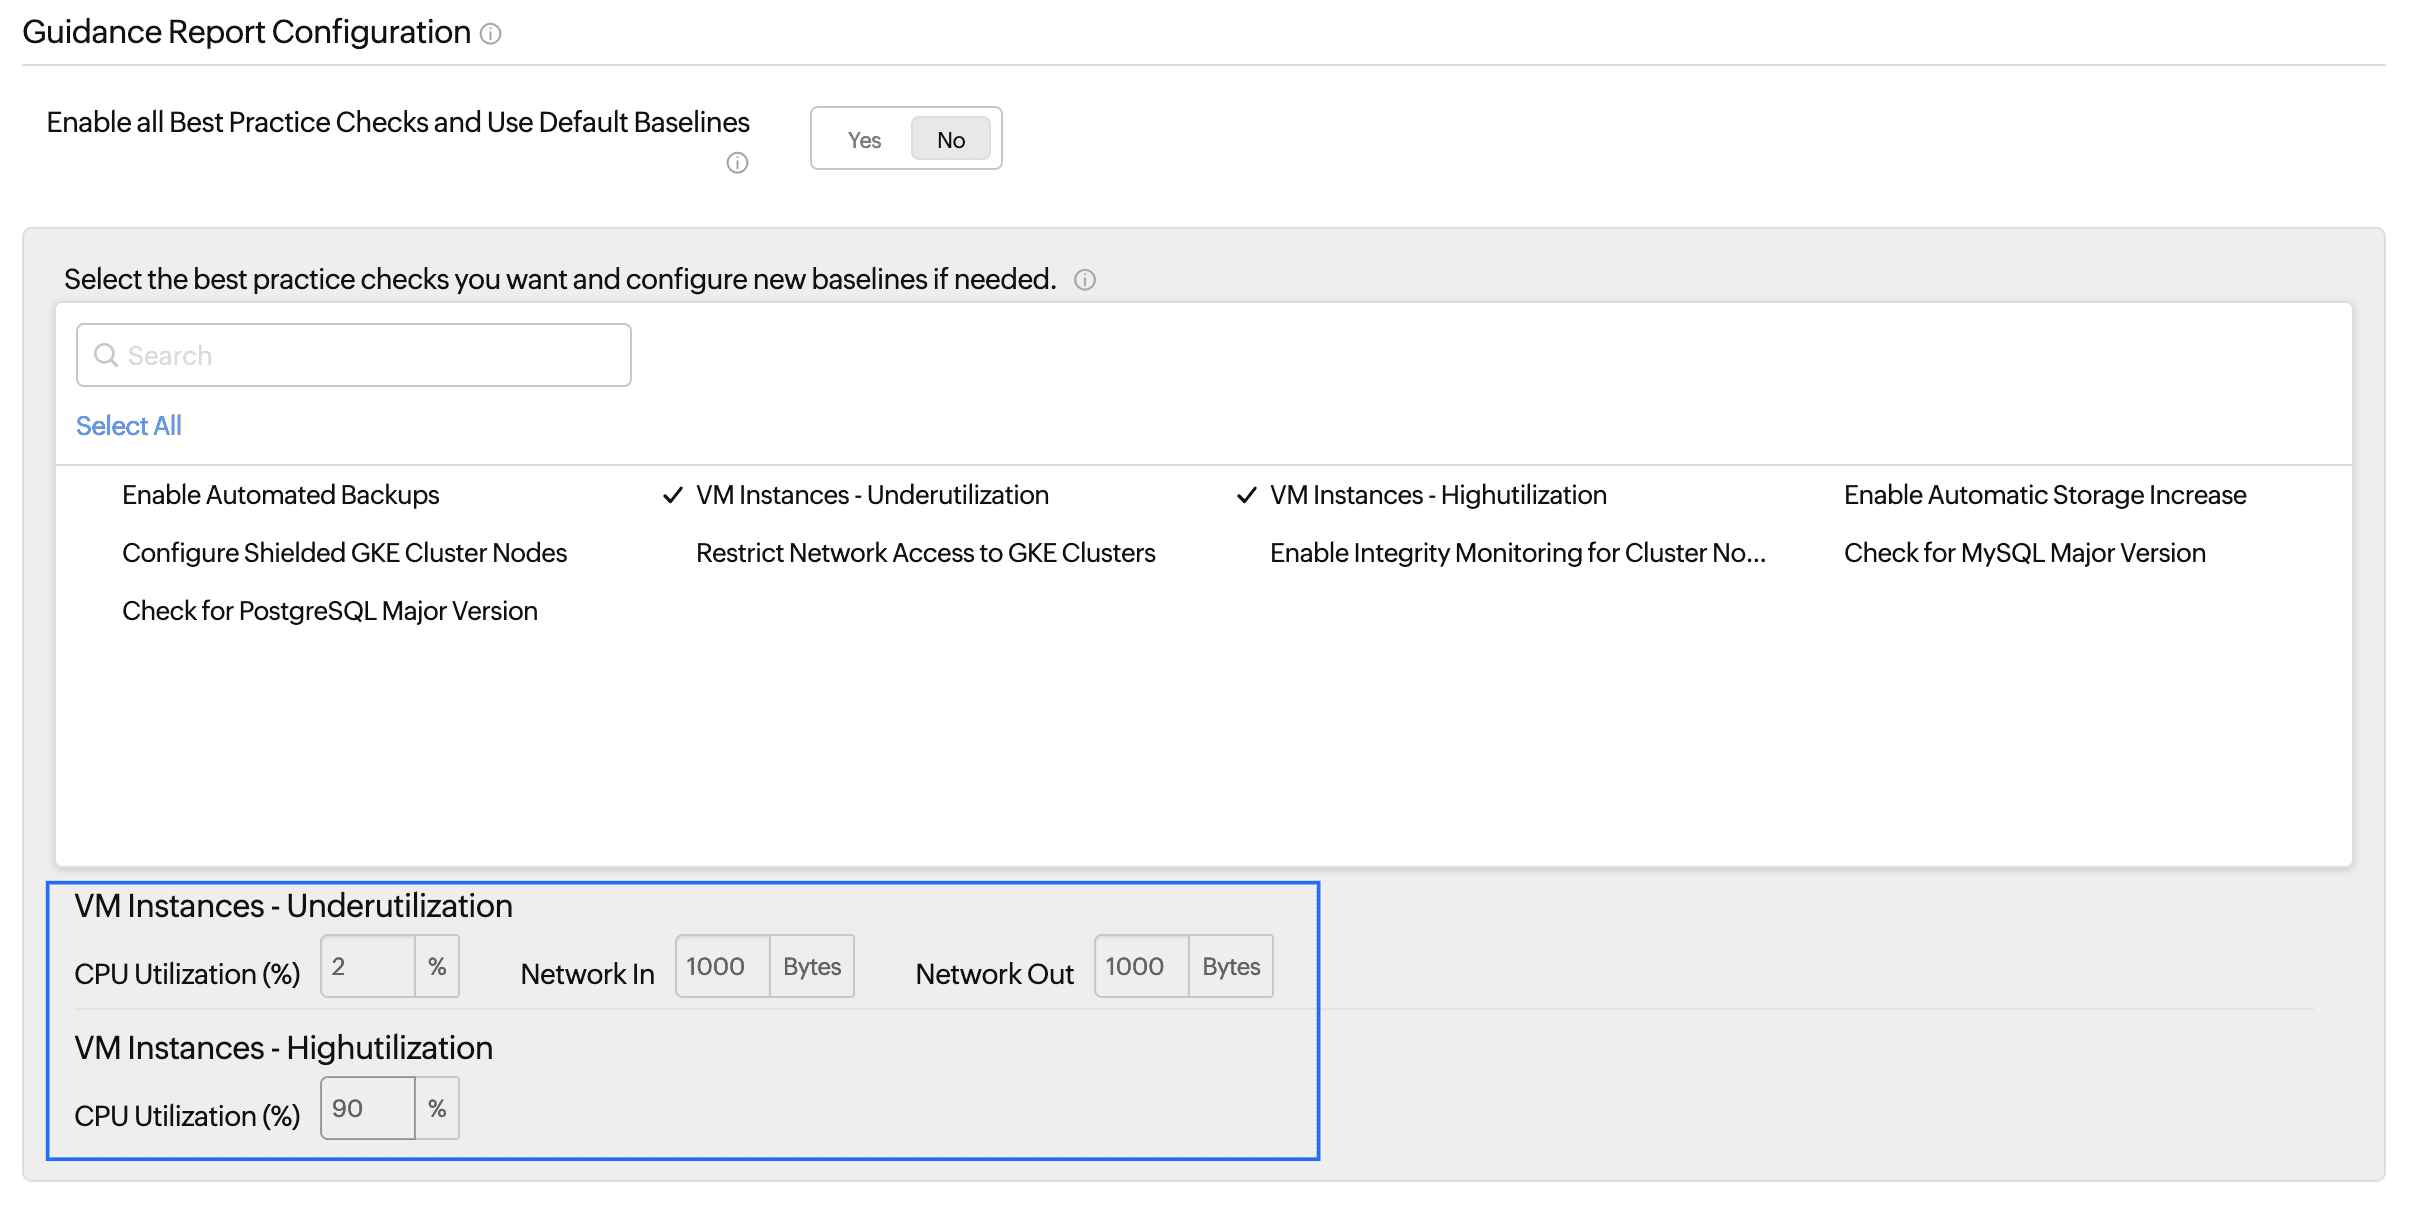
- Click Save.
-
- Enable all Best Practice Checks and Use Default Baselines
- In the Auto-assign Threshold Profile section:
- Go to Cloud > GCP and click the GCP monitor. Click any of the service types listed in the left panel, then select the desired resource monitor.
- Hover over the hamburger icon
 beside the display name, then click Edit.
 - In the Edit GCP Resource Monitor page under Advanced Configuration > Auto-assign Threshold Profile:
- Overwrite Existing Settings: Toggle Yes to overwrite the existing threshold profile settings.
- Configure a Default Threshold Profile for every service supported: Select the threshold profile which you want to overwrite.
- You can also create new threshold profiles by clicking the + icon.
- In the Configuration Profiles section:
- Associate with Monitor Group(s): Select the monitor groups you would like to associate with the monitor you are creating. Use the + icon to create a new monitor group.
- Dependent on Monitor: Select the monitor on which the monitor you are creating is dependent on. For example, if your Google Cloud project monitor is dependent on an organization monitor, when the organization monitor is down, only one alert will be triggered for the organization monitor. The redundant project monitor alert will not be triggered. This is to reduce alert fatigue.
- Tags: Select the tags you would like to associate with the monitor you are creating. Click the Add Tag button to create a new tag.
- IT Automation Templates: Set auto-remediation actions via an IT Automation template to run during outages and performance degradation scenarios in the Select Automation drop-down menu, and also set conditions on when to execute them in the next field.
- Execute IT Automation during Scheduled Maintenance: Check this box to run auto-remediation IT Automation actions, even during scheduled maintenance time frames.
- In the Alert Settings section:
- User Alert Group: Select the user alert group to which you would like to send notifications related to the monitor you are creating.
- On-Call Schedule: Select an On-Call Schedule so that the alerts reach the appropriate person at the appropriate time.
- Notification Profile: Select the required Notification Profile to set how notifications should be sent. Use the + icon to create a new Notification Profile.
- Click Start GCP Monitoring.
Service View
Click Cloud > GCP > the Google Cloud monitor > Service View to view this dashboard. This dashboard is also the page you will view once you have created a new Google Cloud monitor. The Service View dashboard contains all your Google Cloud resource monitors grouped into respective service types.
Infrastructure Dashboard
Click Cloud > GCP > the Google Cloud monitor > Infrastructure Dashboard to view this dashboard. This dashboard presents a NOC view of all the Google Cloud resources discovered in your account. In addition to the NOC view of monitors under each resource type, you can filter your monitors based on service type, location, or status. Hovering over each NOC box will show you the monitor's display name, and clicking it will take you to the respective monitor's page.

Inventory Dashboard
Click Cloud > GCP > the Google Cloud monitor > Inventory Dashboard to view this dashboard. This dashboard gives you the count of Google Cloud resources being monitored as a donut chart, the daily usage of Google Cloud resources based on service type, and a report view of Google Cloud resource monitors under each resource type, with the location, count of resources, and zone details.

Custom Dashboards
Apart from the above three built-in dashboards, you can create your own custom dashboards to view your preferred metrics in your preferred way. To build a custom dashboard, click Home > Dashboards > Custom Dashboards > + Create new. Detailed instructions to create custom dashboards are available in our help document to create custom dashboards.
All Resources
Click Cloud > GCP > the Google Cloud monitor > All Resources to view this page. This page contains the count of monitors based on their status, your license usage, and a list of all monitors. The hamburger icon next to each monitor provides options for each Google Cloud resource monitor, like edit, add to a monitor group, schedule maintenance, suspend, or delete.
Management Actions
Click Cloud > GCP > the Google Cloud monitor > Management Actions to view Management Actions page, which lets you manage your Google Cloud resources from the Site24x7 console.
The Management Actions page lists active and deleted Google Cloud resource monitors. In the Active Resources tab, you can perform actions like starting or stopping VMs. In the Deleted Resources tab, you can re-add deleted monitors.

An Admin or Super Admin level of access is required for your Site24x7 account to perform management actions.
Operations
Click Cloud > GCP > the Google Cloud monitor > Operations to view Operations page. This page lists the actions performed in the Google Cloud console and helps administrators troubleshoot.

The data displayed on this page is fetched using APIs and for the latest 500 actions. Site24x7 does not store this data.
Guidance Report
Click Cloud > GCP > the Google Cloud monitor > Guidance Report to view Site24x7's Google Cloud Guidance Report, which suggests best practices based on your Google Cloud resources. Site24x7 has collected the industry's best practices and framed them as a Guidance Report which, when acted upon, improves your Google Cloud setup's reliability, availability, and cost efficiency. Learn more about this feature in our help document on Guidance Reports.
Enhanced VM Monitoring with server monitoring agent
Default Google Cloud compute instance monitoring provides you the health and performance metrics of the compute instance at the Google Cloud resource level. To get enhanced monitoring capabilities and monitor health and performance metrics like CPU utilization and disk utilization, we recommend installing our server monitoring agent package in your Google Cloud VMs.
To install our lightweight server monitoring agent, follow the instructions provided in the help document for installing the server monitoring agent.
Alerts
Configure when to trigger alerts with a threshold profile. Creating a profile makes it easier to apply this configuration to multiple monitors.
To configure a threshold profile, click Cloud > GCP > the Google Cloud monitor > the hamburger icon beside the Google Cloud resource monitor > Edit.
Use the drop-down menu provided in the Threshold and Availability field in the Configuration Profiles section. If you do not have a threshold profile already, click the + icon beside the field to create a new threshold profile. Learn more about alert settings in our help document for Threshold and Availability.
Capacity Planning
Enable Capacity Planning to assess historical usage trends across your Google Cloud resources. It visualizes metrics like CPU, memory, disk, and network utilization to forecast future needs, helping you make informed scaling decisions. With threshold-based alerts and customizable reports, you can optimize resource allocation and avoid performance bottlenecks. This helps you in making your cloud infrastructure cost-effective and resilient.
Uptime Monitoring for Google Cloud Resources
Site24x7 offers uptime monitoring for select Google Cloud resources, allowing you to focus solely on resource availability without collecting performance metrics. This feature is ideal for businesses that only require availability data and want to reduce cloud costs by minimizing API calls.
With uptime monitoring enabled, Site24x7 will only track the availability status of your Google Cloud resources, displaying this data as Events Timeline and Availability Percentage Trend. Learn more about how to enable this cost-effective monitoring approach in our GCP Uptime Monitoring documentation.
How Site24x7 monitors your Google Cloud resources
Site24x7 sends one or more requests to the Cloud API of each resource and derives data for each minute. Data collection happens every five minutes. Site24x7 analyzes the data and presents it in user-desired reports or dashboard formats. If the user has set thresholds, Site24x7 checks if the derived data corresponds to the configured threshold limit. If there is any breach, an alert will be triggered.
Site24x7's GCP monitoring fetches the access keys from the service account JSON file uploaded by the user in the Site24x7 web client. The private keys in the JSON file are stored in an encrypted format. Performance metrics for GCP monitoring are collected using the GCP Monitor REST API. Learn the permissions that you need to enable GCP monitoring.

License consumption
The parent Google Cloud project monitor consumes one basic monitor license. In addition to that, each Google Cloud resource consumes one basic monitor license. Each Google Cloud VM instance (Compute Engine) consumes two basic monitor licenses.
To understand better, if you have a Google Cloud setup containing three Compute Engines, two Firebase databases, and one Cloud Router, in total, 10 basic monitor licenses will be utilized.
What's next for you?
-
On this page
- Benefits of Site24x7's GCP monitoring
- Types
- How to set up monitoring
- Service View
- Infrastructure Dashboard
- Inventory Dashboard
- Custom Dashboards
- All Resources
- Management Actions
- Operations
- Guidance Reports
- Enhanced VM Monitoring with server monitoring agent
- Alerts
- Capacity Planning
- How Site24x7 monitors your Google Cloud resources
- License consumption
- Uptime Monitoring