Performance metrics for the Synthetic Mobile Application monitor
Site24x7’s Synthetic Mobile Application monitor provides a comprehensive overview of your mobile app's key performance metrics, including Availability, Step Time, Transaction Time, and Downtime. These insights help you quickly identify performance bottlenecks or failures and take timely corrective actions.
This monitor captures the availability and performance of your mobile transactions by allowing you to upload .apk or .aab files. Using an advanced web scripting tool, you can simulate user interactions by creating scripts that mimic real-time user journeys on mobile devices. This enables you to evaluate how an end user would experience your app.
Performance data is presented through intuitive graphical and tabular views, making it easy to interpret and analyze. Metrics are collected from multiple global locations to offer a comprehensive, real-world perspective.
The performance dashboard is categorized into the following tabs:
- Summary
- Outages
- Inventory
- Log Report
- RCA
Summary
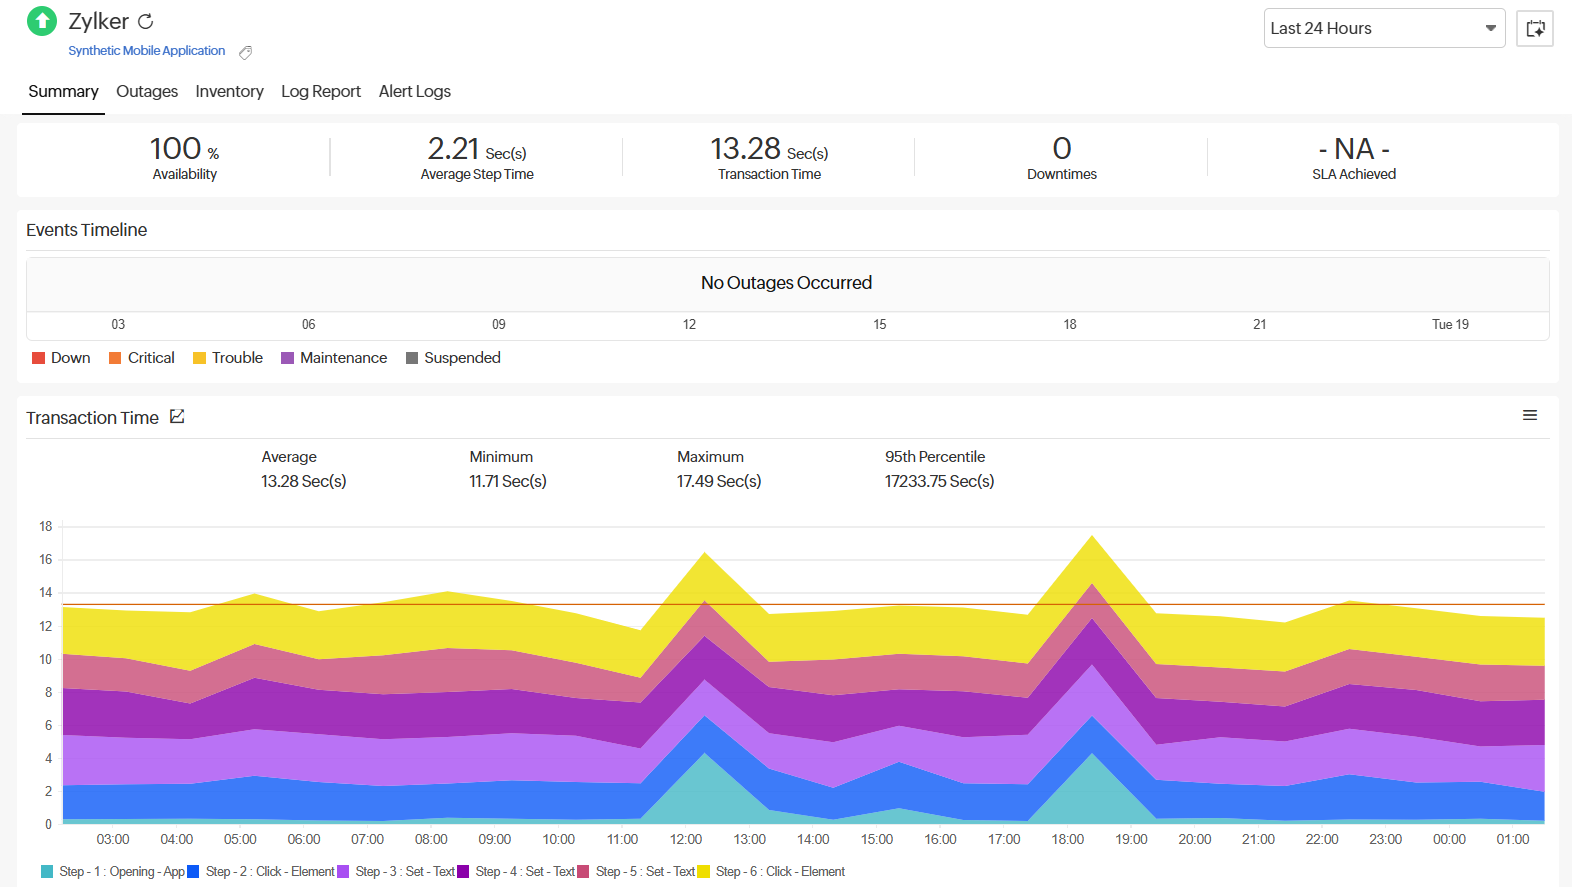
The Summary tab in the Synthetic Mobile Application monitor offers a quick snapshot of your app's availability and key performance metrics over a selected time range, helping you track overall health at a glance.
Overview of metrics
|
Metrics |
Explanation |
|
Availability |
Indicates the percentage of time the application was available. 100% availability means no downtime was detected during the selected period. |
|
Average Step Time |
Represents the average time taken to complete an individual mobile transaction step. |
|
Transaction Time |
The total time taken to complete the entire transaction flow across all steps in the synthetic mobile application. |
|
Downtimes |
Shows the number of recorded times downtime occurred. |
|
SLA Achieved |
Displays whether your monitor met the defined SLA. |
Events Timeline
The Events Timeline widget records all the past events of your selected monitor for a specified time range. You can use this to identify and decode various past events, including those labeled as Down, Critical, Trouble, Maintenance, Suspended, or Anomalies.
Each event is color-coded for easy identification. Events can be drilled down to extract maximum data and facilitate easy troubleshooting. You can also track the actual outage period and the total outage duration during a specific block of time.
If the timeline shows No Outages Occurred, it means the synthetic mobile application remained healthy throughout.

Transaction Time
The Transaction Time graph provides a detailed breakdown of the time taken to complete the entire recorded transaction—from the first step to the last—over the selected time range. The data is presented in milliseconds, with the graph plotting the time of day against the total transaction time.
Each color band in the graph corresponds to a specific step in the transaction, as indicated in the legend below. This helps identify which step contributed most to any spike in response time.
Spikes in the graph may indicate performance bottlenecks in specific steps, which can be investigated further. Additionally, the graph displays the average, minimum, and maximum transaction times for the monitored mobile application.

Transaction Details
The Transaction Details section provides a detailed breakdown of every action performed during the synthetic monitoring of your mobile application. Each step simulates a real user interaction, helping you assess performance across individual actions.
Key metrics
- Status : Indicates whether the transaction was successful, failed, or partially completed.
- Steps Passed : Displays how many steps passed successfully out of the total steps configured in the mobile application.
- Location : The geographical location from where the synthetic check was performed (e.g., New Jersey).
- App Version & Platform : Shows the mobile app version and the device or platform used for testing (e.g., Zylker - 1.3.02 on Pixel 7 Pro).
This section also includes the Steps section, which is useful for identifying the details of individual steps in the mobile transaction. Each row in the table corresponds to a simulated action or interaction (step) in the application:
|
Metrics |
Explanation |
|
Steps |
Displays the name of the step and a brief action summary. |
|
Step Time (ms) |
Time taken to complete the step in milliseconds. Useful for identifying performance bottlenecks. |
|
Action Duration |
A visual representation of how long each step took relative to others in the same transaction. |
|
Page Summary (View Layout XML) |
Allows you to view the XML snapshot of the screen or action at that particular step to aid troubleshooting. |
Response Time (ms) for Steps by Location

This table shows the time (in milliseconds) taken to complete each step in the mobile application transaction from a specific monitoring location. Each row represents an action performed in the app, such as tapping or inputting text.
Geo Map
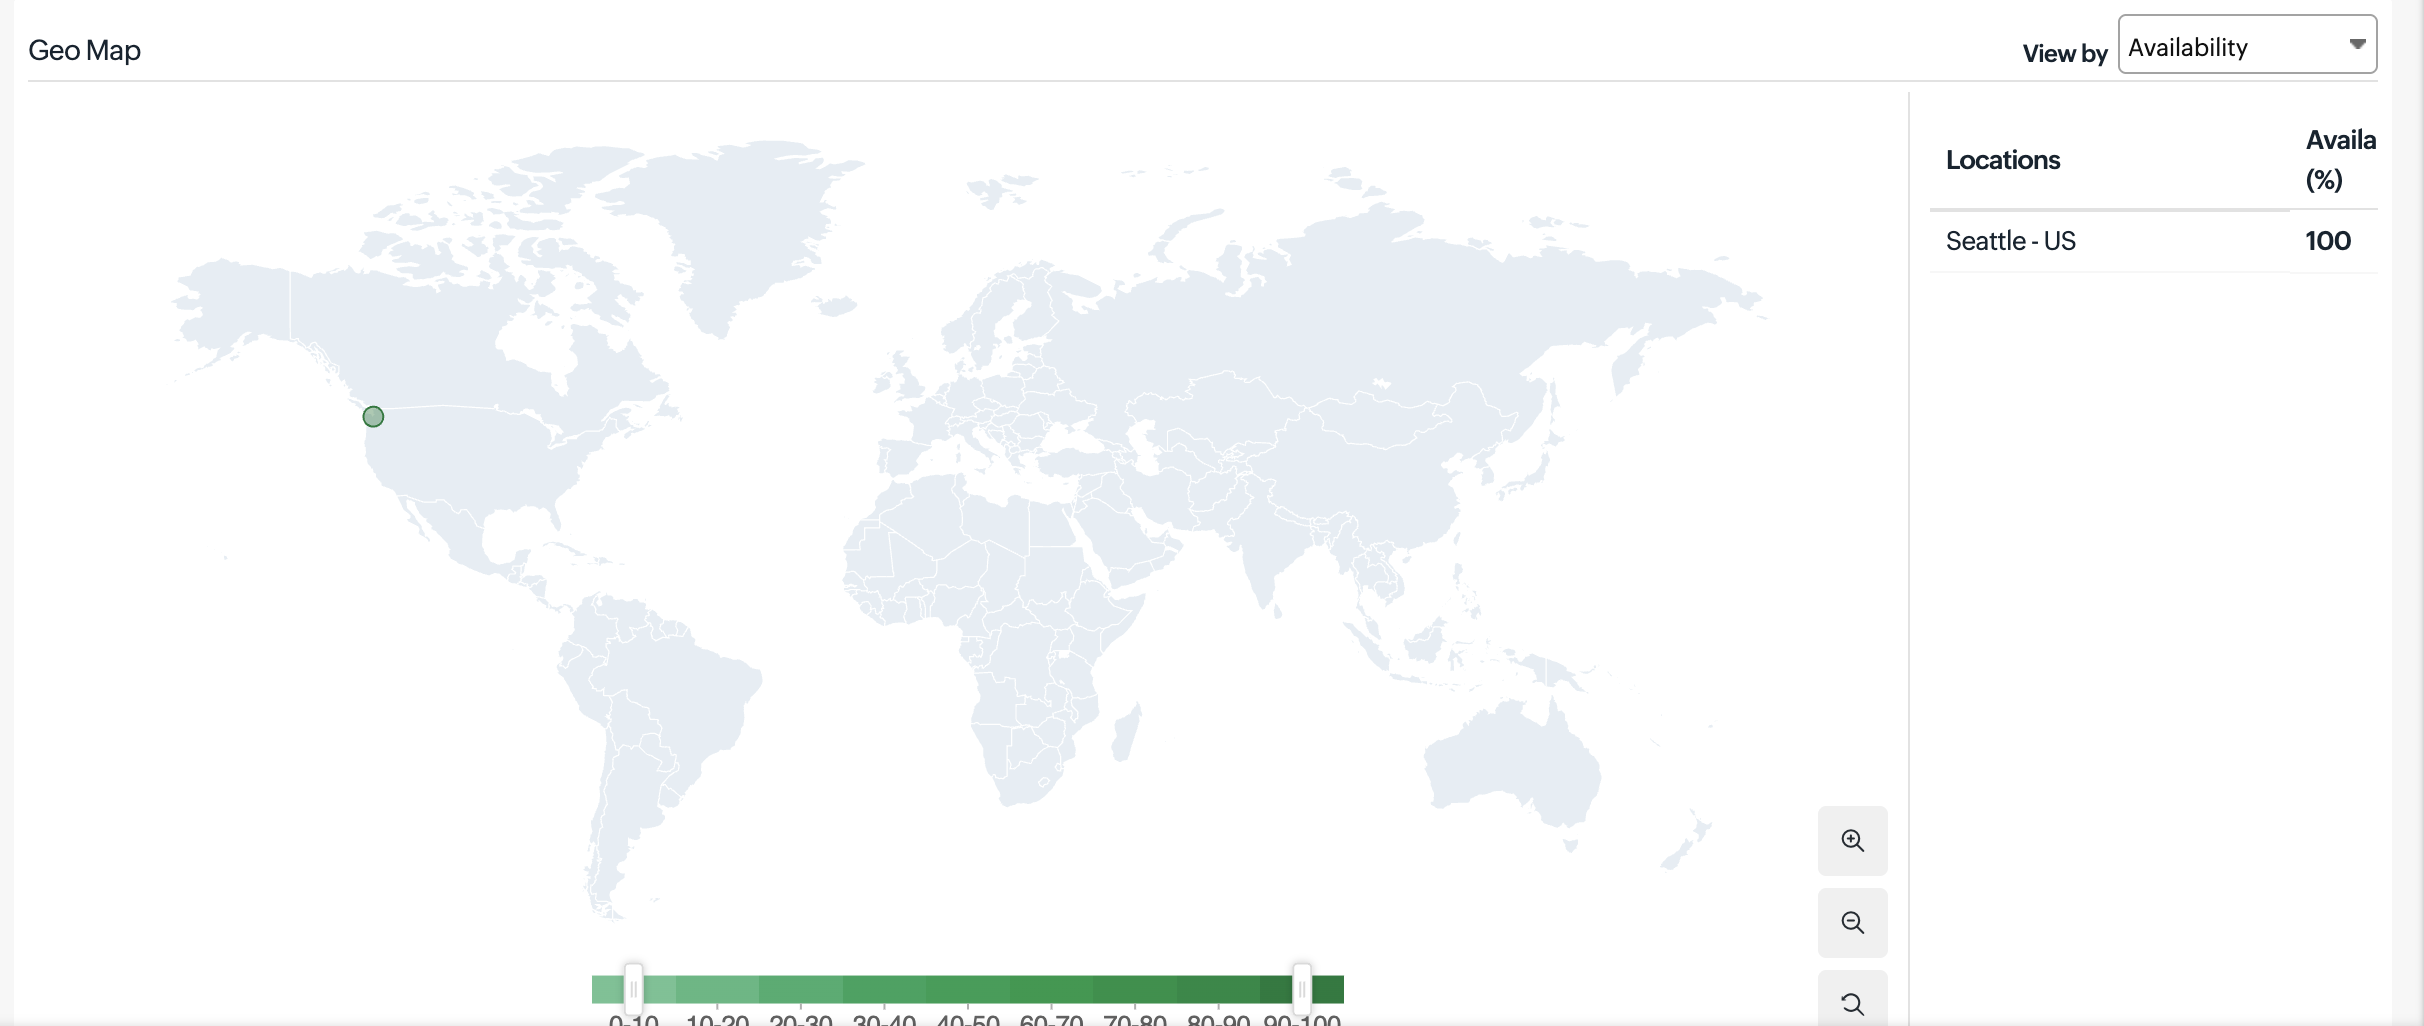
The Geo Map provides a visualization of your mobile application’s global availability and performance using synthetic monitoring from multiple locations. It simulates user interactions on mobile devices to measure app responsiveness across regions. You can hover over different regions to view average response time and other key metrics, helping you understand how your mobile app performs geographically.
With the Geo Map, you can quickly identify regions experiencing slow app performance, app availability, and determine whether issues are localized or widespread. This enables faster detection and resolution of performance bottlenecks in your mobile application, reducing the mean time to detect and repair.
View by metrics
Select a metric to visualize availability and performance across locations. The Geo Map dynamically updates based on the selected metric, allowing you to analyze trends and compare across regions.
- Response Time: Displayed using color gradients (green for faster responses and red for slower). Bubble size increases with higher response time and decreases with faster execution, helping you identify latency-prone regions affecting mobile transactions. Hovering over a location displays a tooltip with details such as monitoring location, average response time, and transaction status.
- Availability (%): Represents the success rate of simulated mobile transactions from each monitoring location. A color gradient (green for high availability, red for low) highlights regions where transactions fail or encounter errors. Hovering over a location displays a tooltip with availability details.
- Current Status: Indicates the real-time status of each monitoring location. The map shows whether the locations are up or down. This view helps you quickly assess the operational state of synthetic mobile checks across all regions.
Updates

This displays recent monitoring service logs and errors. These messages help identify step failures. This is useful for debugging UI-related issues in the app. It also displays the next poll update.
Down/Trouble/Critical History

This section offers detailed insight into your monitor's trouble, down, and critical history. You can view the status, the exact downtime, the duration, and the specific reason for the down status and RCA, which helps you analyze the incident more deeply.
Availability & Response Time by Location
The availability and page load time of the synthetic mobile monitor for every monitoring location is expressed in a tabular format. The total availability percentage and Page Load Time (ms) with the down duration from each monitoring location can be deduced from this data.

Apdex Score
With our RUM integration widget, you can instantly use the Apdex industry standard for measuring the satisfaction of a user using your application or service. You can understand how your applications are performing from your users’ perspective (i.e., “Satisfied,” “Tolerating,” or “Frustrated”).
The Apdex Score is a measure of end-user satisfaction levels and is classified as follows:
- Apdex score > 0.9 means Satisfied.
- Apdex score > 0.5 to <0.9 means Tolerating.
- Apdex score < 0.5 means Frustrated.
You can filter the Apdex score by location either by selecting a location from the drop-down menu or by selecting the appropriate options available for the locations. Additionally, you can filter the Apdex score further based on Response Time, Page Views, and Error. This feature helps you obtain a more accurate score, and it also allows you to export the score to a CSV file.
Global Industry Average
The Global Industry Average serves as a valuable tool for benchmarking performance. This widget allows you to compare your webpage's performance directly with that of your industry peers.
With this performance benchmarking widget, you can quickly view and compare your average response time and service availability against others in your industry across various sectors.
Outages
You can access the Outages tab on your monitor's details page to gather detailed insights on the various outage and maintenance downtime. It provides you with sufficient information to troubleshoot issues.

You'll also be able to access the RCA reports for your various outages. Upon accessing the hamburger icon ![]() of a listed monitor outage or maintenance, you'll be shown the options to:
of a listed monitor outage or maintenance, you'll be shown the options to:
- Mark as Maintenance: Mark an outage as Maintenance .
- Mark as Downtime: Mark maintenance as Downtime .
- Edit Comments: Add or edit comments.
- View XML: View the error response in XML format obtained during a failed content check.
- View Image: View the RCA screenshot for the outage.
- Delete: Delete an outage or maintenance permanently.
Inventory
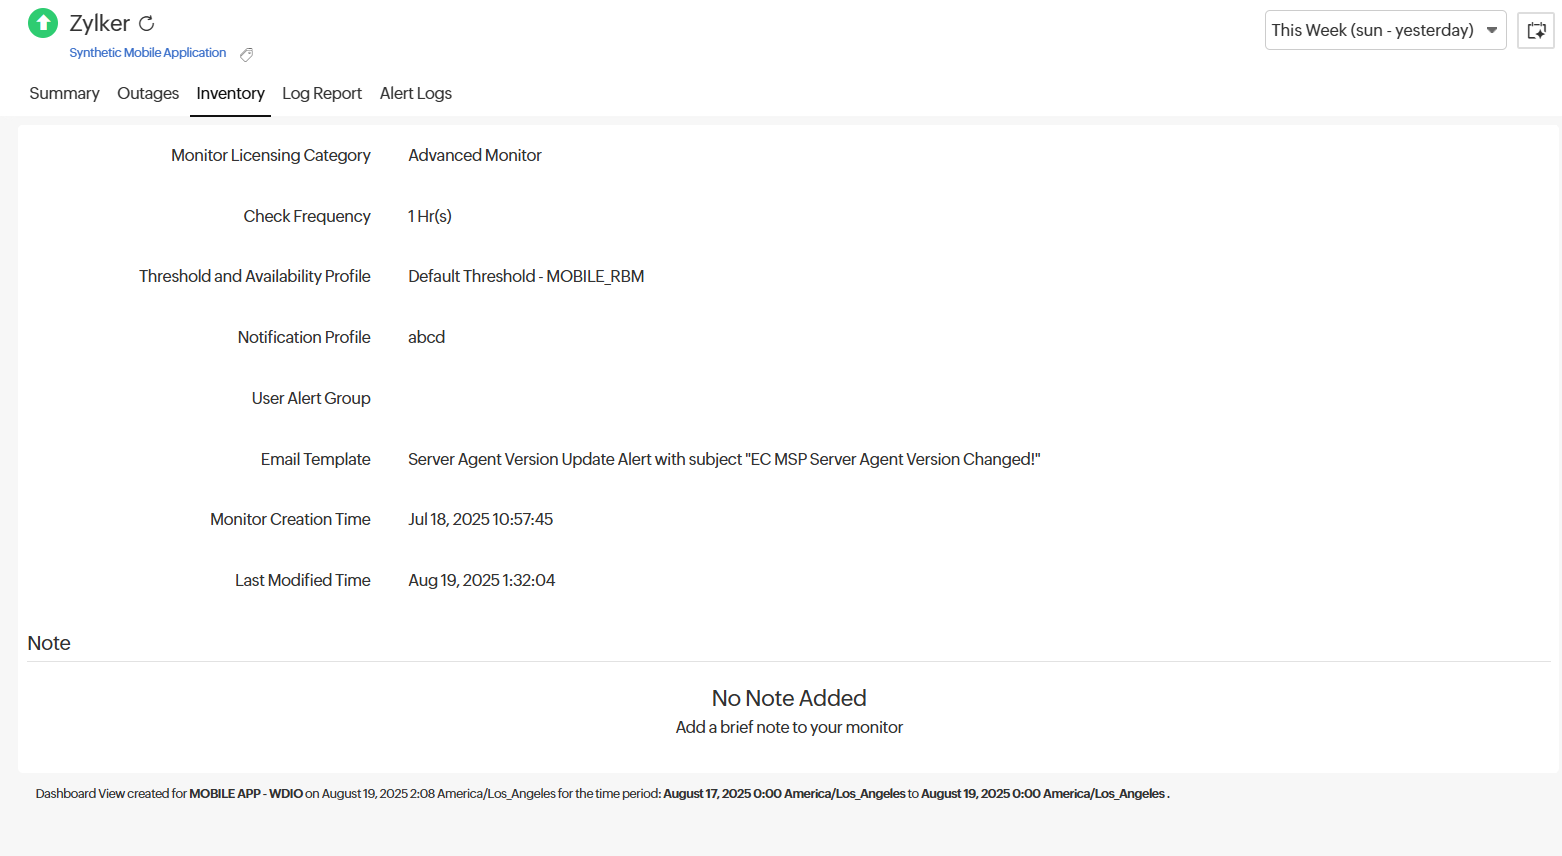
The Inventory section captures the basic monitor information and also its various configuration settings, including polling locations, poll interval, and licensing type.
Log Report
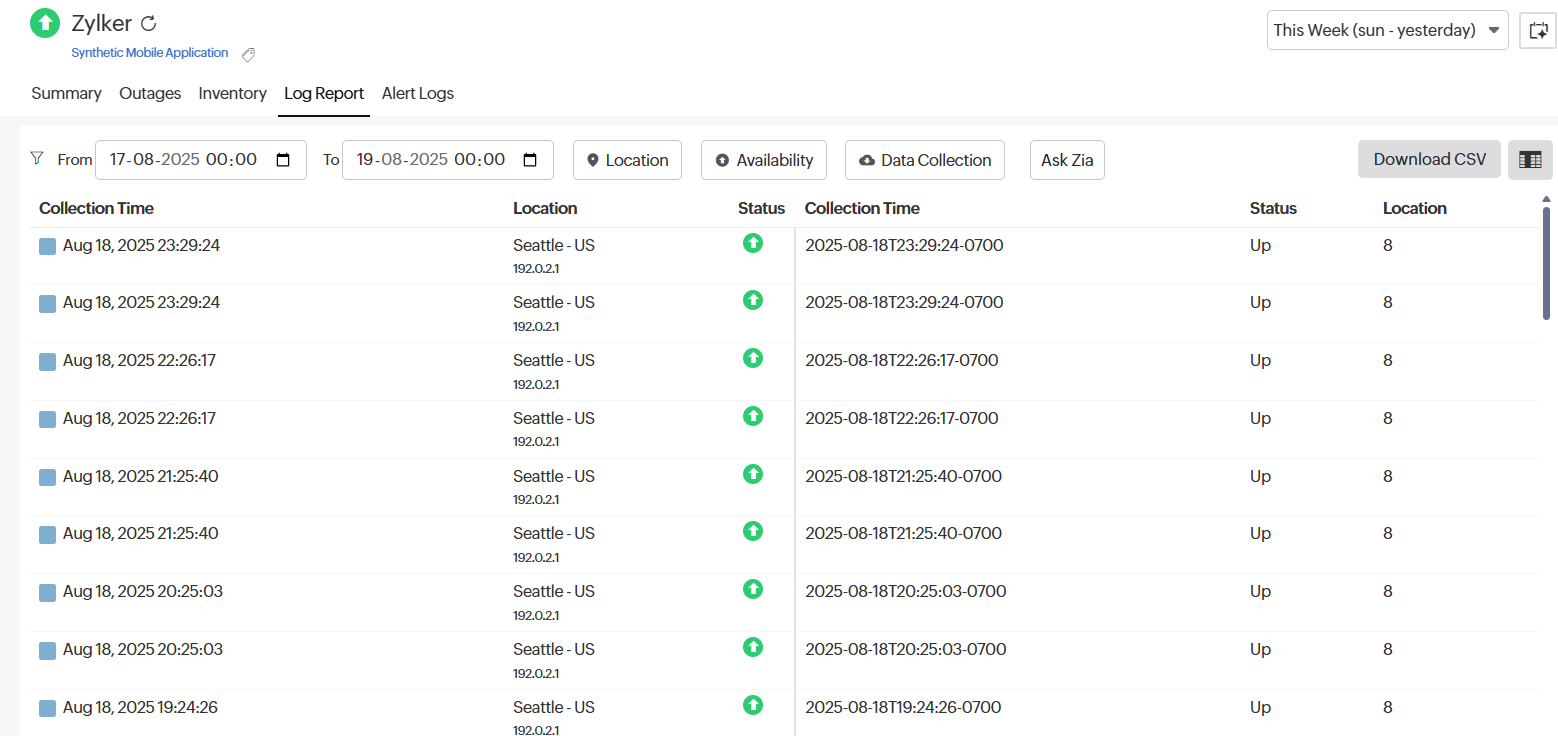
With our integrated log records for individual monitors, you can gain in-depth knowledge about the various log details for the configured monitor over a custom period. You can also filter the log based on location and availability. Various data—including Availability Status, HTTP Status Codes, and DNS Response Time—is captured here. You can also filter and export the columns of the log report in CSV format using the table button and then clicking the Download CSV button.
RCA
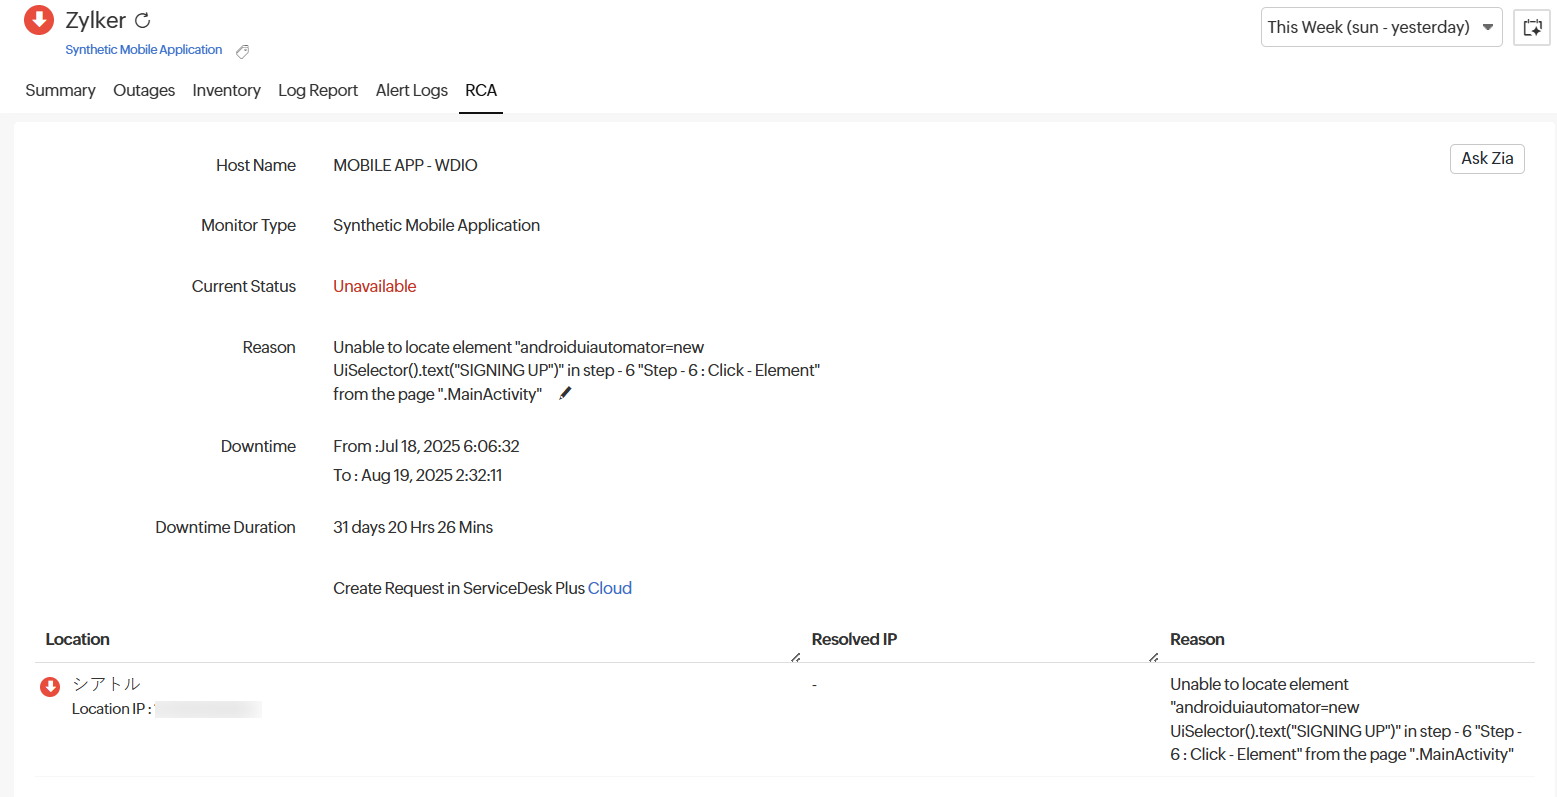
The RCA section provides a comprehensive summary of the reasons behind a transaction failure in a Synthetic Mobile Application monitor. It includes key details such as the monitor name, type, current status, and the exact reason for failure.
An in-depth RCA report becomes available 150 seconds after the monitor reports a downtime. This report includes detailed insights per location, covering the monitor status, collection time, location, total transaction time, and number of steps passed.
Each transaction step is listed along with its corresponding screenshot and execution details. You can also compare the screenshots and XML of your mobile application between a successful and a failed transaction step.
- Screenshot comparison: Compare screenshots captured during successful and failed steps to identify changes in the application visually. Each screenshot is timestamped, helping to pinpoint when an issue began.
- XML comparison: Analyze differences in the app’s XML structure between the up and down states. Added lines are highlighted in green and removed lines in red. Use the Prev Diff and Next Diff options to quickly navigate through changes. This feature significantly simplifies troubleshooting by helping technicians identify and resolve issues without having to debug the entire application.
