Performance Metrics of Web Transaction (Browser)
Interpret Web Transaction (Browser) Metrics
In today's modern IT environment, it is super critical to monitor real end-user interaction and determine if your applications are running optimally. Moreover, it's also important to measure end-user experience from global locations. A Synthetic Monitor captures the availability and performance of your web transactions using an actual web browser like Firefox or Chrome. The feature uses a robust recorder tool to record web interactions and playback the same via real browser (Firefox or Chrome) to check how an end-user would experience it. Site24x7's Web dashboard has a custom status banner, which identifies the various configured monitors by segregating them based on their operational status and state. You can also view the number of operational monitors and alert credits remaining in your account. By clicking the "+ Buy More" button, you can purchase additional monitors and alert credits. Metrics like availability and performance are presented in an easy to understand graphical and tabular layout. Key metrics like Transaction Time, Page Load Time are captured from various locations and graphically interpreted for easy assimilation. You can share the monitor details via an email. Email can be sent to only those verified users who have agreed to receive emails from Site24x7.
Quick Summary and Events Timeline
A quick summary gives you insight into metrics like: Availability, Page Load Time, Transaction Time, Number of Downtimes and Downtime Duration and the SLA status. Events timeline widget records all the past events of your selected monitor for a selected time range. You can identify/decode various events from the past, which includes Down, Critical, Trouble, Maintenance, Suspended, or Anomalies. Each event are color coded for easy identification. Events can be drilled down to extract maximum data and facilitate easy troubleshooting. You can also track the actual outage period and the total outage duration during a specific block of time.

Following results from monitoring checks decide a Web Transaction (Browser)'s operational status:
| Monitor Status | Status Icon | Conditions Affecting Monitor Status |
| UP |  |
|
| TROUBLE |  |
|
| DOWN |  |
|
| CONFIGURATION ERROR |
 |
|
You can gather deep insights on the following performance metrics:
- Transaction Time (ms): It defines the time taken to finish the entire recorded transaction, from the first step to the last step. The transaction time is a combined calculation of the response time and the think time. The Think time acts as a buffer or a wait time before starting the next step of the playback. Think Time is mainly required in steps involving AJAX calls.
- Transaction Time by Location (ms): It indicates the average location based time taken to complete a transaction for your recorded steps. Transaction time metrics of the Web Transaction (Browser) are presented in a graphical format. Average Transaction time and Average Transaction time by Location data are presented in a tabular layout for easy assimilation.
- Page Load Time (ms): It defines the total time taken to load the HTML and all its associated components including JavaScript and images, for an individual step in the transaction. Page Load Time provides the average value for the segmented time period.
- Availability & Page Load Time by Location (ms): It offers a graphical and tabular interpretation of the availability and average location wise page load time data in milliseconds.
Apdex Score
With our RUM integration widget, you can instantly use the Apdex industry standard to measure the satisfaction of a user using your application or service, you can understand how your applications are performing from your users’ perspective, i.e, “Satisfied”, “Tolerating” or “Frustrated”. The time period can be chosen from the History Data for the section.
Apdex Score is a measure of the end user customer satisfaction levels. Apdex Score can be classified as follows:
- Apdex score > 0.9 means Satisfied.
- Apdex score > 0.5 & <0.9 means Tolerating.
- Apdex score < 0.5 means Frustrated.

Transaction Time
The transaction time is a combined calculation of the response time and the think time for each individual steps in a recorded transaction. The think time acts as a buffer or a wait time before starting the next step of the playback. This is mainly required for steps involving AJAX calls, as we need to provide the time for the AJAX call to complete before the start of the next step.
There are two different scenarios to be considered here:
Case 1:
- Let's assume that the Think time is three seconds and Response time is one second. In this case, the transaction will wait for 2 seconds (Think time - Response Time), before starting the next step.
- Let's assume that the Think time is three seconds and Response Time is four seconds; Here the transaction time will be 4 seconds. If the response time exceeds the think time, it will not be included in the calculation of the transaction time.
The Transaction Time graph provides you the entire time data (in milliseconds) taken to finish the entire recorded transaction, from the first step to the last step. The graph is calculated by plotting time period against the total transaction time. You can obtain custom graphs by specifying the granularity as raw, hourly, or daily. Further you can filter out the three point, five point moving averages and also the 95 percentileby selecting the appropriate legends. Percentiles in Site24x7 can be used to find outliers. The 95th percentile is the value which is greater than or equal to 95% of the observed values of your polled data during the selected time range. In other words, 95% of the responses were faster than this value. The graph also lets you zoom in and extract data from the graphical spikes.

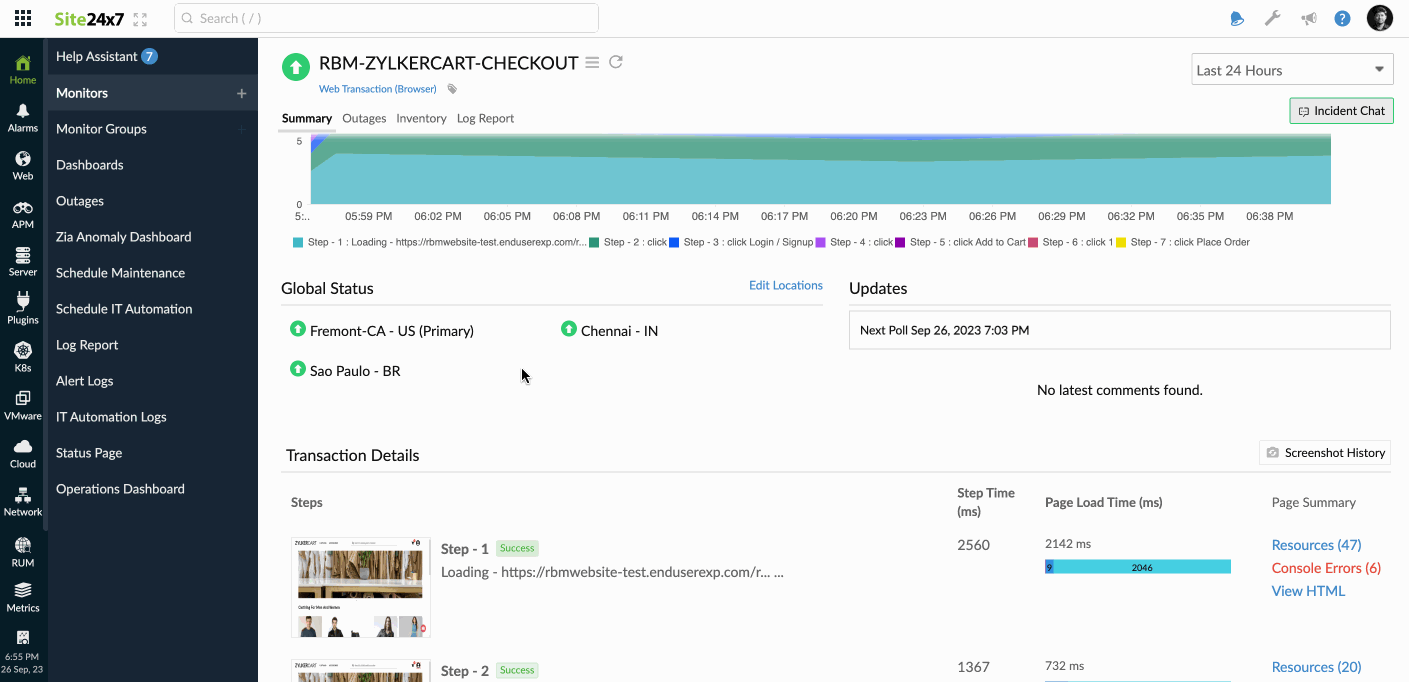
Transaction Details
With transaction details you can analyze the performance of your site with the help of detailed options like screenshots of each step, step time, page load time, the step name, resource-level waterfall chart for each page, and console errors that were raised in each step. Screenshots can be used to analyze how each step has performed and how the website has loaded. Step time helps you analyze the time taken for page load and the time taken by the actions involved in specific steps. Page load time helps to analyze the time taken by each page in the transaction.
Waterfall Chart
Webpage resource-level waterfall charts are valuable tools for helping customers understand performance issues by providing a visual representation of how a web page loads and the resources involved in the process.
The waterfall chart for Web Transaction (Browser) is available for the following plans: Enterprise Plus Web, Enterprise, MSP, MSP 2024, and Enterprise 2024.
You can view the waterfall chart by clicking on the Resources link. waterfall chart helps to analyse the performance of each component on a page. The waterfall chart provides the following information:
- Page Resources Summary
- Unsecure Links
- CDN Hits
- DNS Time
- Connection Time
- First Byte Time
- Start Render
- Document Complete
- Page Load Time
- Webpage Summary
- No. of Requests
- Total Objects
- Images
- Java Scripts
- CSS
- Total Page Size
- Content breakdown by requests: How many requests were raised for each resource
- Content breakdown by size: Split-up of resources based on the size
- Name of the resource
- Status Code
- HTTP Version
- Size of the Resource
- Time to Load the Resource
- Domain Summary
- Domain
- IP Address
- No. of Requests
- Page Load by Location
- Down/Trouble History
Start Time to End Time
Transaction Time by Location
This graph provides the average and 95th percentile transaction time data for each day or hour from every monitoring location. This graph can be used to analyze the average and 95th percentile transaction time of your monitor from different monitoring locations. The location specific transaction time can also be filtered out using the legends, which act as a manual filter for easy administration.

Average Transaction Time by Location
The average and 95th percentile values of the overall transaction time can be segmented based on your monitoring location and chosen time period. This data is provided to you in a tabular layout.

Current Screenshots of Steps and Step Details
It renders the most recent screenshots of all the steps captured during the transaction.
You can browse through the different steps by clicking the counters below. On the immediate right, against the screenshots screen shows you the corresponding Step Name, URL and the Page Load Time for that particular URL. Clicking on Screenshot History will take you to the HTML response data collected from California location.
Page Load Time
The actual page load time of a website transaction takes into account the entire page load time of an individual step in the transaction, inclusive of the HTML content, along with the images and other components. It takes into account the load time, mouse hover actions, button clicks for each individual step. The Page Load Time metrics is graphically displayed by defining the average and 95th percentile values taken for the configured page to load during monitoring for the selected time period. Location wise page load time data is also captured and represented in a tabular and graphical format.

Page Load Time by Location
The Page Load Time by Location graph offers a quick overview into the overall page load time of steps in a website transaction against the selected time period. You can gather an average and 95th percentile value of the data from your various monitoring locations. The location specific page load time can be filtered out using location legends. It acts as a manual filter for easy administration.

Page Load Time by Location - Tabular Data
The average and 95th percentile page load times of individual steps in a transaction can be segmented based on location and time period. This data is provided to you in a tabular data.

Geo Map
The Geo Map provides a visualization of your web transaction’s global availability and performance by consolidating data from synthetic (browser-based) monitoring and RUM sources. It tracks multi-step user journeys executed through a browser and combines them with actual user interaction data. You can hover over different regions to view average transaction time and other key metrics, helping you understand how end users experience your workflows across geographies.
With the Geo Map, you can quickly identify regions experiencing slow transaction execution, detect failures in specific steps, and correlate synthetic transaction data with real-user behavior. This helps determine whether issues are localized or widespread, enabling faster detection and resolution of performance bottlenecks.

View by metrics
Select a metric to visualize availability and performance across locations. The Geo Map dynamically updates based on the selected metric, allowing you to analyze trends and compare synthetic and real-user experiences.
- Response Time: Displayed using color gradients (green for faster execution and red for slower). Bubble size increases with higher transaction time and decreases with faster execution, helping you identify regions with performance degradation.
- Synthetic: Shows transaction time captured using browser-based monitoring from configured locations.
- RUM: Displays transaction time as a heat map at the country level based on real user interactions.
Hovering over a location displays a tooltip with average transaction time, availability, page views (for RUM), and additional performance metrics.
- Availability (%): Represents the success rate of web transaction executions from each monitoring location. A color gradient (green for high availability, red for low) highlights regions where transaction steps fail or encounter errors. Hovering over a location displays a tooltip with availability details.
- Current Status: Indicates the real-time status of each monitoring location. The map shows whether the locations are up or down. This view helps you quickly assess the operational state of web transaction checks across all regions.
Down/ Trouble History
It offers detailed insight into the trouble/down history of your monitor. You can view the status, the exact downtime, duration, and specific reason for the down status.

Availability & Response Time by Location
The availability and page load time of the Web Transaction (Browser) for each and every monitoring location is expressed in a tabular format. The total availability percentage and Page Load Time (ms) with down duration from each monitoring location can be deduced from this data.

Performance Benchmarking
The benchmarks widget is now integrated with-in the client; thus, helping you compare your website performance with industry peers. With our performance benchmarking widget, you can instantly view and compare your average response time and availability of your service with respect to your industrial peers. This can be viewed across various industrial verticals.

Outages
You can access the Outages tab in your monitor's details page to gather detailed insights on the various outage and maintenance downtimes. It provides you with sufficient information to troubleshoot issues. You'll also be able to access the root cause analysis reports for your various outages. On accessing the ![]() icon of a listed monitor outage or maintenance, you'll be shown the options to:
icon of a listed monitor outage or maintenance, you'll be shown the options to:
- Mark as Maintenance: Mark an outage as Maintenance
- Mark as Downtime: Mark a Maintenance as Downtime
- Edit Comments: Add/Edit Comments
- View HTML: View the error response in HTML format obtained during a failed content check
- View Image: View the RCA screenshot for the outage
- Delete: Delete an Outage/Maintenance permanently

Root Cause Analysis (RCA) Report:
You can retrieve indepth root cause analysis report for your DOWN monitors after 150 seconds of the monitor reporting the outage. RCA Report gives basic details about your monitor, outage details, recheck details and reasons for the outage. Root Cause Analysis automatically generates a plethora of information to arrive at a definite conclusion as to what triggered a downtime. RCA intends to determine the root cause of specific downtime or performance issue. A normal RCA report will comprise of the following details:
- Checks from Primary location and re-checks from Secondary location.
- Resource-level Waterfall Chart
- Console Errors
- Video: A video that helps to analyze the steps and issues that are arising.
- Compare screenshot, HTML and resources
- APM Traces
- Ping Analysis
- DNS Analysis
- TCP Traceroute
- MTR Report
- MTR based Network Route
- Conclusion
Compare screenshot, HTML and resources
You can use this option to check the difference between screenshots, HTML, and resources in the RCA report. The old responses will be on the left, and the new ones will be on the right.
This feature is helpful for identifying any changes in the web application. For example, if your company uses an application and an update makes it inaccessible to users, this feature can help pinpoint where the issue is occurring, and you can allocate developers to fix it promptly rather than having to debug the entire application.
- Screenshot comparison: This feature allows you to compare a screenshot taken when the monitor transaction step was up with a screenshot from when the monitor transaction step was down. It also provides the date and time of each screenshot. Comparing the screenshots will help you identify any differences.

- HTML comparison: This option lets you compare the HTML code of the application or webpage from when it was up recently to when it was down to analyze any change. Added lines are highlighted in green, while removed lines are highlighted in red. You can use the Prev Diff and Next Diff functions to move between the differences in the HTML. This makes it easier to spot variances in the HTML content.

- Resource comparison: Compare the resources of the down page with the recent resources of the up page.

This feature lists all the resources that differ from the current down page along with the URL's last uptime. It presents error codes and the corresponding resources in a tabular format, including URL, Protocol, Response Code, Response Time (ms), and Size (KB).
Clicking the View link provides a Header Comparison, which offers comparison information such as previous up and current down values for the selected resource, aiding users in understanding the underlying issue.

APM Traces
APM Traces will be available only if the website application is also monitored by Site24x7's application performance monitoring (APM) using the same Site24x7 account. With seamless APM integration, trace data can be obtained for each step in the transaction. Learn more about APM Traces.
Attribute Report
Gather deeper insights into your page load time; break down a page’s load time by the exact loading processes, i.e., from average DNS lookup to average First byte time.

Inventory
This section captures the basic monitor information and also its various configuration settings including polling locations, poll interval, licensing type, and more.

Log Report
With our integrated log records for individual monitors, you can get an indepth knowledge about the various log details for the configured monitor, over a custom period. You can also filter the log based on location and availability. Various data including availability status, HTTP status codes, DNS response time etc. are captured here. You can also export the log report in CSV format.
Clicking the desired row in the Log Report will take you to the Collection Summary.
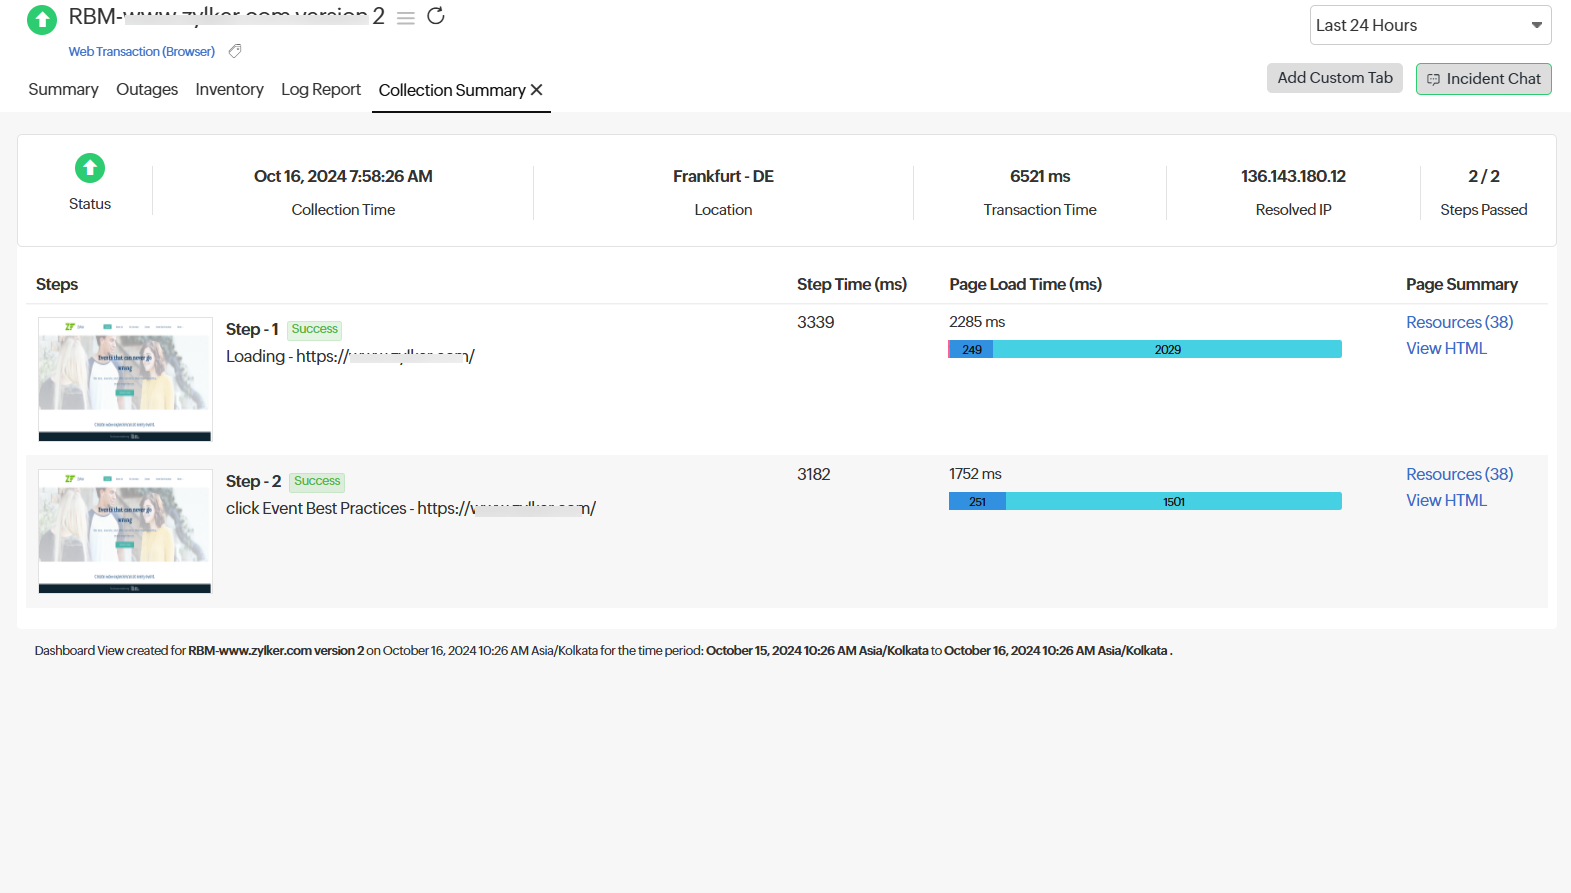
Collection Summary
This report provides an overview of the metrics and data collected over a specific period. The Collection Summary report provides a detailed summary of the transaction based on a particular location's status and time. It includes the Status, Collection Time, Location, Transaction Time, Resolved IP, and Steps Passed.
Additionally, this report displays the step details of your transaction, which helps the users identify trends and potential issues. This report displays the screenshots for each step, along with the Step Time and Page Load Time. The Page Summary includes details such as the Waterfall chart, HTML, and Console Errors.
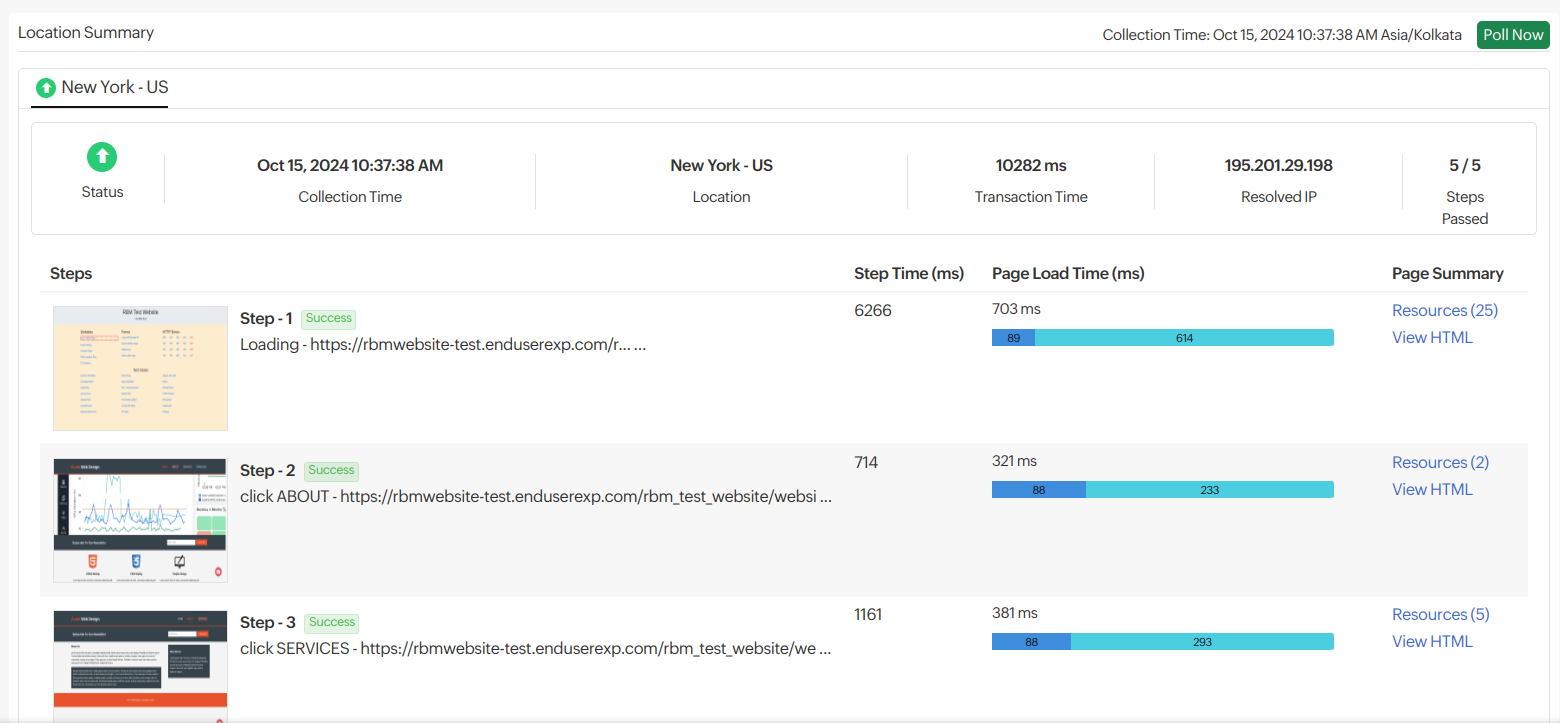
Poll Now Report
A Poll Now Report is an on-demand check initiated by a user to instantly assess the current-status of a monitored resource, such as a website or an application.
You can initiate the polling from the Monitor Details page. Click on the hamburger icon and select the Poll Now option to generate the Poll Now report. Next, choose the desired primary and secondary location for polling and click on the Poll Now button.
The report includes specifics like the Location Summary for the selected poll location. It displays the Status, Collection Time, Location, Transaction Time, Resolved IP, and Steps Passed. The step screenshot with the page summary provides details like the Resources (Waterfall Chart), HTML, and Console Errors.
The Poll Now Report is valid for 24 hours from the time you initiate a manual poll. This report is helpful for immediate troubleshooting or verifying the current-status after an alert. Learn more about Poll Now Report.
Learn more: Set up a Web Transaction (Browser) Monitor | Web Transaction (Browser) - Selenium WebDriver
Here's all you need to know about synthetic monitoring.
-
On this page
- Quick Summary and Events Timeline
- Apdex Score
- Transaction Time
- Transaction Details
- Waterfall Chart
- Transaction Time by Location
- Page Load Time
- Page Load Time by Location
- Geo Map
- Down/ Trouble History
- Performance Benchmarking
- Outages
- Downtime Root Cause Analysis (RCA)
- Attribute Report
- Inventory
- Log Reports
- Poll Now Report