Performance metrics of website monitor
Interpret website monitoring results
Navigate to Web and click the desired website monitor to view the corresponding monitoring details. The main dashboard has a custom status banner, which identifies the various configured monitors by segregating them based on their operational status and state. You can also view the number of operational monitors and alert credits remaining in your account. By clicking the + Buy More button, you can purchase additional monitors and alert credits. This page has different graphs, charts and tables that help you to do a comprehensive analysis of your website performance. Additionally, you can also initiate a Poll Now from this control panel and retrieve Poll Now report to gather quick insights on SSL handshake, header information and traceroute details.
The main result page is divided into two sections; Response Time which shows response time metrics of your website in a graphical format and Availability & Response Time by Location, which gives a tabular view of location wise availability and other related metrics. You can share the monitor details via an email. Email can be sent to only those verified users who have agreed to receive emails from Site24x7.

Events Timeline
Events timeline widget records all the past events of your selected monitor for a selected time range. You can identify/decode various events from the past, which includes Down, Critical, Trouble, Maintenance, Suspended, or Anomalies. Each event are color coded for easy identification. Events can be drilled down to extract maximum data and facilitate easy troubleshooting. You can also track the actual outage period and the total outage duration during a specific block of time.

Response Time
Response time of a URL monitor is calculated as the sum of DNS lookup time, connection time, SSL Handshake time and the time taken to download the entire HTML content of the web server. The response time of your website monitor across all the monitoring locations for the chosen time period is calculated and shown using a normal line graph. Maximum, minimum, average, and 95th percentile response time can be gauged from this graph. Average and 95th percentile depends on the time period chosen for the monitoring.
Percentiles in Site24x7 can be used to find outliers. The 95th percentile is the value which is greater than or equal to 95% of the observed values of your polled data during the selected time range. In other words, 95% of the responses were faster than this value.
Graphical View
Response Time Graph
The details can be read using the legend given below graph. To learn about all the calculations, read this article. Each of the legend terms as well as their usability is explained below.
- DNS Time: The DNS Time is the time taken to resolve the domain name for the request. A spike in DNS Time indicates the increase in the time to resolve the domain.
- Connection Time: The connection time is considered as the time taken by the client to establish TCP connection with the IP address of the domain. More time to establish a connection may be due to factors such as server overloading, which can be identified and addressed before it affects end-users.
- First Byte Time: The First Byte time is the time from when the connection to the server established until the first response starts coming in for the base page. This is actually the server response time plus network latency time. A spike in First Byte Time in your graph indicates a delay in the processing of the server request.
- SSL Handshake Time: The time taken to negotiate an SSL handshake after the TCP connection has been established successfully.
- Download Time: The difference between the last byte time and the first byte time is the download time that depends on the size of the content and the speed of the server.
- Time Graph: indicates an extra amount of content transfer that may be happening during the request or due to low bandwidth available for content transfer.
Geo Map
The Geo Map provides an interactive visualization of your website's global availability and performance by consolidating data from Synthetic and Real User Monitoring (RUM) sources. You can hover over different regions to view response time and other key metrics. This unified view helps you understand both simulated (synthetic) data and actual user experiences (RUM) data across various regions.
With the Geo Map, you can instantly identify slow-performing locations, correlate data obtained through synthetic monitoring with the real-user data from RUM monitoring, and determine whether issues are region-specific or widespread. As a result, it significantly reduces the MTTD and MTTR for regional performance issues.

View by metrics
- Response Time: Visualized using color gradients (e.g., green for fast to red for slow). In the case of synthetics, bubble size in the geo map increases with higher response times and decreases with lower ones. For RUM, response time is displayed as a heat map at the country level.
Hovering over the bubble and the heat map displays tooltips that show information such as location, average response time, availability, page views (for RUM), and details by Internet Service Provider (ISP). - Availability (%): This metric uses a color gradient (e.g., green for high and red for low) to represent the availability percentage for synthetic locations. The availability details for each synthetic location are displayed in the tooltip when you hover over it.
- Current Status: Different colors indicate the status of each synthetic location, with green representing an active status and gray denoting an available but inactive status. This view also displays the hosted IPs for each location.
Performance Report
Throughput Graph
Throughput is calculated by dividing the total content length (in KB) by response time (in sec) during the selected time period. This data is useful to analyze your connection speed as well as the bandwidth usage of the server.

Availability and Response Time by Location
Response Time by Location graph shows the average and 95th percentile response time(s) for the chosen time period from your selected monitoring locations. For Raw data, average value is derived by using all the data collection checks. For Hourly data, the average data is derived using the hourly poll count. Location legends allow you to isolate individual response times based on locations.

The Availability and Response Time by Location table clearly segments all the individual attributes constituting the response time and captures the actual time in milliseconds from all your configured locations. It also displays the ISP Name for each monitoring location, allowing you to compare performance across different internet service providers. Additionally, you get to view the availability percentage and other downtime metrics from all your configured locations.

Response Time by IP
The Response Time by IP graph shows the average response time(s) for the chosen period for the IP addresses that were resolved. The graph will be available only when the period chosen is Raw and when there is more than one resolved IP address.

Average Response Time by Location
It gives you the Average Response Time in milli seconds from your monitored locations. The value is inferred based on other selected parameters, viz., Time Period, Unit of Time (Raw or Hourly), Business Hours.
For example, if you've selected Time Period as Yesterday and Unit of Time as Hourly: the individual hourly average from 12:00 AM to 12:PM will be fetched and added up before dividing by 24.
However, if the data fetched is RAW data, then actual response metric collected during individual polls between 12:00AM and 12:00 PMare summed up and divided by the total number of polls during the time period. Additionally, you're also shown the 95th percentile values, which is greater than or equal to 95% of the observed values of your polled data during the selected time range.

Response Time (Raw and Hourly data)
Response Time value will be fetched and displayed to you based on the parameters selected, viz., Time Period, Unit of Time (Raw or Hourly), Business Hours.
For RAW data selection, response time metric (in milli seconds) captured during individual polls between the selected time period are listed. The response time is listed against the polled time.
For Hourly data, archived hourly average response time data (calculated by summing up individual responses in an hour divided by the number of polls in an hour) is displayed against the polled time.

Downtime Instance Screenshot
A screenshot is taken whenever a downtime is detected and confirmed. Using this option you can see what exactly your website returned for the end-user, when Site24x7 reported your website as down. This option helps you to isolate and resolve issues faster.
To get a screenshot of a downtime,
- Navigate to Home
- Click a URL monitor that is displayed as down (shown using a red downward arrow)
- In the monitor details click the small black camera icon that is placed at the right hand side of the History Data section.
Website Response for Content Mismatch
When ever a content mismatch occurs Site24x7 will be showing that monitor in 'Trouble' status. You have the option to view the HTML response of the webpage during that instance.
To view the HTML response
- Navigate to Home
- Click a URL monitor that is shown in 'Trouble' status (shown using an Orange upward arrow
- Under the History Data section, click the small button labelled 'HTML', that is placed under 'Trouble' reason string.
- The HTML response at the time of content mismatch will be shown.

Root Cause Analysis (RCA) Report:
You can retrieve indepth root cause analysis report for your Down or Trouble monitors after 150 seconds of the monitor reporting the outage. RCA Report gives basic details about your monitor, outage details, recheck details and reasons for the outage. Root Cause Analysis automatically generates a plethora of information to arrive at a definite conclusion as to what triggered a downtime. RCA intends to determine the root cause of specific downtime or performance issue. A normal RCA report will comprise of the following details:
- Checks from Primary location and re-checks from Secondary location.
- Ping Analysis
- DNS Analysis
- TCP Traceroute
- MTR Report
- APM Traces
- View Response Comparison
- MTR-based Network Route
- If you've a real user monitor (RUM) for the same URL, you can view metrics from RUM through seamless integration.
- View Events
- Conclusion

APM Traces
APM Traces will be available only if the website application is also monitored by Site24x7's application performance monitoring (APM) using the same Site24x7 account. With seamless APM integration, trace data can be obtained for each step in the transaction. Learn more about APM Traces.

RUM integration
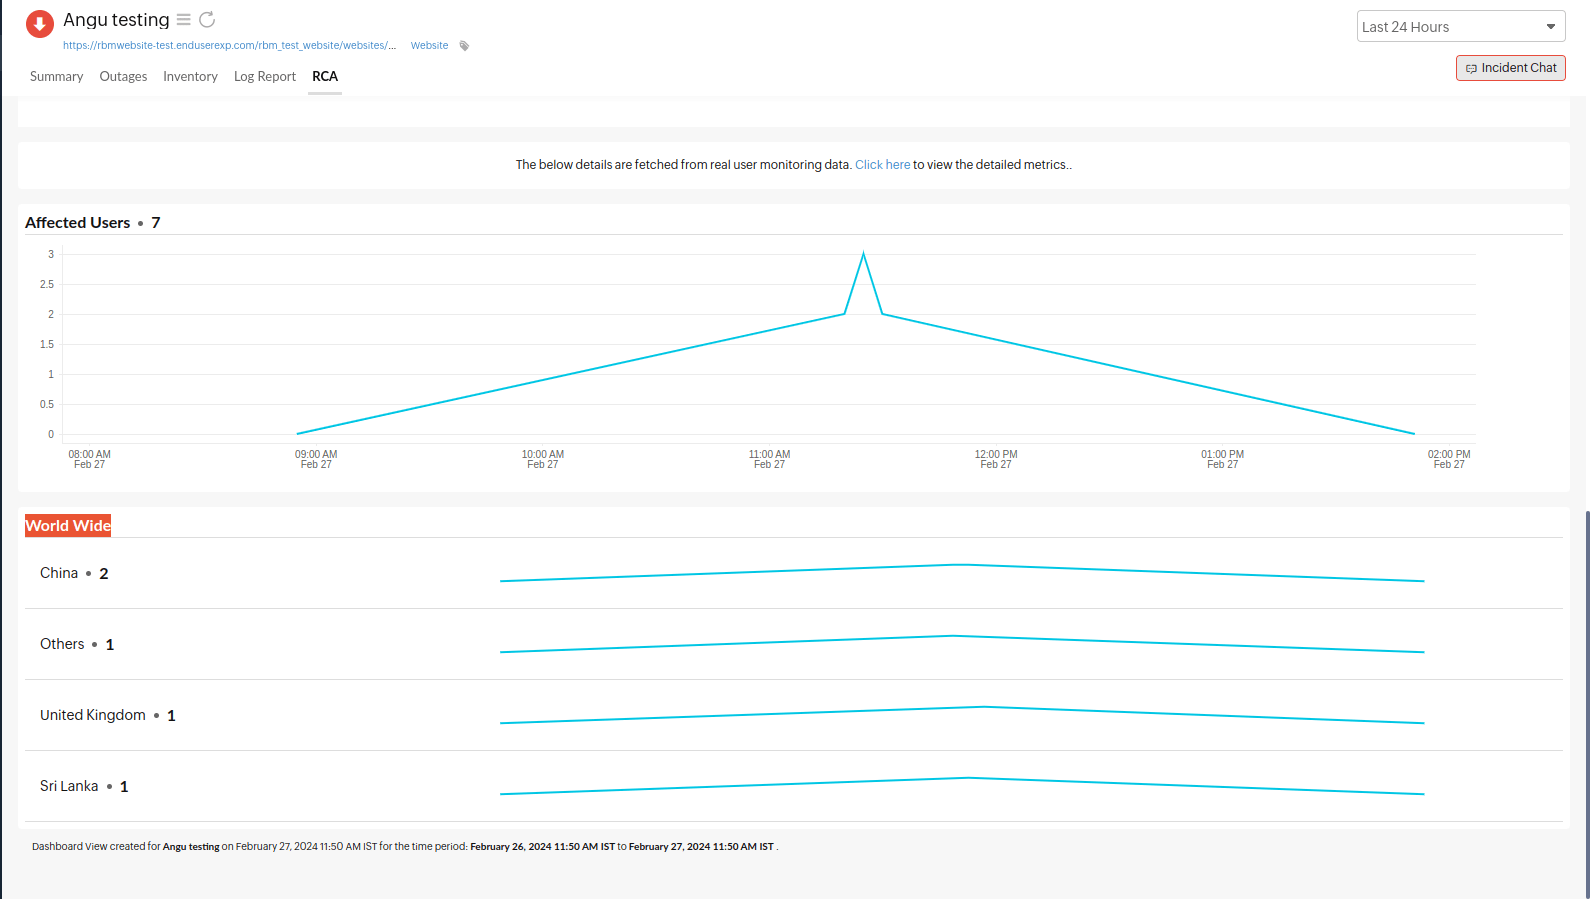
With this seamless integration of website monitor with real user monitoring, you can get to see the following details on your RCA page.
- Affected users
You can view the number of users interacting with a website over the period of time with respect to the outage period. This helps you understand the intensity of this outage. For instance, if an outage has happened at 11 am, and if you're checking the RCA around 11.30 am, the user interactions chart will have data from 8 am to 11.30 am. - World Wide
This is the split up of the above user sessions based on their geographical region. It provides insights on regions that are affected the most.
View Response Comparison
If you wish to check the difference in the responses received, you can use this option. By clicking the View Response Comparison link you can view the response difference tab. The old responses will be on the left and the new ones will be on the right.

View Events
You can view a list of events that occurred during the downtime for a specific location. This will help you obtain a detailed analysis for your RCA report. Click the View Events link to access the list of events, including the corresponding time in milliseconds.

Performance Benchmarking:
The benchmarks widget is now integrated with-in the client letting you compare your website performance with industry peers. With our performance benchmarking widget, you can instantly view and compare your average response time and availability of your service with respect to your industrial peers. This can be viewed across various industrial verticals.

Outages
You can access the Outages tab in your monitor's details page to gather detailed insights on the various outage and maintenance downtimes. It provides you with sufficient information to troubleshoot issues. You'll also be able to access the root cause analysis reports for your various outages. On accessing the ![]() icon of a listed monitor outage or maintenance, you'll be shown the options to:
icon of a listed monitor outage or maintenance, you'll be shown the options to:
- Mark as Maintenance: Mark an outage as Maintenance
- Mark as Downtime: Mark a Maintenance as Downtime
- Edit Comments: Add/Edit Comments
- View HTML: View the error response in HTML format obtained during a failed content check
- View Image: View the RCA screenshot for the outage
- Delete: Delete an Outage/Maintenance permanently
Inventory and Notes
This section captures the basic monitor information and also its various configuration settings including polling locations, poll interval, licensing type, IPv4/v6 and more. If you've additionally specified an SSL protocol check, the same details will be listed here as well. You can use the Add Note option to enter additional information relating to the monitor. Learn more.

Poll Now Report
You can initiate a Poll Now from the Details page or click the Poll Now button to generate the Poll Now report. The report includes specifics like SSL/TLS protocol version details, and other Cipher suite details like Key Exchange, Bulk Encryption, APM Traces,and Hash Function. You can also gain more information on request and response headers and traceroute output information from all your monitoring locations.
Poll Now report is valid for a day from the time you initiate a manual poll.

Log Report
With our integrated log records for individual monitors, you can get an indepth knowledge about the various log details for the configured monitor over a custom period. You can also filter the log based on location and availability. Multiple metrics, including availability status, HTTP status codes, APM Traces, DNS response time etc. are captured here. You can also export the Log Report in CSV format.
Clicking the desired row in the Log Report will take you to the Collection Summary.
- Collection Summary
This report provides a detailed location data collection summary based on a particular location's status and time. It includes the Status, Location, Resolved IP, Size, Response Time (ms), Protocol, Bulk Encryption, Key Exchange, and Hash Function. Additionally, this report displays the Request Headers, Response Headers, and Response Content.
Clicking the page icon (
 ) next to the Size will display the Response Content of your website or REST API.
 Note
Note- The Collection Summary report is only available if the Store Data Fields option is enabled in the monitor configuration.
- The Collection Summary report will be available for the cases below:
- All Up poll entries for individual locations
- HTTP status code errors, including errors like 400 Bad Request, 404 Not Found, and 500 Internal Server Error
- Locations marked with a Trouble or Critical status, including content check failures, availability or unavailability, string mismatches, and JSON or XML validation failures
- Response times exceeding the configured threshold
- The Collection Summary report will not be available when:
- The endpoint cannot fetch the responses and has connectivity errors that include error messages such as Connection cannot be established, Domain name is not resolvable, and Connection timed out.
- AppLogs
You can view all the request headers, response headers, and responses in AppLogs. When you select the check boxes for the Store Data Fields option and save the monitor, the log type Synthetic Monitor – URL will be created in AppLogs.
AppLogs is Site24x7's log management service that allows you to upload and manage logs from your entire infrastructure on a single dashboard. You can use an easy-to-understand query language to filter out invalid values and quickly obtain actionable insights.
Log space is allocated according to your plan and license. Additional add-ons can be purchased if needed. For further assistance, contact us at sales@site24x7.com.

Learn more: How to set up a Website monitor?