Monitor Kubernetes
Monitor the different components of your container infrastructure using Site24x7's Kubernetes Monitoring and get a complete picture of the health and performance of your Kubernetes clusters.
Supported ecosystems:
Add a Monitor
To add a Kubernetes monitor, log in to your Site24x7 account and go to Server > Kubernetes > Clusters (+).
Method 1: DaemonSets
Configure Role-Based Access Control (RBAC) permissions and install Site24x7 agent as DaemonSet:
- Download the site24x7-agent.yaml file and save it in your Cloud Shell or Master Node terminal.
- Copy and execute the below command to create the Secret and apply the YAML(Replace
with your device key):
kubectl create secret generic site24x7-agent --from-literal KEY=
&& kubectl apply -f site24x7-agent.yaml
Ensure the site24x7-agent pods are created and in running state. Please wait a few minutes for all of your nodes, containers, pods, deployments, HPA, and ReplicaSets to be added in Site24x7's web client.
Proxy configuration:
If the set up has proxy, uncomment the following lines under Site24x7's env section in the site24x7-agent.yaml file, and update the proxy value.
- name: http_proxy
value:
Method 2: Helm chart
Follow the below steps to install your Site24x7 Kubernetes Agent using Helm chart:
- Install the Site24x7 Helm chart using the following commands:
helm repo add site24x7 https://site24x7.github.io/helm-charts;
helm repo update;
helm install site24x7-agent site24x7/site24x7 --set deviceKey=<device-key>;
Replace <device-key>
Proxy configuration:
Set the proxy configuration as one of the install parameters to the Helm install command.
Sample:
helm install site24x7-agent site24x7/site24x7 --set deviceKey=--set http_proxy=http://192.108.10.10:3128 --set https_proxy=http://192.108.10.10:3128;
Sample with proxy authentication:
helm install site24x7-agent site24x7/site24x7 --set deviceKey=--set http_proxy=http://username:password@192.108.10.10:3128 --set https_proxy=http://username:password@192.108.10.10:3128[;](http://192.108.10.10:3128;)
The Helm chart adds Site24x7 Kubernetes Agent to all the nodes in your cluster via a DaemonSet. In addition, it also deploys the kube-state-metrics as a deployment for fetching advanced kubernetes metrics. Once the kube-state-metrics is deployed, Site24x7 reports the hosts and the metrics data in your account.
Configure Role-Based Access Control (RBAC) permissions and deploy the Site24x7 Server Monitoring agent as a Sidecar Container to your Application Container:
- Download the Site24x7 Sidecar YAML file.
- Save it in the Cloud Shell or Master Node terminal.
- Open the downloaded YAML file and replace the application's image and name with your application container.
- Copy and execute the below command to create the Secret and apply the YAML(Replace
with your device key):
kubectl create secret generic site24x7-agent --from-literal KEY=
&& kubectl apply -f site24x7-sidecar-agent.yaml
Proxy configuration:
If the set up has proxy, uncomment the following lines under Site24x7's env section in the site24x7-sidecar-agent.yaml file and update the proxy value.
- name: http_proxy
value:
Enable kube-state-metrics for monitoring advanced Kubernetes metrics. To configure kube-state-metrics:
- Download the Site24x7 kube-state metrics YAML file.
- Save it in the Cloud Shell or Master Node terminal.
- Execute the below command to apply the YAML.
kubectl apply -f site24x7-kube-state-metrics.yaml
- This deployment will discover your overall Kubernetes infrastructure.
- Since the agent is running as a side-car container, performance metrics of the nodes, pods, and containers will only be subjected to that pod.
- If you wish to monitor the performance of each pod then run an agent in each pod.
Method 4: GKE Autopilot
Configure Role-Based Access Control (RBAC) permissions in the cluster and install the Site24x7 agent as DaemonSet in GKE Autopilot:
- Download the Site24x7 GKE Autopilot YAML file.
- Save it in the Cloud Shell or Master Node terminal.
- Copy and execute the below command to create the Secret and apply the YAML(Replace
with your device key):
kubectl create secret generic site24x7-agent --from-literal KEY=
&& kubectl apply -f site24x7-gke-autopilot-agent.yaml
Proxy configuration:
If the set up has proxy, uncomment the following lines under env section in the site24x7-agent.yaml file, and update the proxy value.
- name: http_proxy
value:
Method 5: Openshift
Configure Role-Based Access Control (RBAC) permissions in the cluster and install the Site24x7 agent as DaemonSet in OpenShift:
- Download the site24x7-openshift-agent.yaml file.
- Save it in the Cloud Shell or Master Node terminal.
- Open the downloaded YAML file and replace the
with your device key. - Copy and execute the below command to apply the YAML.
oc apply -f site24x7-openshift-agent.yaml
Proxy configuration:
If the set up has a proxy, uncomment the following lines under env in the Site24x7 agent YAML file and update the proxy value.
- name: http_proxy
value:
Edit Monitor
You can choose to modify configurations for your Kubernetes cluster in the Edit Kubernetes Monitor page.
- In the Site24x7 web client, go to Server > Kubernetes > click on a cluster > Cluster Details.
- Hover on the hamburger icon beside the display name. Click Edit.
- Choose to edit the Display Name, association with Monitor Groups, Tags, IT Automation Templates, choose the Resource Type, Exclude/include Namespaces, Exclude/include Names, Exclude/include Labels, select Name Filter for Resource Type, exclude/include HPA, select/deselect Resource Groups, and edit Configuration Profiles.
NoteYou can include or exclude resources by matching them against regular expressions (regexes). For example:
zylker.*|zylkertest1.*
The above matches resources starting with 'zylker' OR starting with 'zylkertest1'. - Under Resource Termination Settings, mute alerts when resources are terminated using the Mute Resource Termination Alerts option and remove terminated resources using the Automatically Remove Terminated Resources toggle. You can also specify how long (in days) the terminated resources should be retained in the Site24x7 web console before permanent deletion.
- Save your changes.
Dashboards
The Cluster dashboard in Site24x7 lets you get a centralized view of all your Clusters, Nodes, Pods, Services, DaemonSets, Deployments, ReplicaSets, and Jobs of your entire Kubernetes cluster.
There are two more exclusive dashboards for Kubernetes:
Site24x7 also offers dashboards to view metrics at different levels such as Nodes, Pods, Containers, and more. Learn more about Site24x7's various Kubernetes dashboards.
Business View
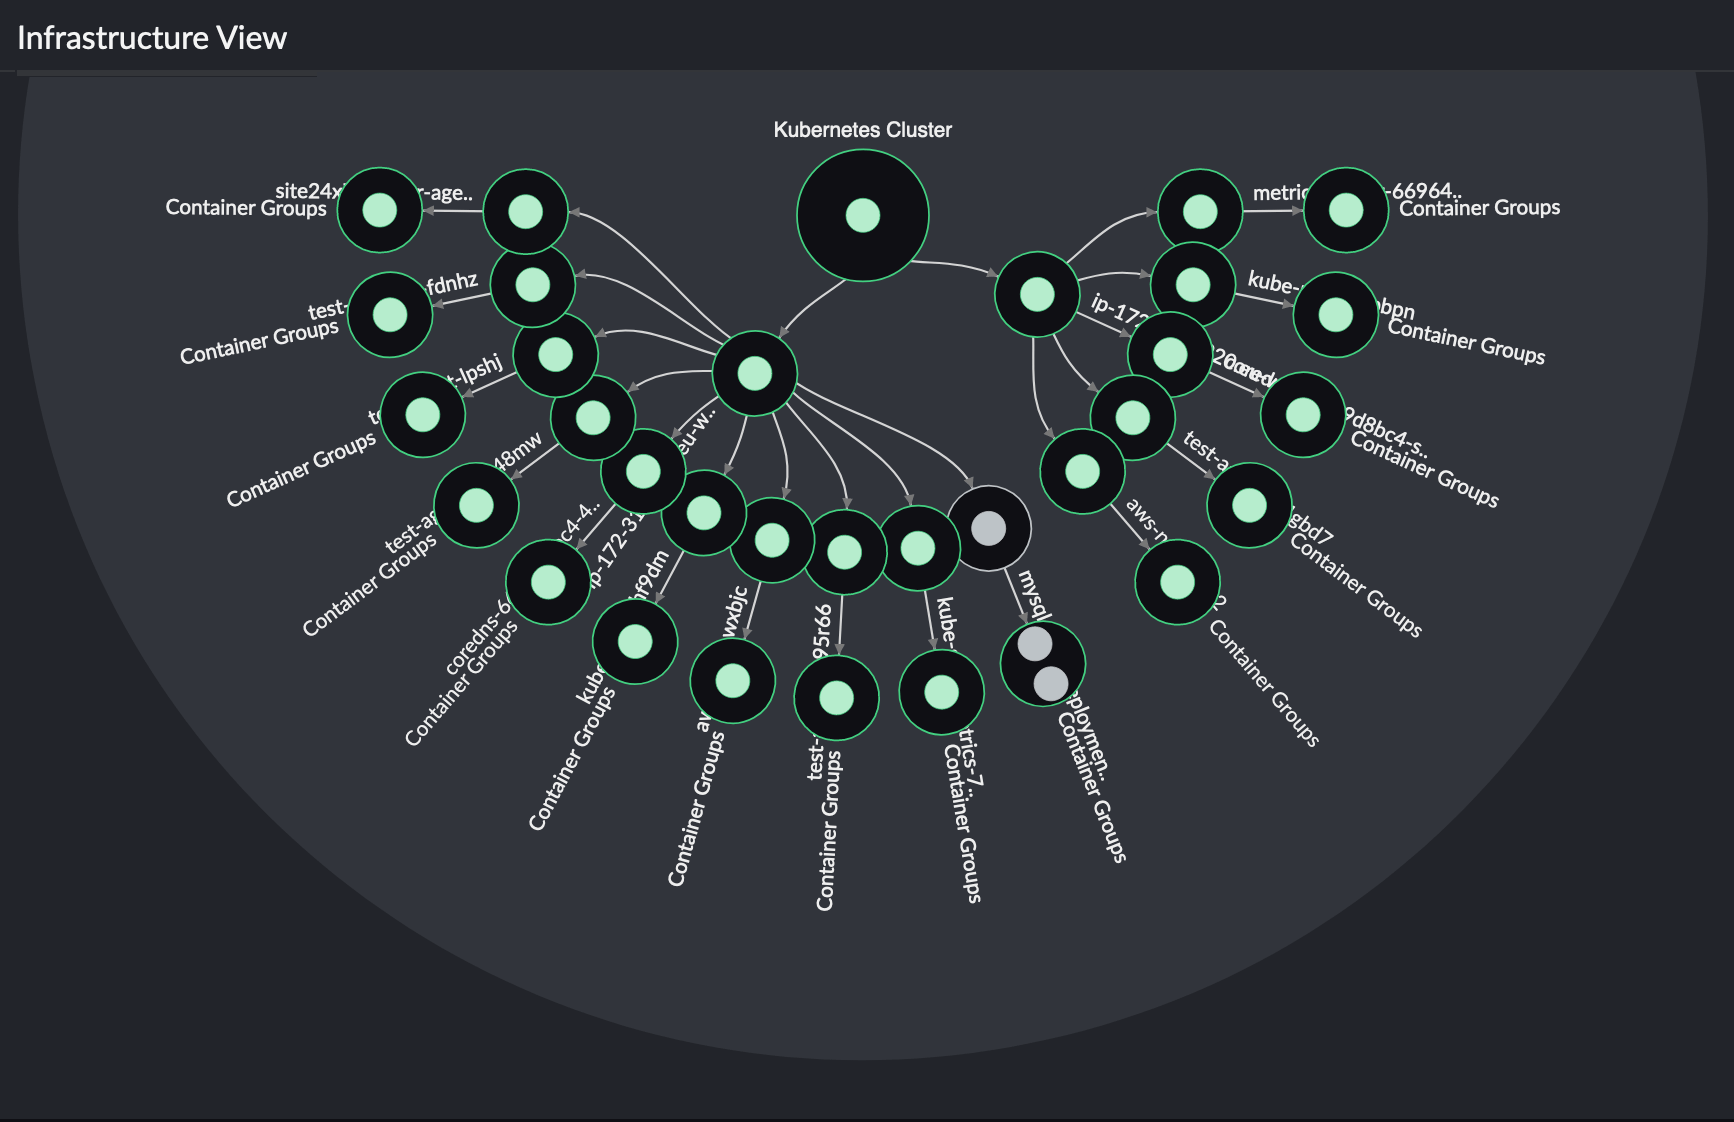
Once a Kubernetes monitor is added, a business view is created for your entire cluster. Toggle between Infrastructure View and Service View to spot outliers and detect unusual monitoring patterns in Kubernetes cluster. Learn more.
Infrastructure View:
This view shows your entire Kubernetes cluster from a node point of view(i.e., data of the Kubernetes cluster, nodes, pods, and containers).

Service View:
This view shows your entire Kubernetes cluster from a service point of view (i.e., data of the Kubernetes cluster, service, pods, and containers).
Performance Metrics
For every component discovered and monitored in Site24x7, find the list of various performance metrics we provide to ensure continued functioning of your Kubernetes cluster.
Alerting for Kubernetes
Learn how to set up thresholds in Site24x7 for Kubernetes monitoring to ensure optimal performance and uptime.
Forecasting
Utilize our AI-powered, precise predictions and insights to make informed decisions and detect anomalies in your Kubernetes resources. Obtain Zia-based forecast data for the most crucial metrics that determine cluster, node, and pod stability.
Kubernetes Change Tracker
Kubernetes Change Tracker in Site24x7 ensures real-time visibility into configuration modifications, helping you maintain cluster integrity, troubleshoot issues, and meet compliance requirements.
Dependency Tree view
The Kubernetes Dependency Tree view in Site24x7 provides a visual, hierarchical display of your cluster's elements and their connections. This feature aids in comprehending the interconnections between different Kubernetes resources, facilitating the identification of problems and the enhancement of resource utilization.
Configuration Rules
Configuration Rules of Kubernetes help you assign predefined actions to various monitor groups in order to monitor configuration changes. You can assign these rules to a group of resources and run them to be applied immediately.
Reports
In the Site24x7 web client, go to Reports > Kubernetes. The following reports are available for Kubernetes monitor:
- Summary Report
- Availability Summary Report
- Busy Hours Report
- Health Trend Report
- Performance Report
Guidance Report
Get the best practice recommendations for your Kubernetes cluster environment and ensure availability, security, and boosted performance with reduced IT expenditure.
Capacity Planning
Optimize your Kubernetes resources for specific operations or workloads, and track capacity utilization using metrics such as CPU, memory, and disk utilization with Capacity Planning.
Control Plane monitoring
Monitor your Control Plane components to ensure smoother cluster operations.
Node components monitoring
- Kube-proxy
Learn how Site24x7 monitors kube-proxy to ensure reliable service networking in your Kubernetes clusters. Gain visibility into proxy mode, connection tracking, and IPTables/IPVS metrics to troubleshoot networking bottlenecks and ensure smooth traffic routing. - CoreDNS
CoreDNS handles internal DNS-based service discovery within the cluster. Any issues with CoreDNS can disrupt service-to-service communication and workload resolution. Site24x7 tracks CoreDNS performance with metrics like:
Kubernetes Logs
You can collect and monitor the following logs in the Kubernetes environment via the Server monitoring agent running on your Kubernetes nodes:
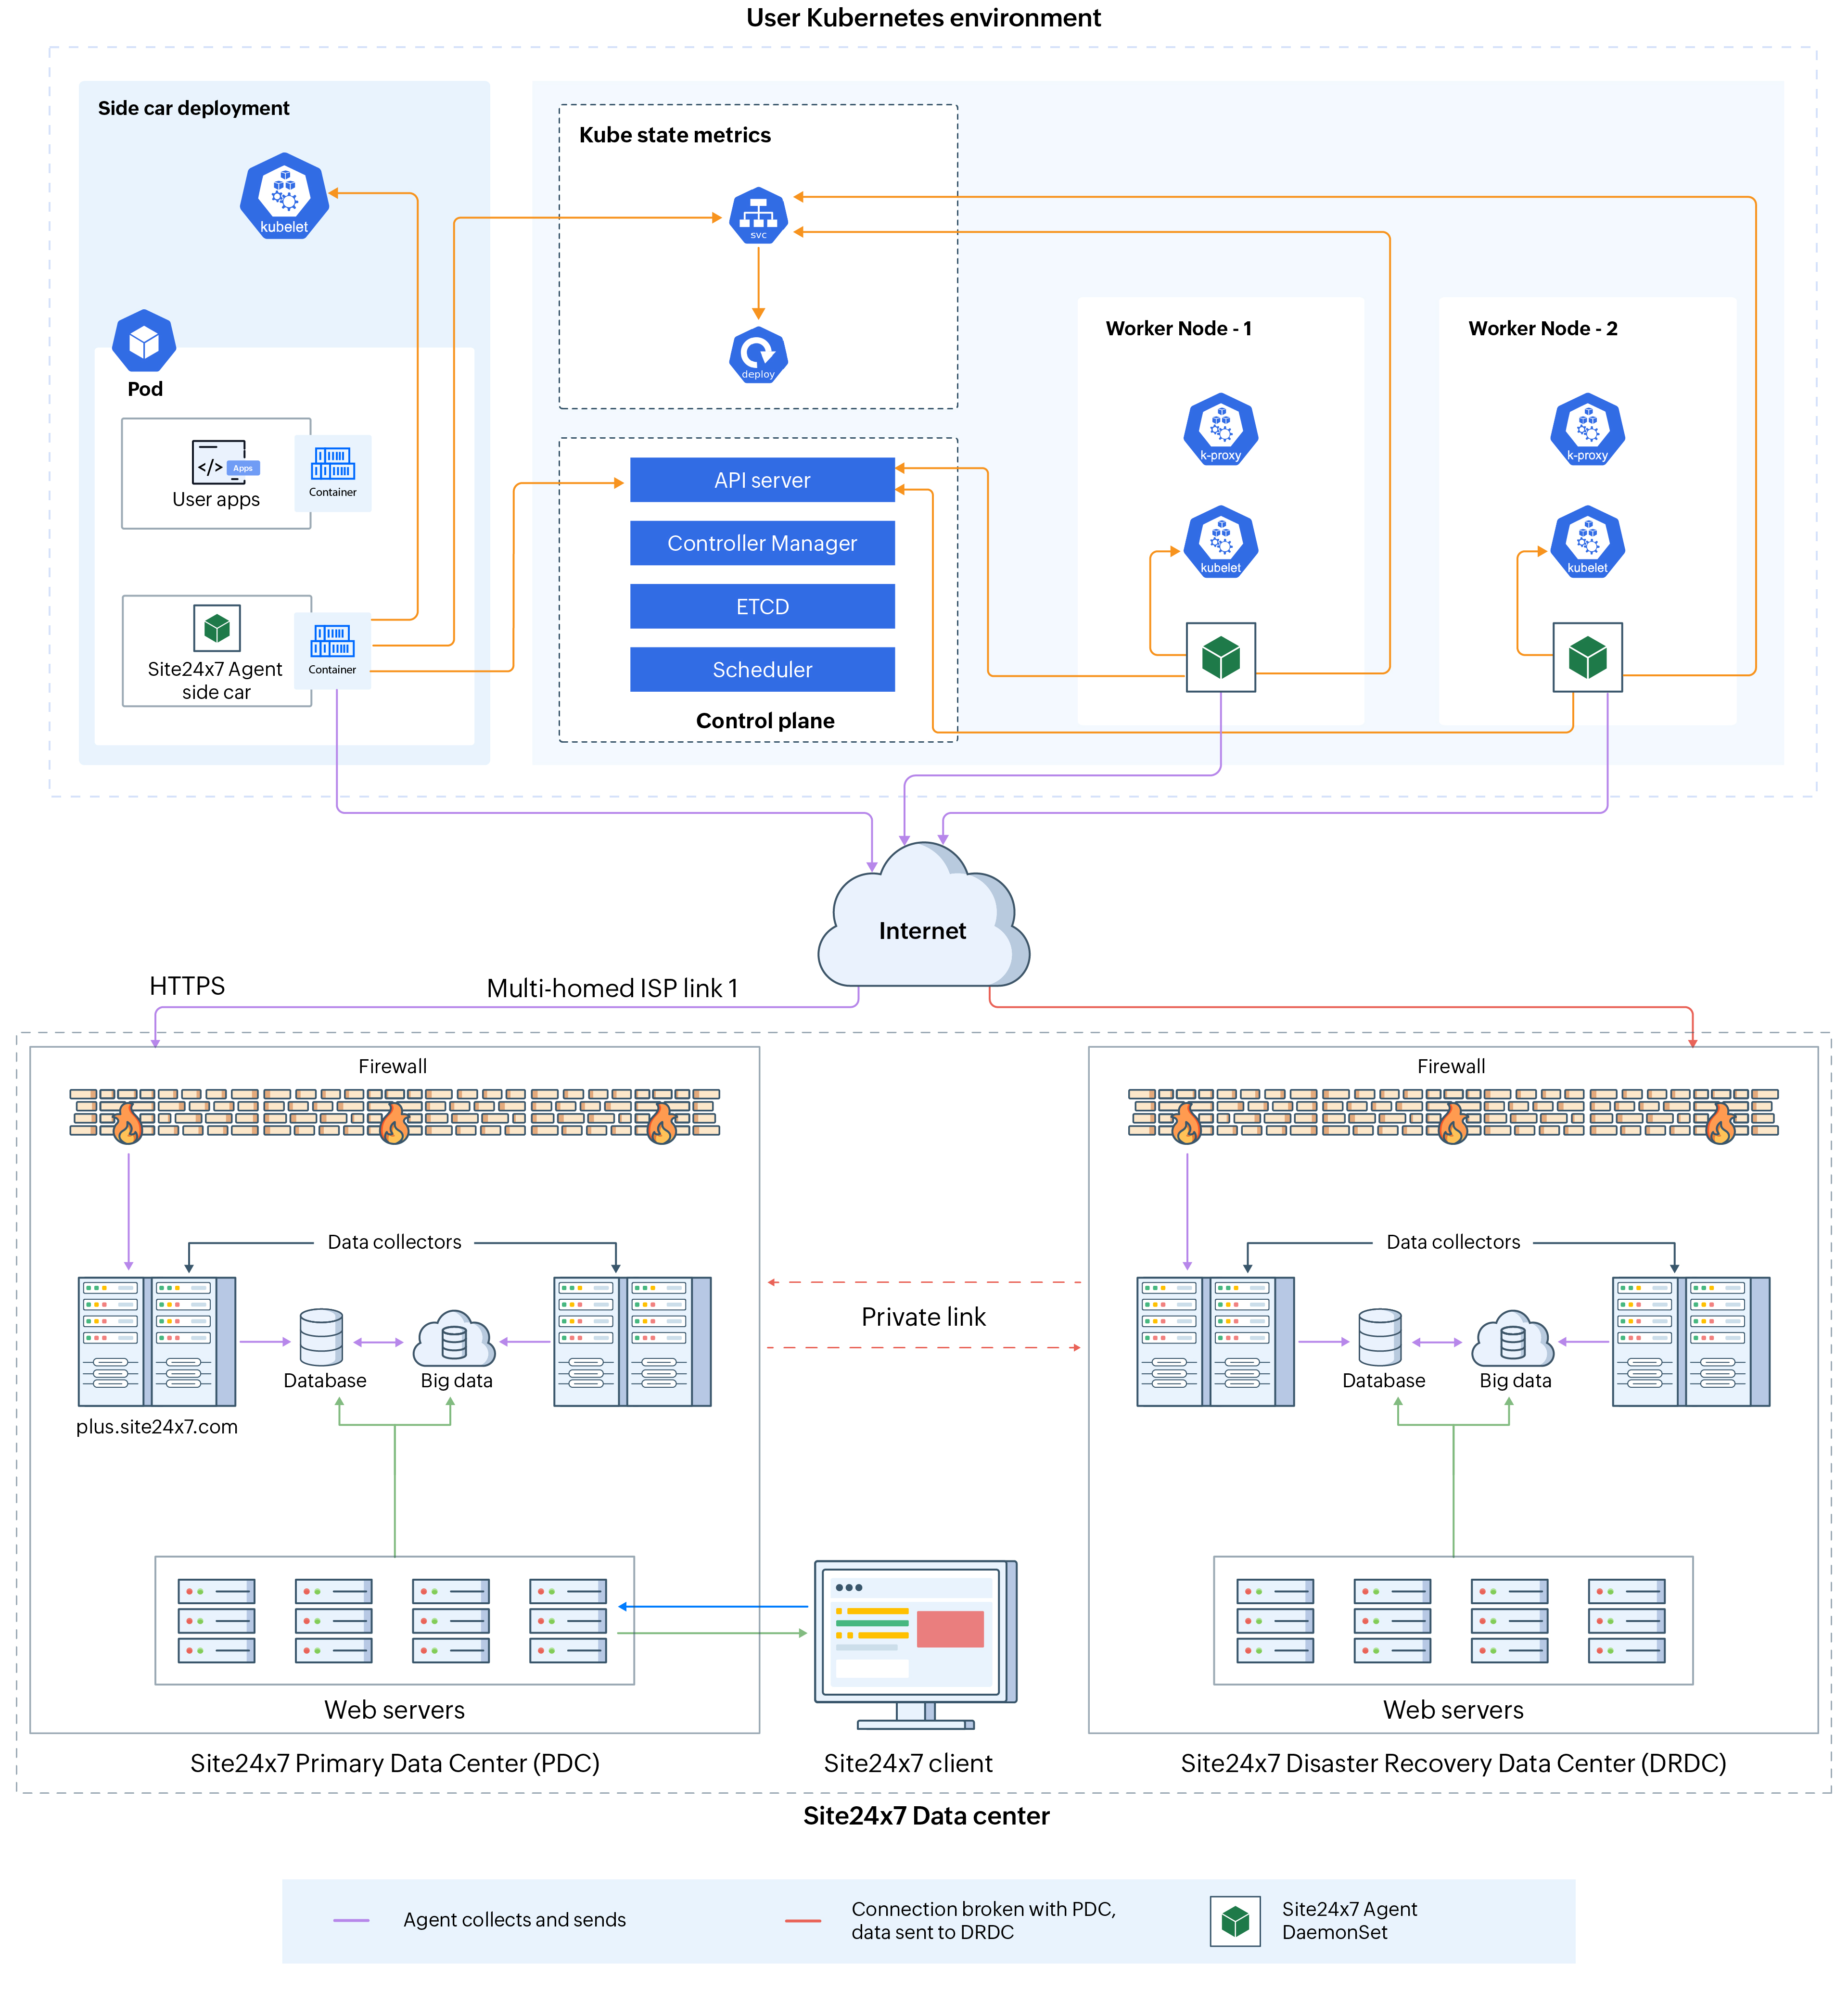
How does data collection (DC) happen

Site24x7 Kubernetes monitoring architecture
Security
The Site24x7 agent collects the configuration data and basic performance data using the Kubernetes API. The API version used is apps/v1. The Site24x7 agent accesses the APIs using RBAC authorization. As a part for RBAC authorization, the following objects with the below mentioned permissions are created while applying the site24x7-agent.yaml file:
- ServiceAccount named 'site24x7' under 'default' namespace.
- ClusterRole named 'site24x7' which includes only 'list' & 'watch' permissions to the APIs for nodes, pods etc.
- ClusterRoleBinding named 'site24x7'.
Once the site24x7-agent.yaml file is applied, the RBAC authorization token is created and automatically mounted into the Site24x7 agent containers created via Daemonset. Using this token, the agent hits the APIs to collect data.
DaemonSet Configurations for the Site24x7 agent:
Once the site24x7-agent.yaml file is applied, a DaemonSet named site24x7-agent is created. RollingUpdate strategy is used for DaemonSet.
- Pods are created with the same name site24x7-agent.
- The containers with 'store/site24x7/docker-agent:
' image are created.
NoteImagePullPolicy is set to 'Always'. - These volumes are mounted inside the containers: /etc/, /var/, /proc/, and /var/run/docker.sock
Collection of performance metrics:
kube-state-metrics is used to collect in-depth performance data. This is enabled only when kube-state-metrics.yaml file is applied. Performance data will be collected by hitting the API:
http://:/metrics
 -> kube state pod ip
 -> 8080 by default
Access for Site24x7 agent:
The Site24x7 agent will have only List or Watch permissions for the Kubernetes APIs, as specified in the site24x7-agent.yaml file. The agent can only read Kubernetes objects data via the Kubernetes APIs and no write operations can be performed. The agent cannot create or update any Kubernetes objects. Data is collected by the agent only via authorized methods recommended by Kubernetes.
Licensing
The main Kubernetes cluster is a basic monitor. For more information, read this article.
You can view the number of licenses consumed by your Kubernetes cluster by clicking Server > Kubernetes > Cluster. The total number of licenses consumed by that particular cluster will be listed under the License Usage column. Click the number to view a drilled-down view of the consumed licenses.

FAQs
- Troubleshooting links for Kubernetes monitoring
- Possible reasons why Kubernetes monitor is not added to Site24x7
- How to verify if the Site24x7 pods are created or are in running state?
- How to disable auto discovery of containers for Kubernetes clusters?
- How to access agent pod and share logs for troubleshooting?
- What will happen if I have an agent installed in a node and try to install the agent again as a pod?
- Will Kubernetes be discovered using the Discover Applications option?
- Is the path 'store/site24x7/docker-agent:
' used to create site24x7-agent a local registry or a public registry?
-
On this page
- Add a monitor
- Edit Monitor
- Dashboards
- Business View
- Performance metrics
- Alerting for Kubernetes
- Forecasting
- Kubernetes Change Tracker
- Dependency Tree view
- Configuration Rules
- Reports
- Capacity Planning
- Control Plane monitoring
- Node components monitoring
- Kubernetes logs
- How does data collection (DC) happen
- Security
- Licensing
- FAQs

 Azure Kubernetes Service
 Amazon Elastic Kubernetes Service
 Google Kubernetes Engine
 Red Hat OpenShift
 AWS Fargate
 Rancher Kubernetes Engine
 Digital Ocean
 MicroK8s
 Kind
Kind K3s
K3s Oracle Kubernetes Engine
  Linode Kubernetes Engine
 Bottlerocket