Dashboards
While Site24x7 offers you the capabilities to create your custom dashboards, there are default dashboards where you can view the performance metrics.
Types of dashboards
- Cluster dashboard
- Inventory dashboard
- Node dashboard
- Pod dashboard
- Container dashboard
- Deployment dashboard
- DaemonSets dashboard
- ReplicaSets dashboard
- StatefulSets dashboard
Cluster Dashboard
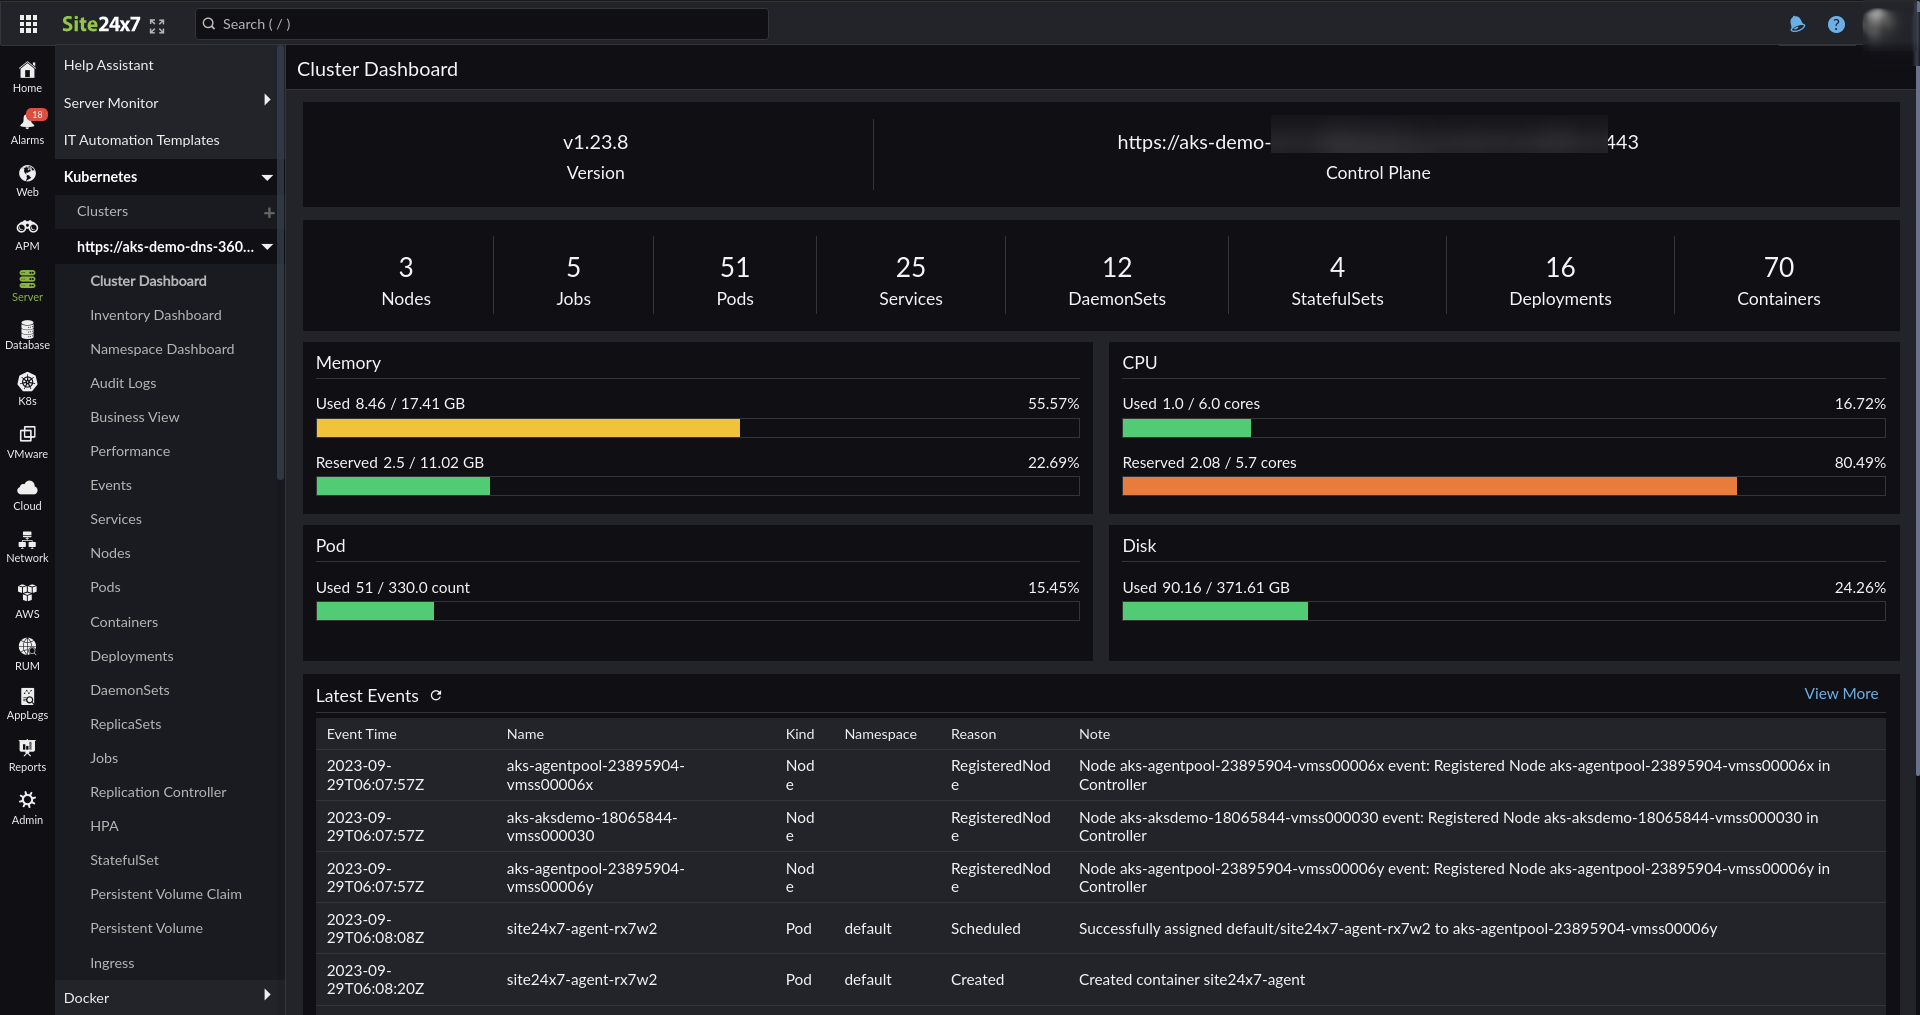
Once you've successfully added a Kubernetes monitor, you'll be directed to the Cluster Dashboard. Or go to Server > Kubernetes and click the required cluster. The Cluster Dashboard will open by default. The Cluster Dashboard will show the aggregated metrics of all the nodes running on the particular cluster.
Highlights
- See the total number of all the Nodes, Pods, Services, DaemonSets, Deployments, ReplicaSets, and Jobs in one view.
- Click on the resource to land on the respective resource's list view page.
- View the list of events that are pushed recently, along with the namespace, the kind of event, and the reason for the event.
Supported agent version: 19.1.0 and above
The Cluster Dashboard gives you chart views of the various metrics of the Kubernetes cluster, namely:
- Memory Capacity:
- Memory Usage (WSS working set bytes)
- Memory Capacity
- Memory Usage Percentage
- Memory Reserved (amount of memory reserved by pods through memory request/limit)
- Memory Allocatable
- Memory Reserved Percentage
- CPU Capacity:
- CPU Usage
- CPU Usage Percentage
- CPU Reserved (amount of CPU reserved by pods through memory request/limit)
- CPU Allocatable
- CPU Reserved Percentage
- Pods Usage:
- Number of Pods Currently Scheduled
- Pods Allocatable
- Pods Usage Percentage
- Disk Usage:
- Disk Used
- Disk Capacity
- Disk Usage Percentage
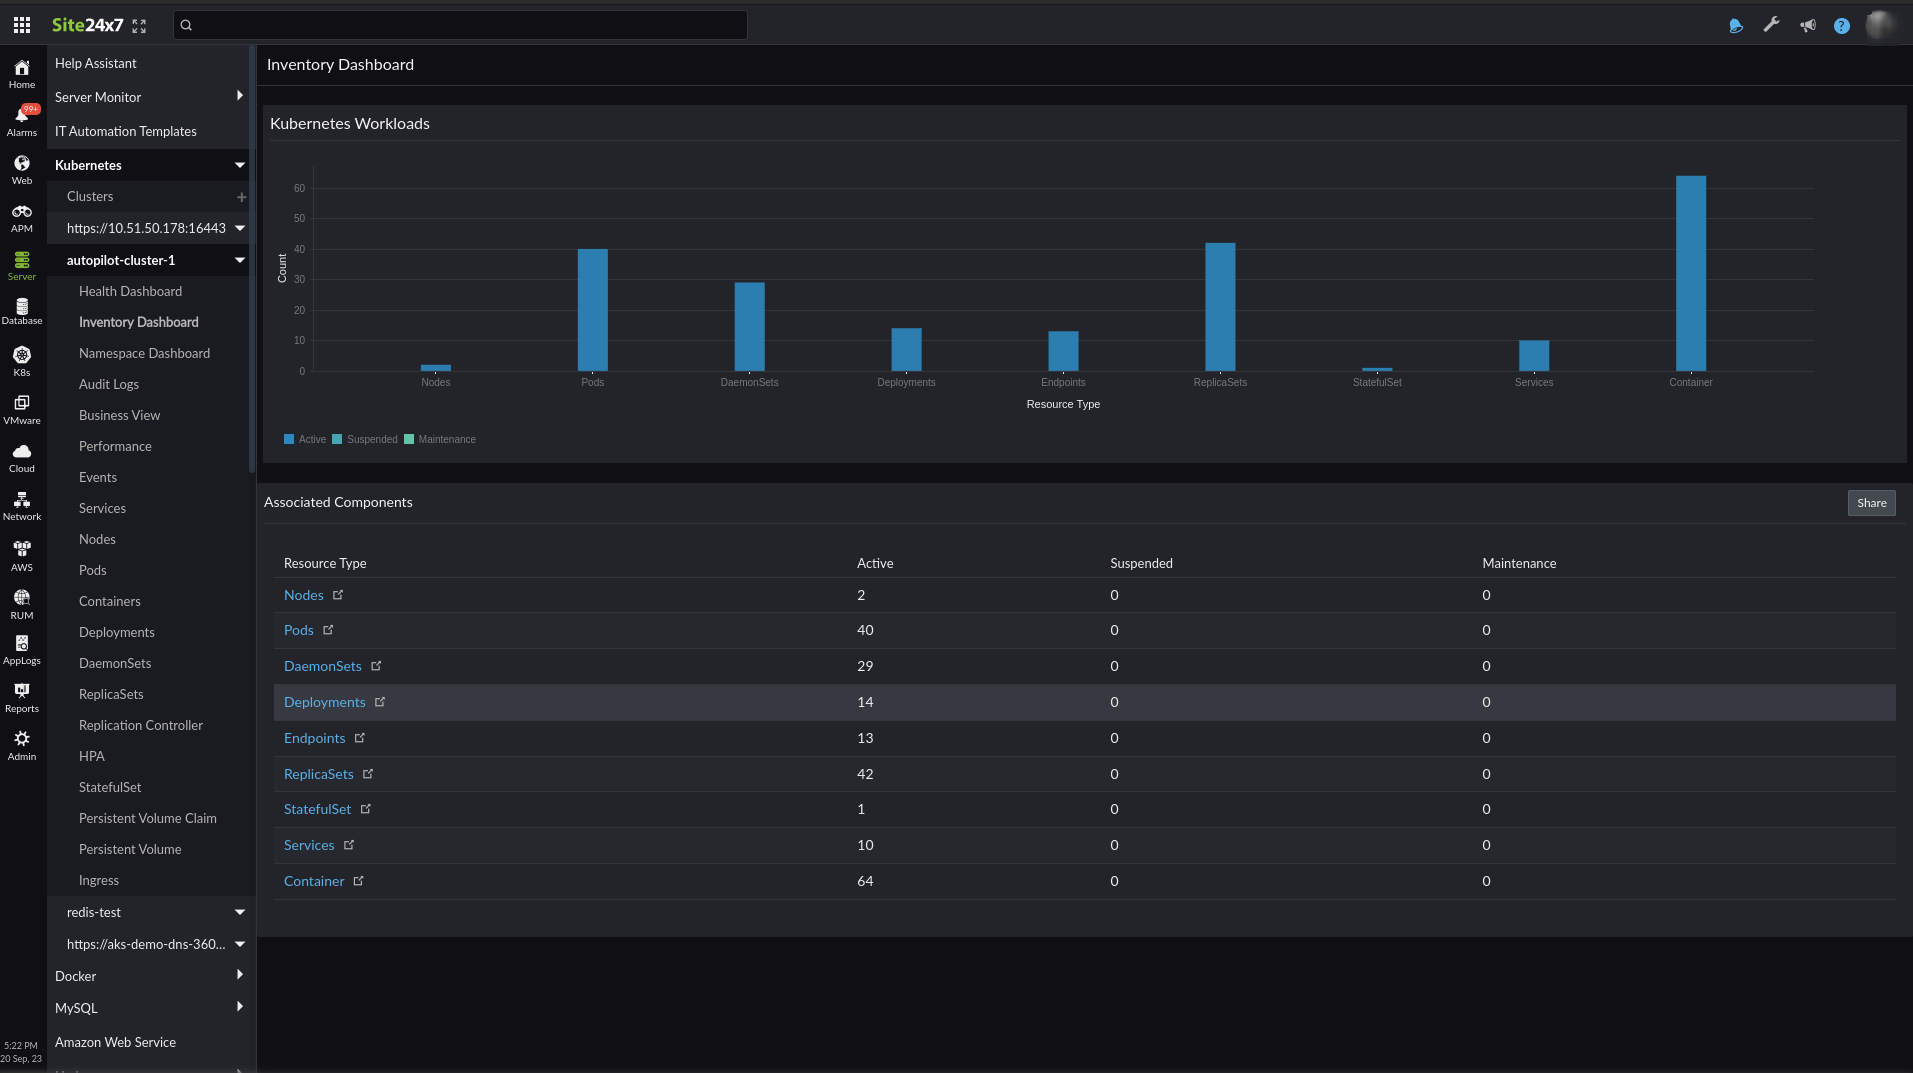
Inventory Dashboard
Go to Server > Kubernetes > click on the cluster > Inventory Dashboard. The Inventory Dashboard gives you a list view of the various resources in your Kubernetes infrastructure including the count of the nodes, pods, DaemonSets, deployments, endpoints, ReplicaSets, and services. Click on a resource type to view a detailed inventory report including their respective labels, annotations, OS type, and more.
Node dashboard
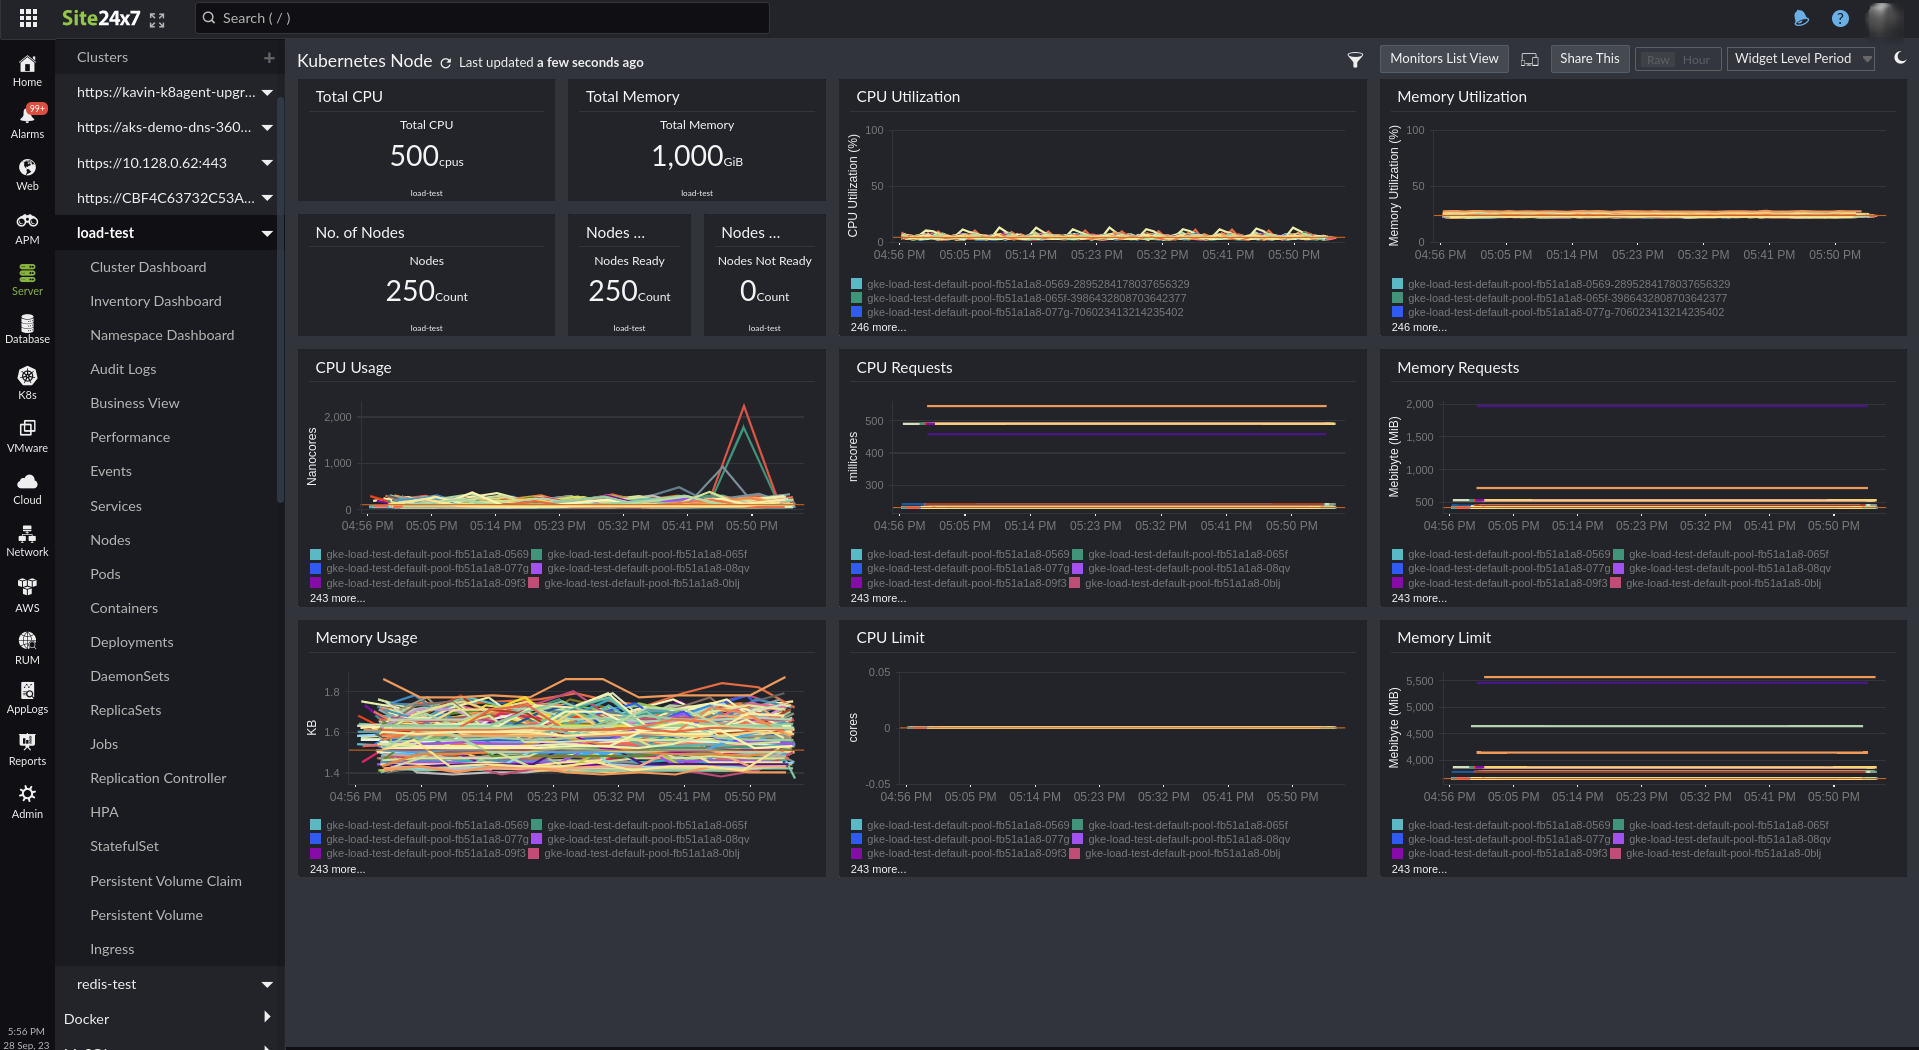
Go to Server > Kubernetes > Click on the required cluster > click the node. The Kubernetes Node dashboard opens by default. To view the list view, click the Monitors List View button and to toggle back to the dashboard view, click the icon. The Kubernetes Node dashboard gives you a list view of the various metrics of the Kubernetes Nodes namely:
- General information about the node
- The number of CPUs
- The total memory
- Number of nodes - total, ready, and not ready
- CPU details
- CPU Limit
- CPU Requests
- CPU Utilization
- Memory details
- Memory Utilization
- Memory Requests
- Memory Limit
- Memory Usage
Pod dashboard
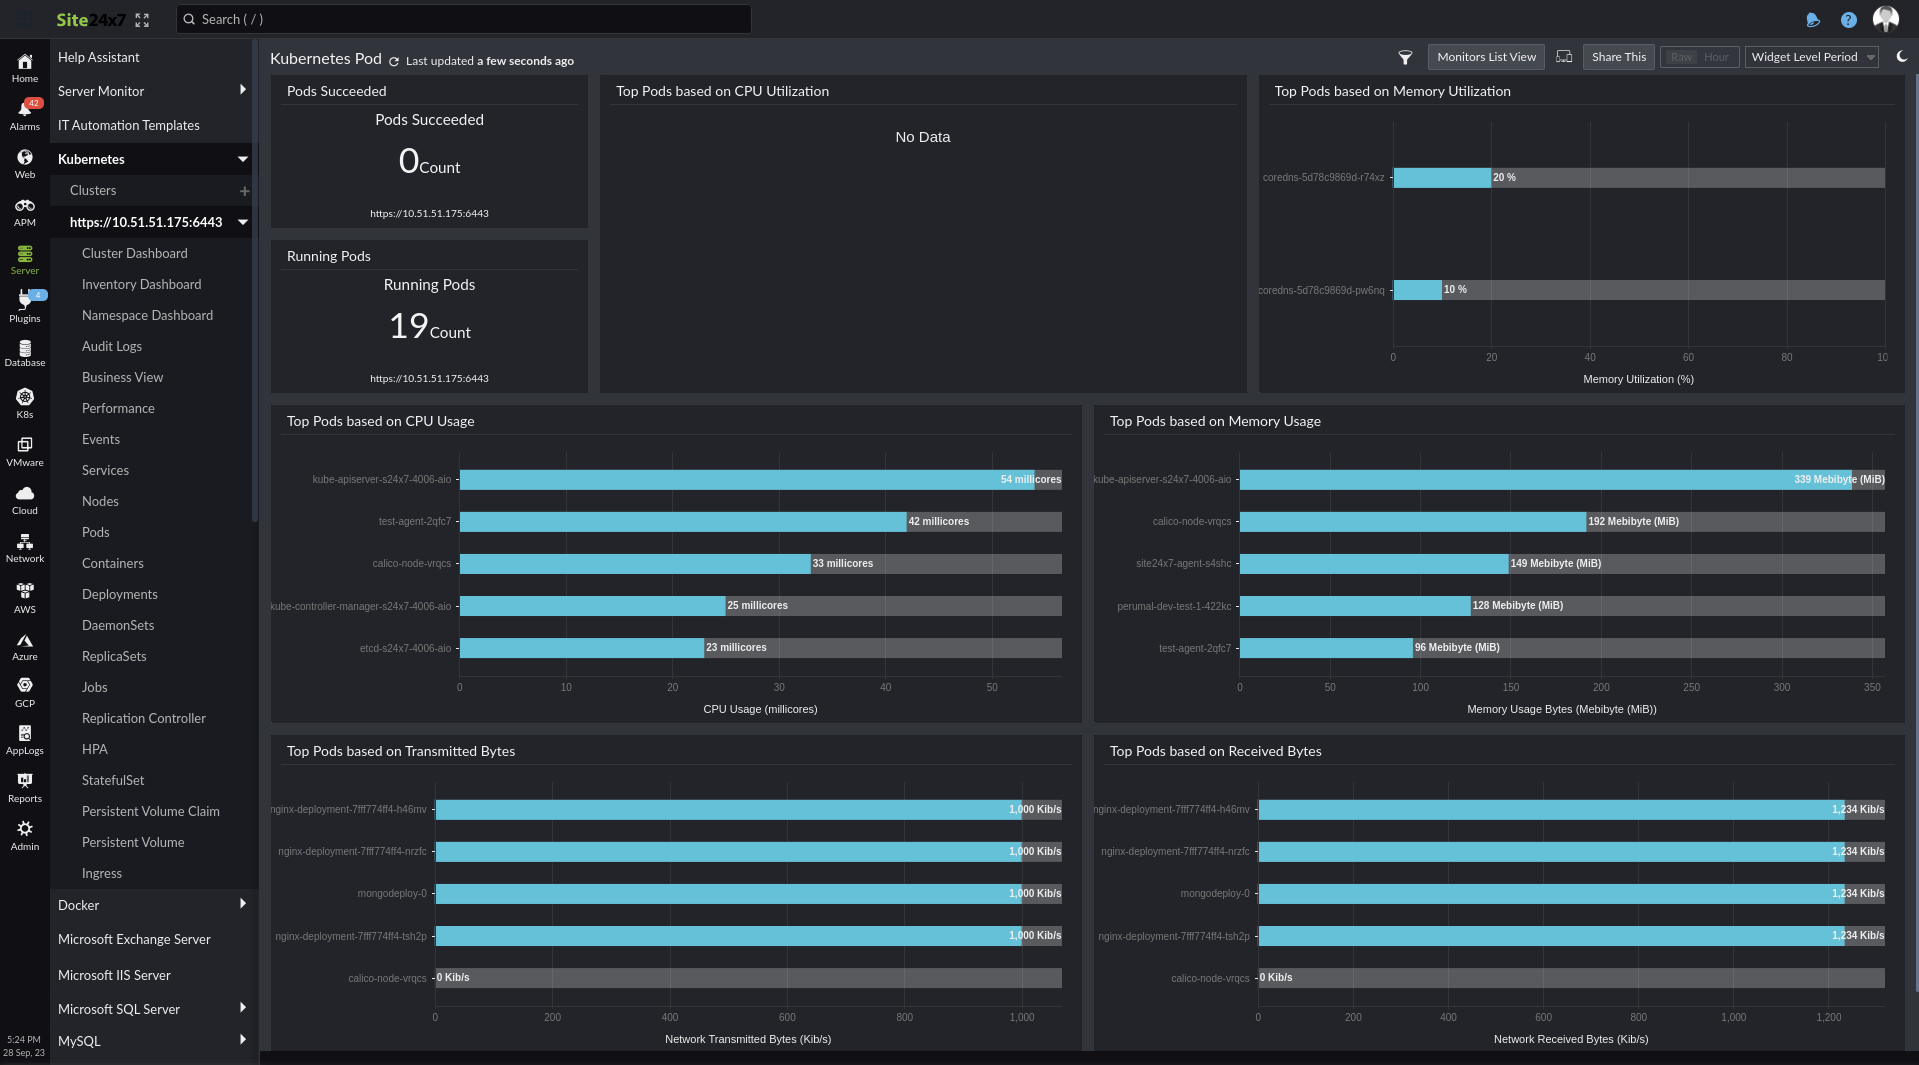
Go to Server > Kubernetes > click the pod. The Kubernetes Pod dashboard opens by default. To view the list view, click the Monitors List View button and to toggle back to the dashboard view, click the icon. The Kubernetes Pod dashboard gives you a list view of the various metrics of the Kubernetes Pods namely:
- Number of pods succeeded
- Number of pods running
- Top pods based on
- CPU Utilization
- CPU Usage
- Transmitted Bytes
- Memory Utilization
- Memory Usage
- Received Bytes
Container dashboard
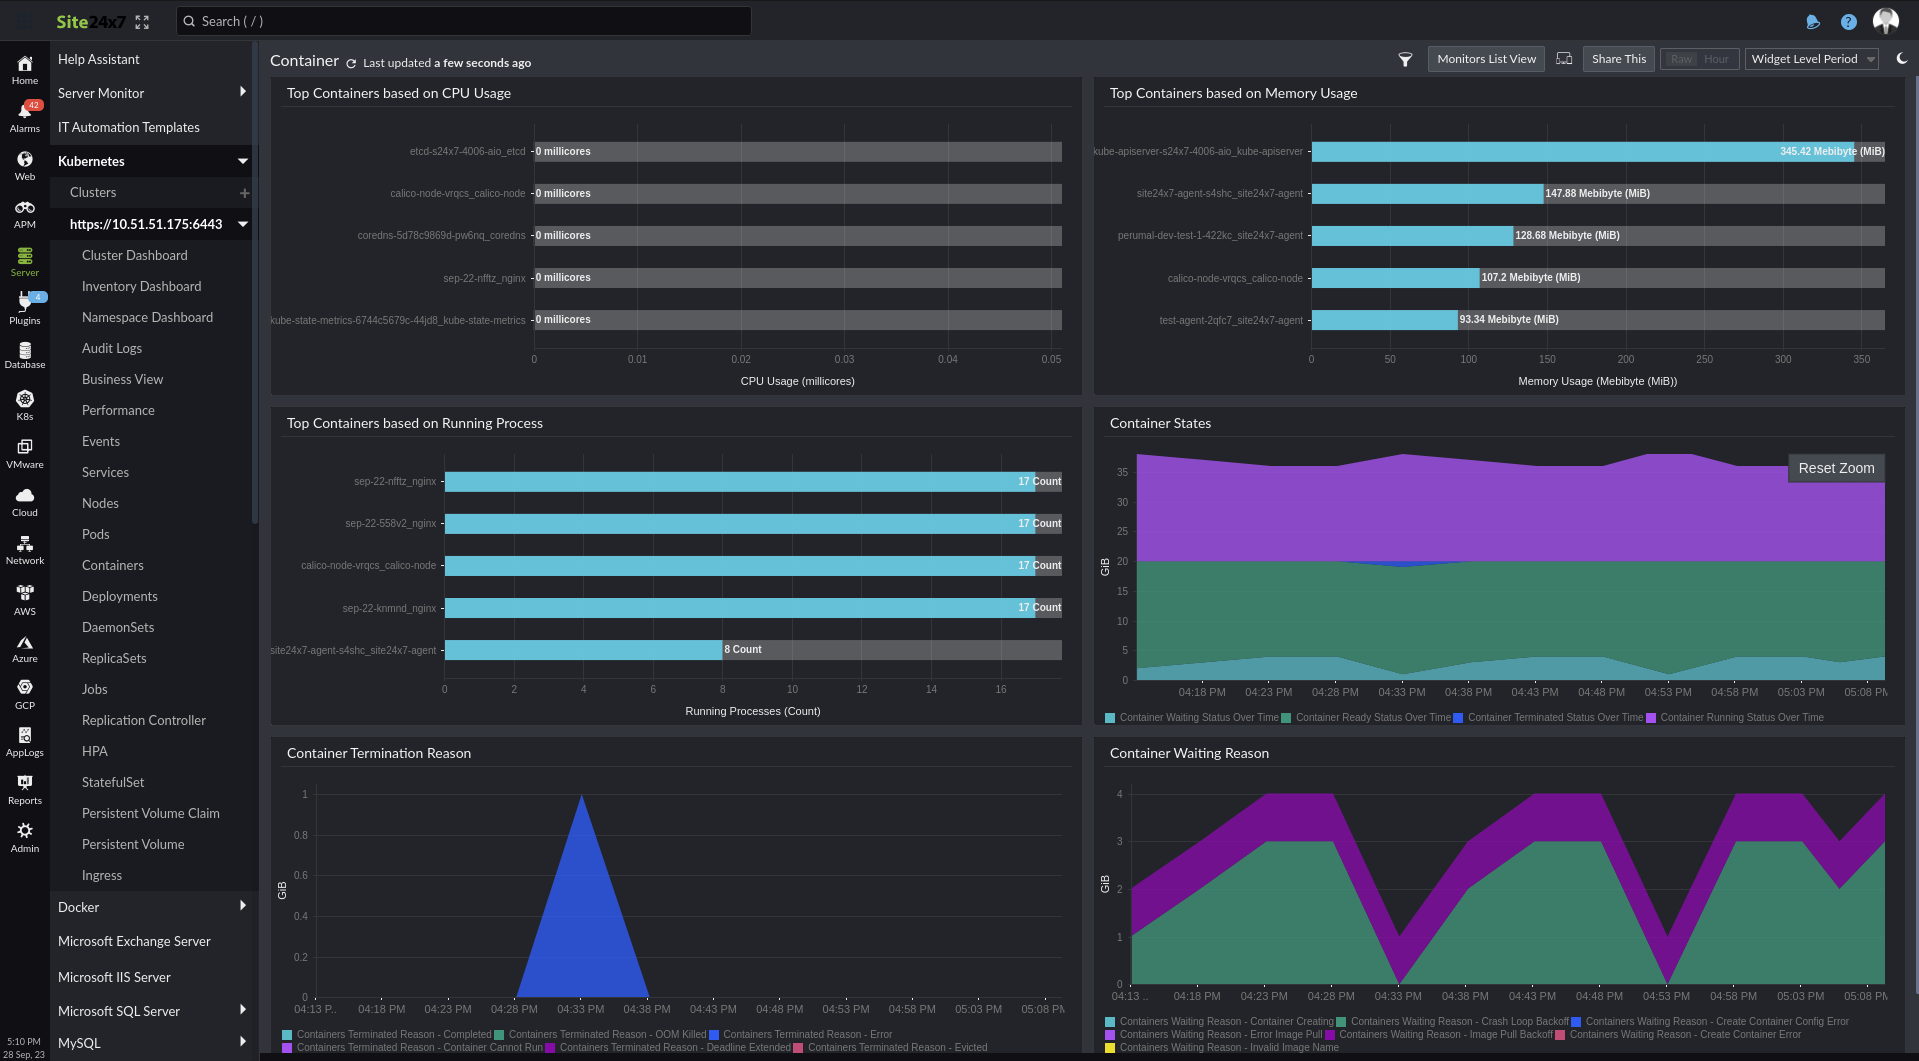
Go to Server > Kubernetes > click the container. The Kubernetes Container dashboard opens by default. To view the list view, click the Monitors List View button and to toggle back to the dashboard view, click the icon. The Kubernetes Container dashboard gives you a list view of the various metrics of the Kubernetes Containers namely:
- Top Containers based on
- CPU Usage
- Running Process
- Memory Usage
- Container States
- Reasons for
- Container Termination
- Container Waiting
Deployments dashboard
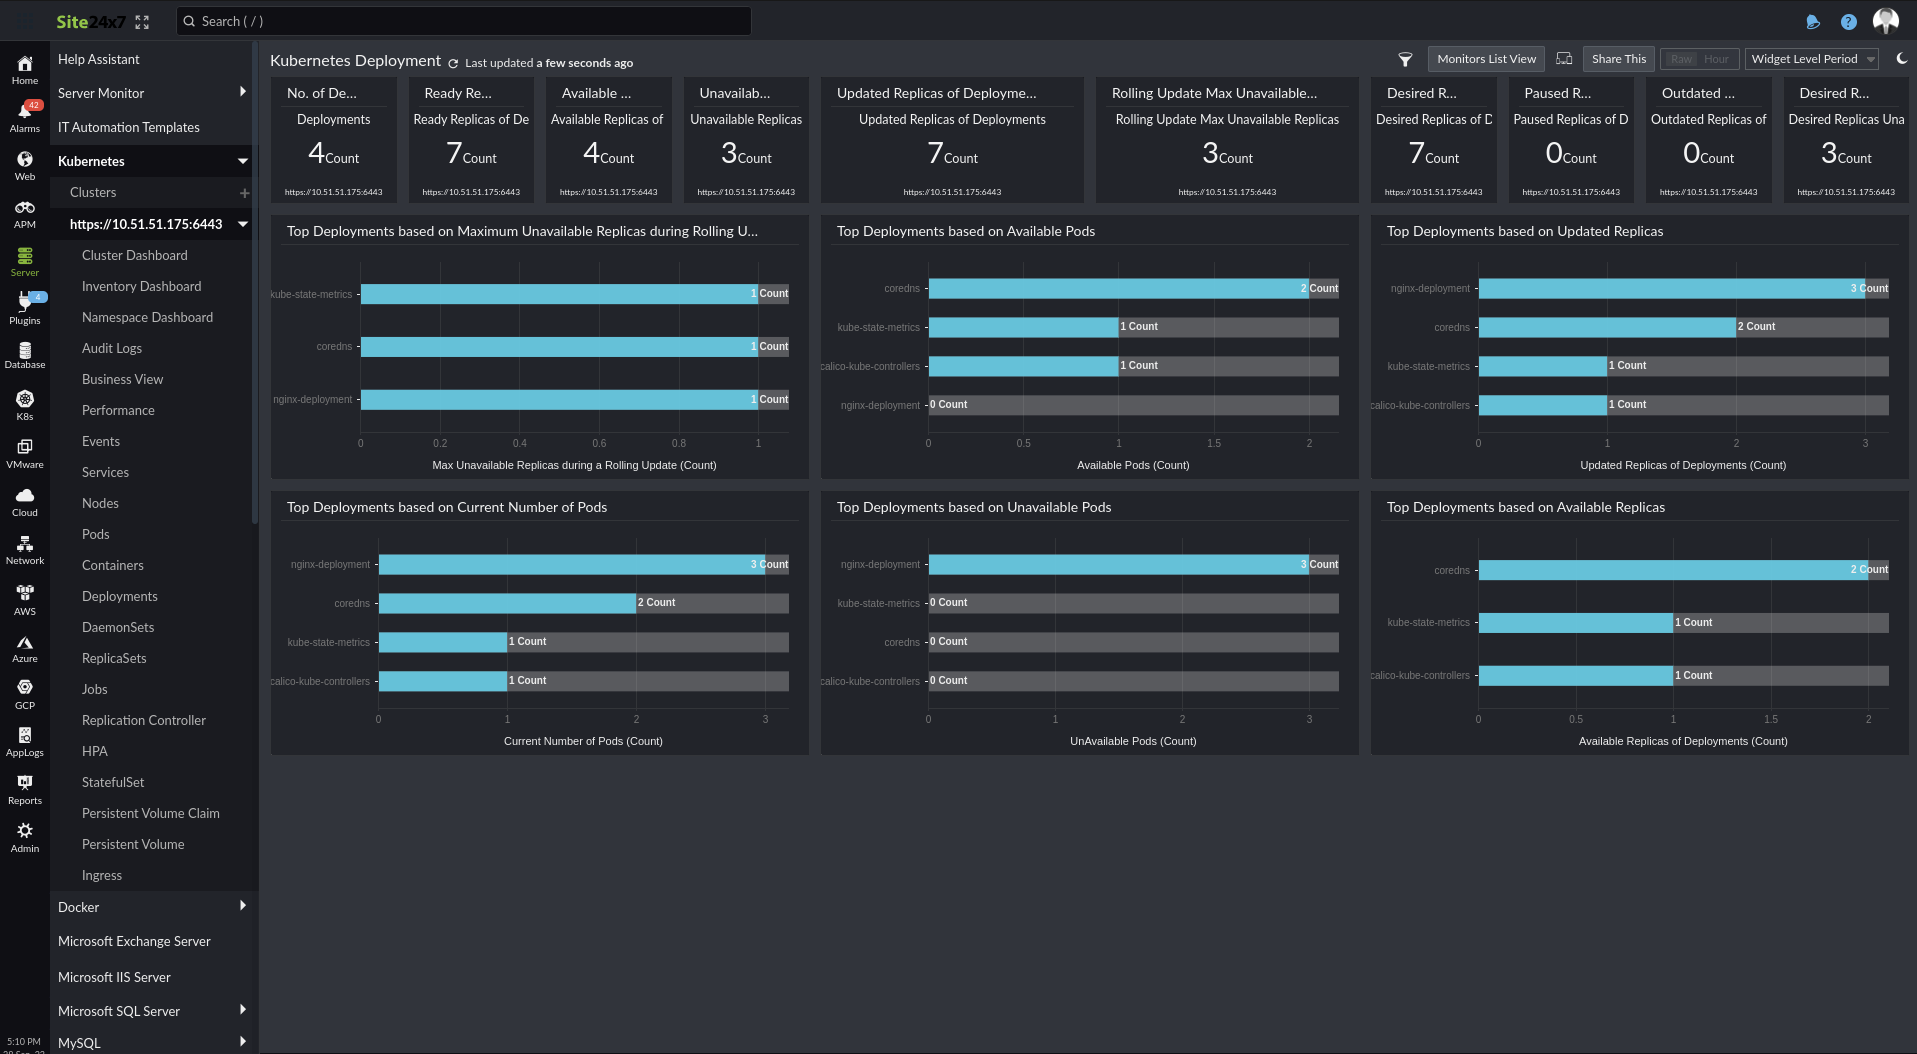
Go to Server > Kubernetes > click the deployment. The Kubernetes Deployment dashboard opens by default. To view the list view, click the Monitors List View button and to toggle back to the dashboard view, click the icon. The Kubernetes Deployment dashboard gives you a list view of the various metrics of the Kubernetes Deployments namely:
- Total deployments
- Ready Replicas
- Available Replicas
- Unavailable Replicas
- Updated Replicas
- Rolling Update Maximum Unavailable Replicas
- Desired Replicas
- Replicas Paused
- Replicas Outdated
- Desired Replicas Unavailable
- Top deployments based on
- Maximum Unavailable Replicas
- Available Pods
- Updated Replicas
- Current number of Pods
- Available Replicas
- Updated Replicas
- Unavailable Pods
DaemonSets dashboard
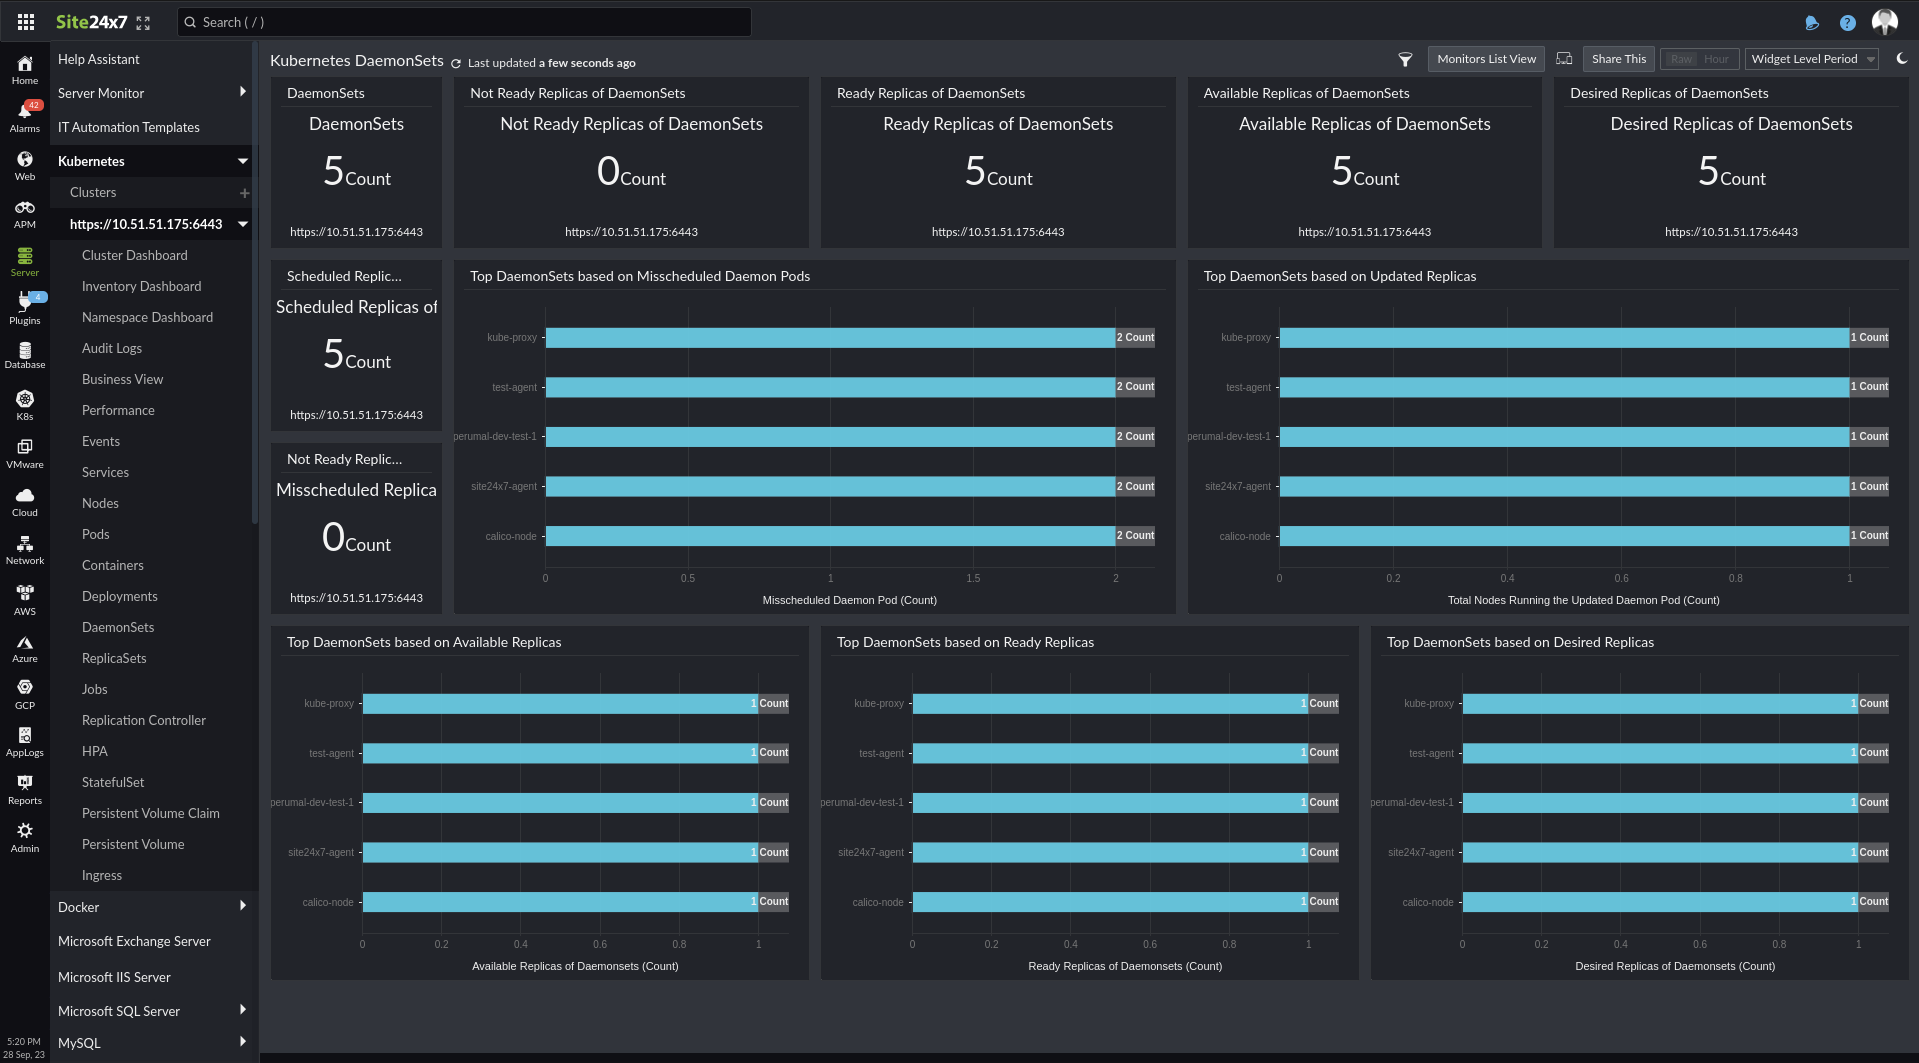
Go to Server > Kubernetes > click the DaemonSet. The Kubernetes DaemonSets dashboard opens by default. To view the list view, click the Monitors List View button and to toggle back to the dashboard view, click the icon. The Kubernetes DaemonSet dashboard gives you a list view of the various metrics of the Kubernetes DaemonSet namely:
- Total DaemonSets
- Metrics of Replicas that are
- Not Ready
- Ready
- Available
- Desired
- Scheduled
- Misscheduled
- Top DaemonSets based on
- Misscheduled Daemon Pods
- Updated Replicas
- Available Replicas
- Ready Replicas
- Desired Replicas
- Ready State Daemon Pods
- Desired Daemon Pods
ReplicaSets dashboard
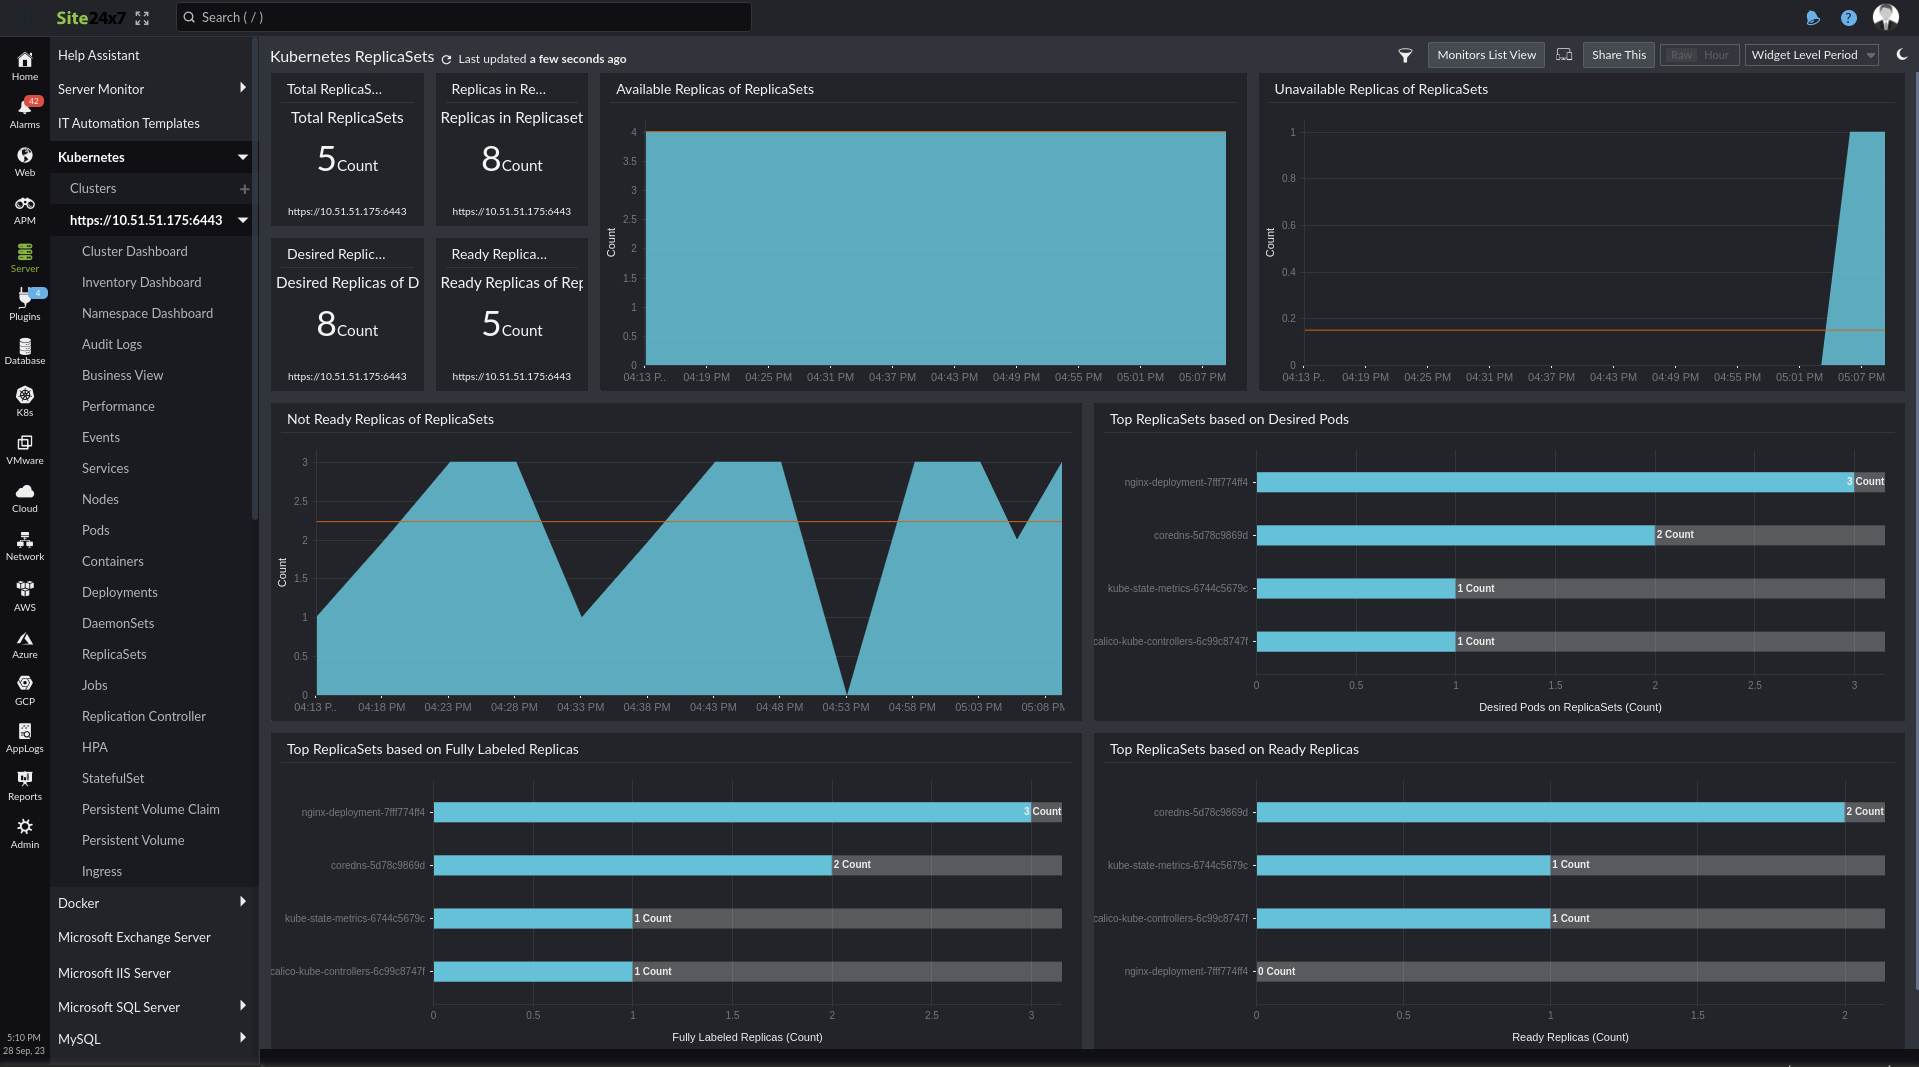
Go to Server > Kubernetes > click the ReplicaSet. The Kubernetes ReplicaSets dashboard opens by default. To view the list view, click the Monitors List View button and to toggle back to the dashboard view, click the icon. The Kubernetes ReplicaSetdashboard gives you a list view of the various metrics of the Kubernetes ReplicaSet namely:
- General statistics about ReplicaSet
- Total Count
- Availability %
- Desired Replicas
- Ready Replicas
- Not ready Replicas
- Count of available Replicas
- Count of unavailable Replicas
- Top ReplicaSets based on
- Fully Labeled Replicas
- Ready Replicas
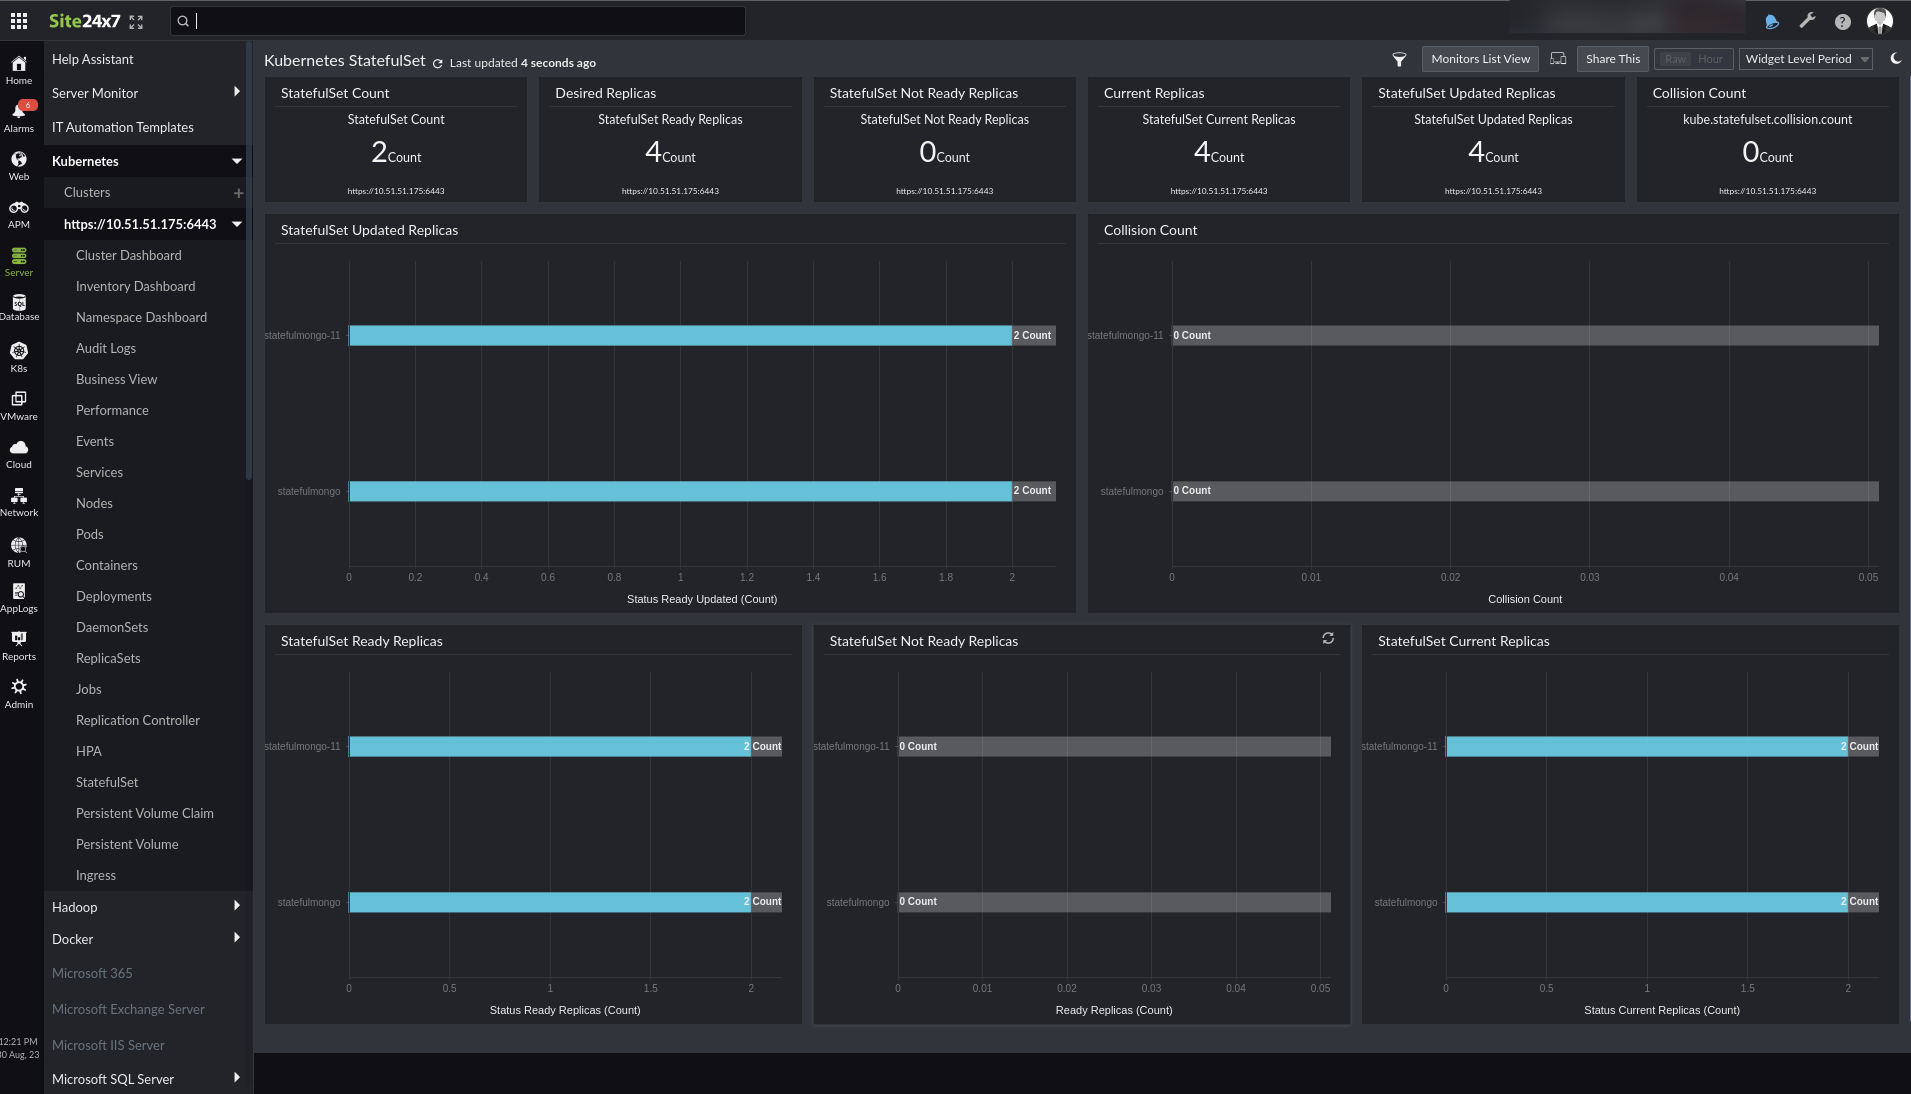
StatefulSets dashboard
Go to Server > Kubernetes and click the required StatefulSet. The StatefulSet dashboard will open by default. To view the list of StatefulSets, click the Monitors List View button at the top-right.
Supported agent version: 19.1.0 and above
The StatefulSet dashboard gives you a list view of the various metrics of the Kubernetes StatefulSet, namely:
- StatefulSet Count
- Desired Replicas
- Not Ready Replicas
- Current Replicas
- Updated Replicas
- Collision Count
Charts:
- Top StatefulSet Based on Updated Replicas
- Top StatefulSet Based on Collision Count
- Top StatefulSet Based on Ready Replicas
- Top StatefulSet Based on Not Ready Replicas
- Top StatefulSet Based on Current Replicas
