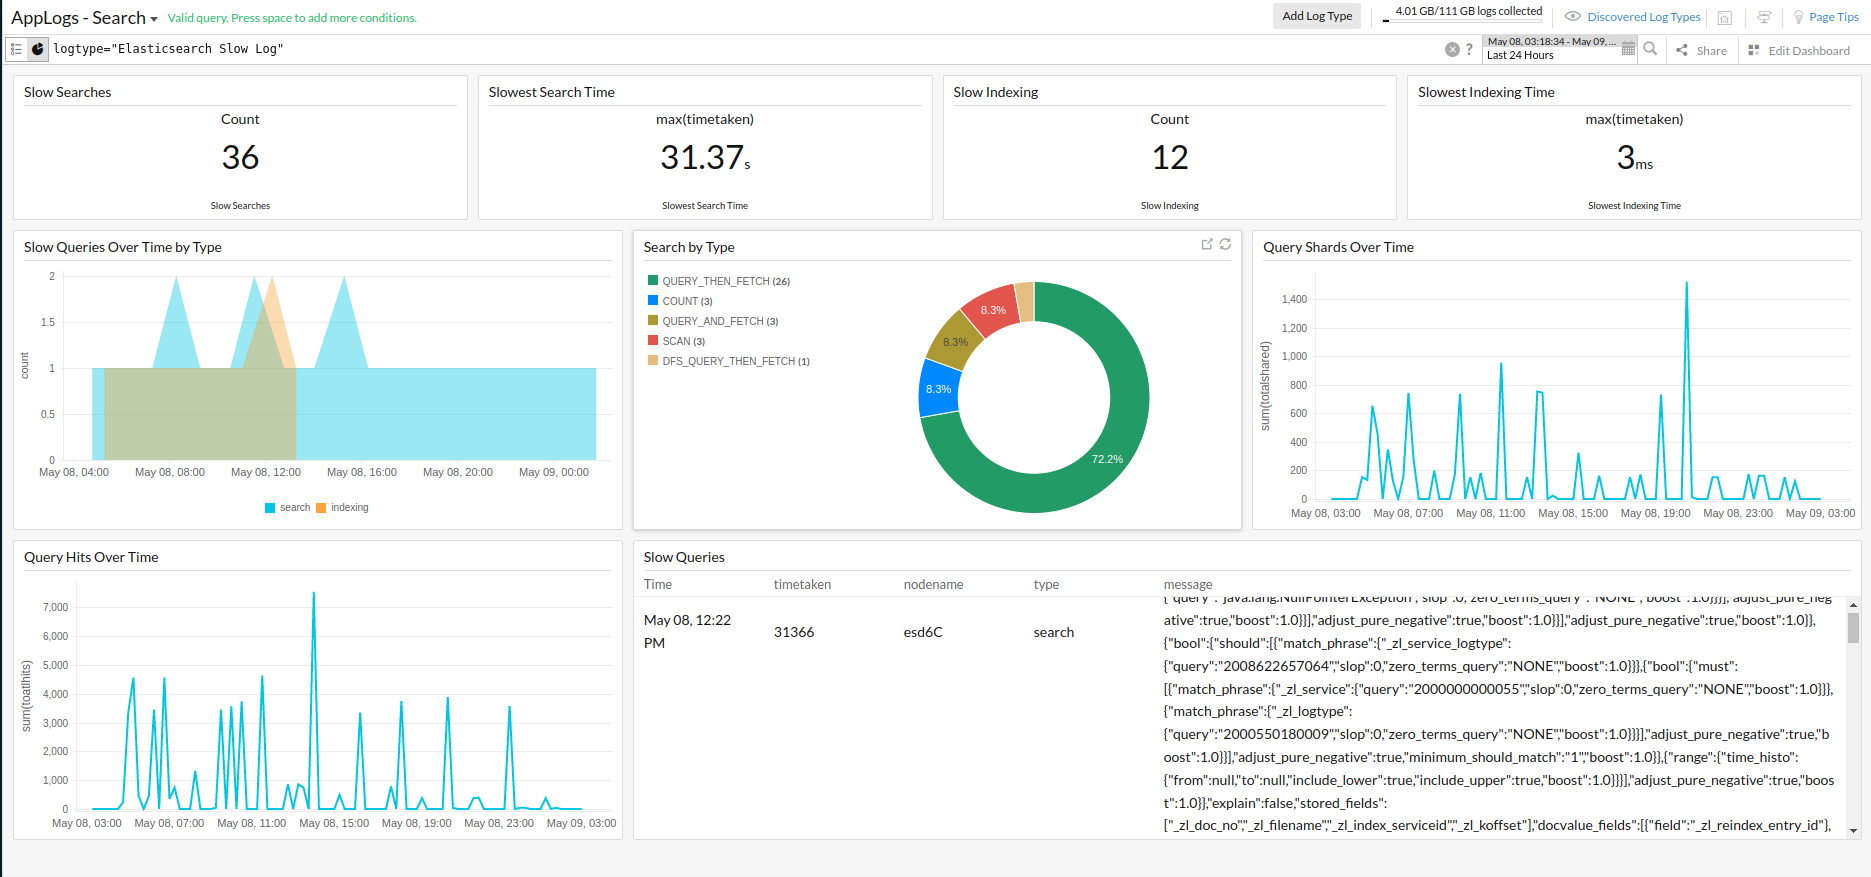
Elasticsearch Slow Logs
Searching and indexing are the two main request types in Elasticsearch, and enabling the Elasticsearch slow logs will help you identify the problematic indices. Configure slow logs thresholds in your Elasticsearch indices and monitor the slow search and index logs using Site24x7's AppLogs. Our exclusive dashboard helps you figure out the ideal queries for optimization.
Enabling Elasticsearch slow logs
By default, slow logs are disabled in Elasticsearch. To enable logging, you must configure the Elasticsearch index settings API and set a threshold value for slow search or index logs. There are three kinds of thresholds that you can define:
- Index (index)
- The query phase of the search (query)
- The fetch phase of the search (fetch)
To enable logging for slow search logs:
Query and fetch are the two main phases of the search process, and you can set the threshold for both phases of the execution.
curl -X PUT "<Elasticsearch_domain>/<Index>/_settings?pretty" -H 'Content-Type: application/json' -d' {
 "index.search.slowlog.threshold.query.warn": "0ms",
 "index.search.slowlog.threshold.query.info": "0ms",
 "index.search.slowlog.threshold.query.debug": "0ms",
 "index.search.slowlog.threshold.query.trace": "0ms",
 "index.search.slowlog.threshold.fetch.warn": "0ms",
 "index.search.slowlog.threshold.fetch.info": "0ms",
 "index.search.slowlog.threshold.fetch.debug": "0ms",
 "index.search.slowlog.threshold.fetch.trace": "0ms"
}'
To enable logging for slow index logs:
curl -X PUT "<Elasticsearch_domain>/<Index>/_settings?pretty" -H 'Content-Type: application/json' -d' {
 "index.indexing.slowlog.threshold.index.warn": "0ms",
 "index.indexing.slowlog.threshold.index.info": "0ms",
 "index.indexing.slowlog.threshold.index.debug": "0ms",
 "index.indexing.slowlog.threshold.index.trace": "0ms",
 "index.indexing.slowlog.level": "trace",
 "index.indexing.slowlog.source": "1000"
}'
Make sure to specify your Elasticsearch_domain (Eg: localhost:9200) and Index in the above queries. If you want to enable these settings for all indices, use * or _all for the Index. Setting the threshold limit as 0ms will log everything and affect the performance as a result. Set the threshold limit appropriately, as any searching or indexing that takes longer than a set threshold will be logged.
Getting started with log management
- Log in to your Site24x7 account.
- Download and install the Site24x7 Server monitoring agent (Windows | Linux).
- Go to Admin > AppLogs > Log Profile, and click Add Log Profile.
- Profile Name: Enter a name for your Log Profile.
- Choose the Log Type: Choose Elasticsearch slow logs from the drop-down menu.
- Log Source: Choose Local File from the drop-down menu.
- List of files to search for logs: Include the below files:
/var/log/elasticsearch/*_index_indexing_slowlog*.log
/var/log/elasticsearch/*_index_search_slowlog*.log - Select the server, and click Save.
Log pattern
[$DateTime:date$][$LogLevel$][index.$Type$.slowlog.$Phase$.$NodeId$] [$NodeName$] [$Index$]![$Shard$]! took[*], took_millis[$TimeTaken:number$], !type[*], id[*], routing[*],!!total_hits[$TotalHits:number$], types[$Types$], stats[$Stats$], search_type[$SearchType$], total_shards[$TotalShared:number$],! source[$Message$
This is the default pattern defined by Site24x7 for parsing Elasticsearch slow logs based on the sample mentioned below.
Sample logs
The following are sample logs for the index and search (fetch and query phase) slow logs:
[2022-09-18T01:28:13,358][WARN ][index.indexing.slowlog.index.Y37CmUvQSi2jgtzN_-6K1A] [esd6C] [10772528_2000326507563_2000550180009_16_202/Y37CmUvQSi2jgtzN_-6K1A] took[1.5ms], took_millis[1], type[-1], id[Jcvyl4ABjtHtfc2jfkMH], routing[0], source[{"2002351591637":"367550","2002681248211":563,"2002351591639":215,"_zl_secs_to_millis":197]
[2022-09-18T00:57:14,861][WARN ][index.search.slowlog.fetch.tWO5cHxMRrGW3VuwRhIwYQ] [esd2C] [10772528_-1_-1_21_864][3] took[85.3micros], took_millis[0], total_hits[3456], types[some_type], stats[], search_type[QUERY_THEN_FETCH], total_shards[195], source[{"query":{"query_string":{"query":"*"}},"from":0,"size":"24","sort":{"updated_at":"desc"}}], extra_source[],
[2022-09-18T02:19:14,861][WARN ][index.search.slowlog.query.tWO5cHxMRrGW3VuwRhIwYQ] [esd2C] [10772528_-1_-1_21_864][0] took[25.3s], took_millis[2366], total_hits[3456], types[], stats[], search_type[QUERY_THEN_FETCH], total_shards[123], source[{"query":{"query_string":{"query":"*"}},"from":0,"size":"24","sort":{"updated_at":"desc"}}], id[],
The sample log above can be separated into the following fields, each of which will take its respective value from here and will then be uploaded to Site24x7.
| Field name | Field value |
| DateTime | 2022-09-18T02:19:14,861 |
| LogLevel | WARN |
| Type | search |
| Phase | query |
| NodeId | tWO5cHxMRrGW3VuwRhIwYQ |
| NodeName | esd2C |
| Index | 10772528_-1_-1_21_864 |
| Shard | 0 |
| TimeTaken (ms) |
2366 |
| TotalHits | 3456 |
| Types | |
| Stats | |
| SearchType | QUERY_THEN_FETCH |
| TotalShared | 123 |
| Message | {"query":{"query_string":{"query":"*"}},"from":0,"size":"24","sort":{"updated_at":"desc"}}], id[], |
Elasticsearch slow logs dashboard
AppLogs creates an exclusive dashboard for every Log Type, and shows a few widgets by default. Here's a list of the widgets available in the Elasticsearch slow logs dashboard:
- Slow Searches
- Slowest Search Time
- Slow Indexing
- Slowest Indexing Time
- Slow Queries Over Time by Type
- Search by Type
- Query Shards Over Time
- Query Hits Over Time
- Slow Queries

