Field Explorer
The Field Explorer helps you quickly analyze and refine your log data without manually editing queries. It displays the most frequent field values (e.g., domain_name, scheme) of your chosen Log Type, so you can instantly filter or drill down into specific log data.
From the indexed Log Type, the Field Explorer displays your user-defined fields along with their most frequently occurring unique values based on the specified time frame applied to your search. By selecting or deselecting values, you can dynamically modify your query and view real-time results. This makes troubleshooting faster and more intuitive for complex log datasets.

Why do you need a Field Explorer?
The Field Explorer is designed to support both qualitative and quantitative data analysis. You can use it in your logs to:
-
Gain an overview of the data and predominant values of a field within the search time.
-
Get an instant summary of all the logs collected during a specific time frame or from a selected subset of hosts, instead of manually checking the logs one by one.
-
Precisely filter out irrelevant data and focus on significant events or values in your logs, enabling a clearer view of recurring patterns and anomalies based on your specified search criteria.
Use case
Below are key use cases that highlight the Field Explorer's practical value:
-
Identify frequent error patterns: IT teams can quickly view the logs placed within the top five severity levels, such as INFO, WARN, and ERROR. By selecting specific values, they can isolate frequent errors or warnings and understand recurring failure points.
-
Conduct security checks: Teams can detect unusual traffic from specific IPs or user agents to identify potential abuse or injection attempts. They can also track response time to identify slow-performing APIs or bottlenecks in data submission processes.
-
Filter logs for targeted analysis: Users can interactively filter logs using fields such as severity, application, or region without writing complex query syntax. This simplifies focusing on a particular environment, deployment, or service.
-
Enhancing dashboard views and alerts: By narrowing down relevant fields through the Field Explorer, users can refine queries into dashboards or alerts, ensuring only meaningful log segments trigger notifications.

How to access the Field Explorer
You can view the Field Explorer for your queries through a few simple steps:
-
Log in to your Site24x7 account, create a Log Type, and associate it with a Log Profile.
-
Navigate to the AppLogs tab.
-
Enter a search query, for instance: logtype="Nginx Access Logs".
-
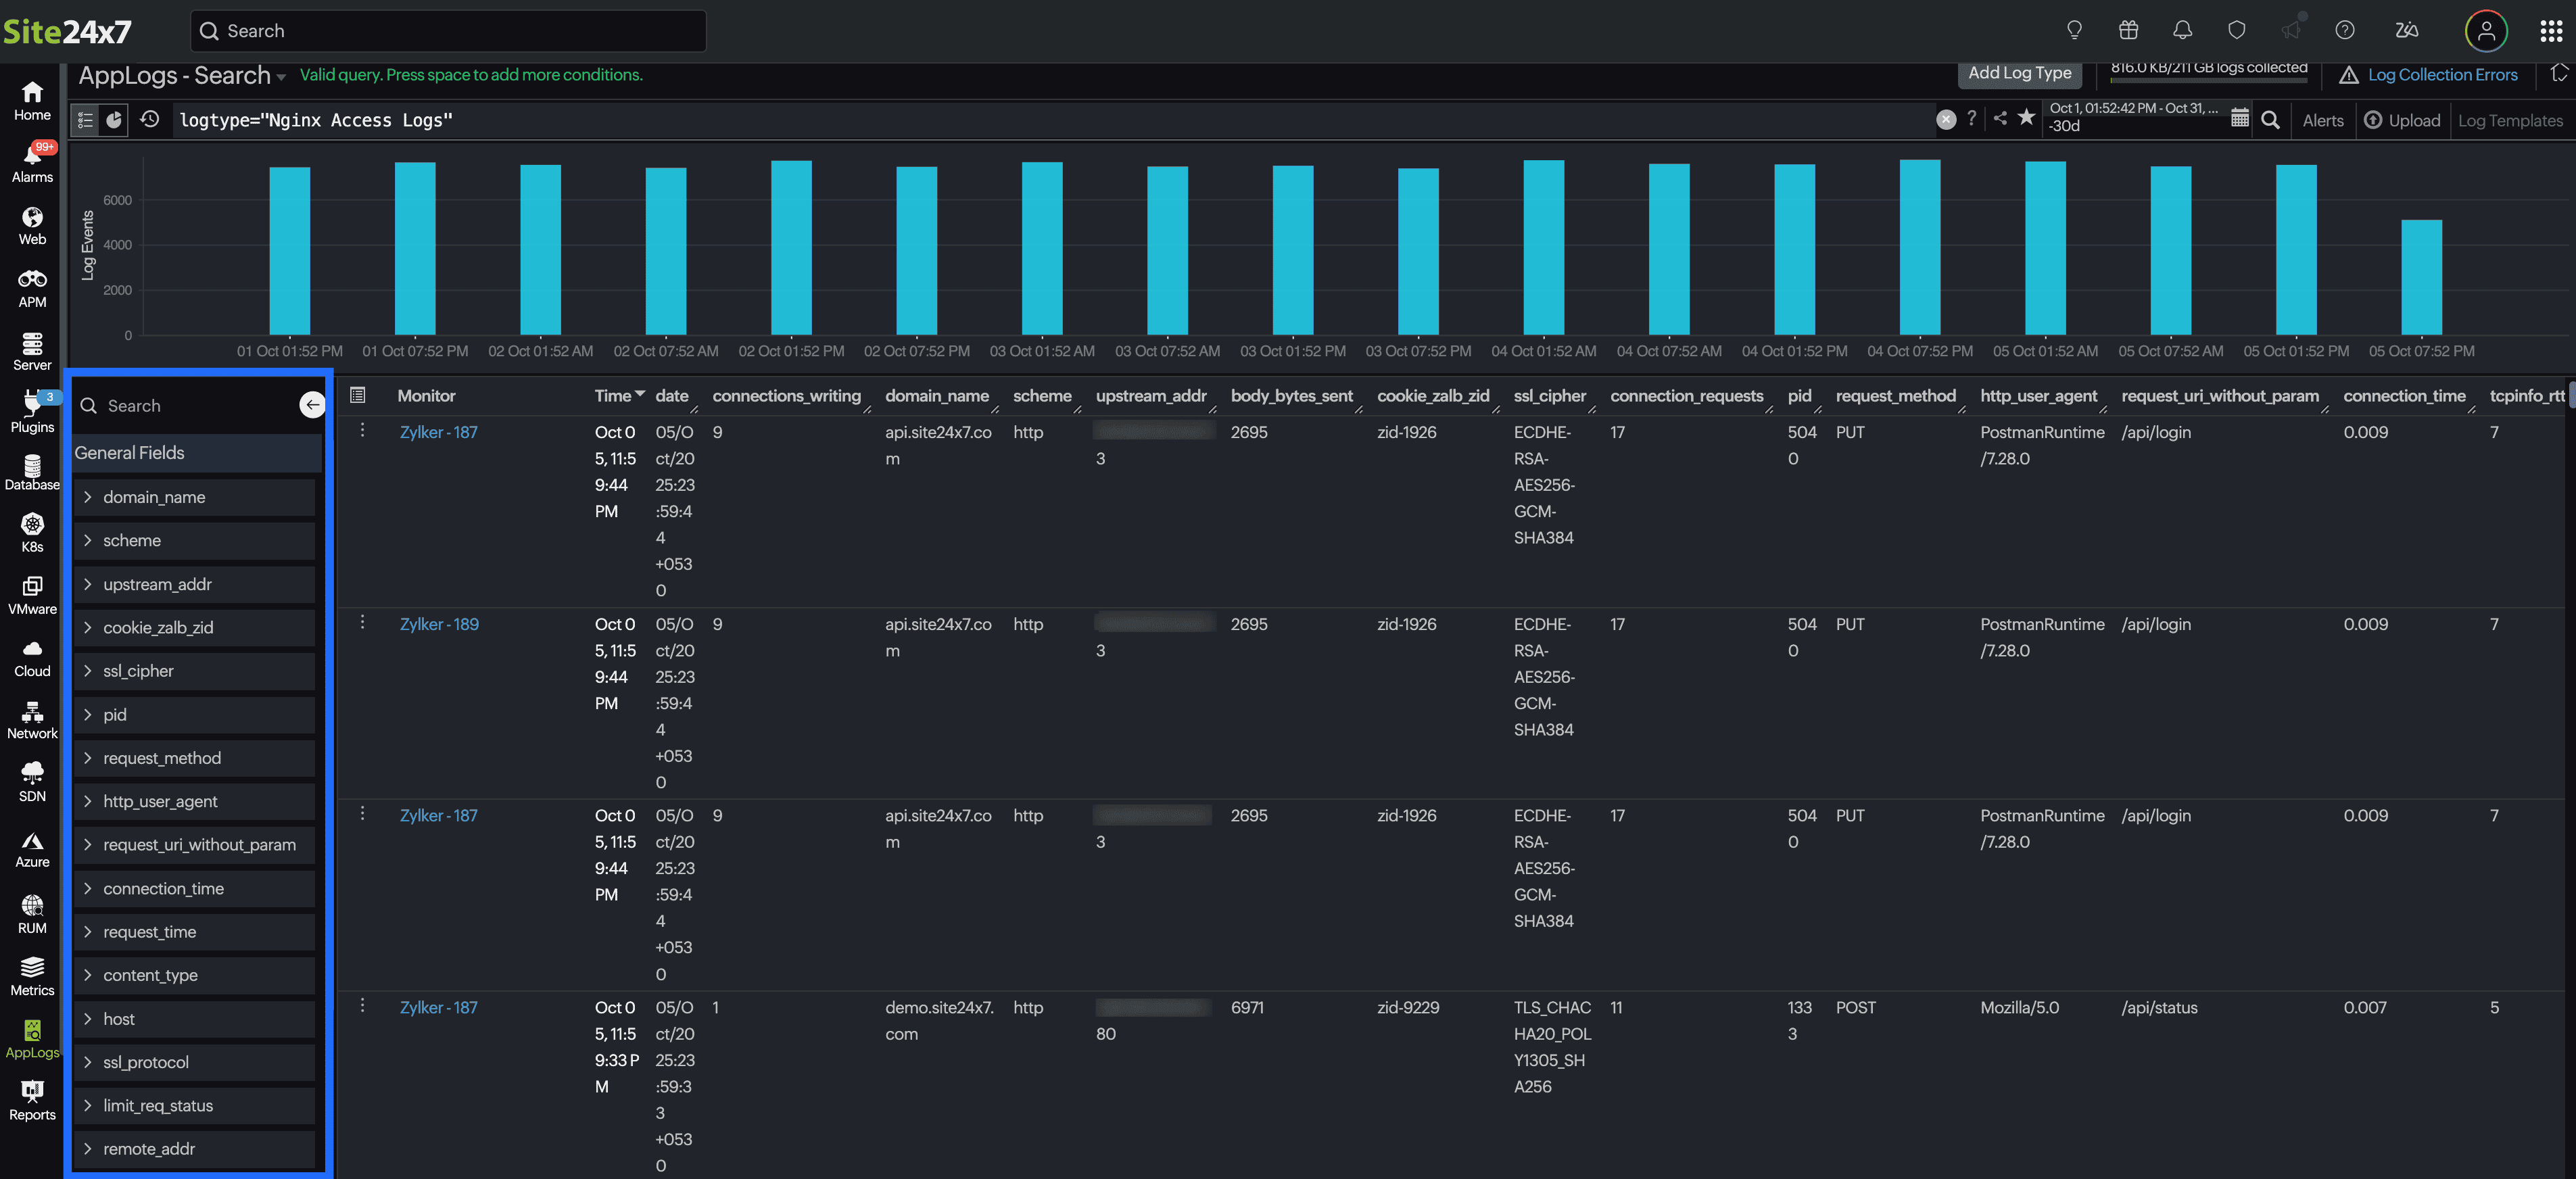
Upon the display of the log results, you can access the Field Explorer located in the left corner of the sample log output table. This feature allows you to view a list of fields associated with the indexed Log Type in both searchable and checklist format.
Click on the back icon ![]() to conceal the Field Explorer when it is no longer in use.
to conceal the Field Explorer when it is no longer in use.

How to use the Field Explorer
When you open the Field Explorer, based on your log type, it automatically displays the top values for each field, such as the most frequent severity levels, thread names, and components. You can select a field name to have it automatically added to the search query, enabling a more focused and insightful analysis.
Let's say you have a list of logs collected under the log type "Nginx Access Logs" and are viewing it through AppLog search.
Sample log
{
    "body_bytes_sent": 7315,
    "host": "site24x7.com",
    "http_user_agent": "Mozilla/5.0",
    "limit_req_status": "-",
    "request_method": "GET",
    "remote_addr": "20.133.25.81",
    "request_id": "req-8903",
    "request_length": 137,
    "request_time": 0.689,
    "request_uri_without_param": "/profile",
    "scheme": "http",
    "status": 301,
    "domain_name": "site24x7.com",
    "ssl_server_name": "site24x7.com",
    "server_protocol": "HTTP/2",
    "ssl_protocol": "TLSv1.3",
    "ssl_cipher": "TLS_AES_256_GCM_SHA384",
    "upstream_addr": "77.150.166.109:8080",
    "upstream_response_time": 0.277,
    "tcpinfo_rtt": 5,
    "tcpinfo_rttvar": 5,
    "tcpinfo_snd_cwnd": 160,
    "tcpinfo_rcv_space": 282,
    "pid": 5518,
    "connections_active": 34,
    "connections_reading": 3,
    "connection_requests": 7,
    "connections_writing": 1,
    "connections_waiting": 5,
    "connection": 9513,
    "connection_time": 0.008,
    "content_type": "application/json",
    "date": "29/Sep/2025:07:23:50 +0530"
 }
In this scenario, you observe a surge in logs with the POST and PUT request methods. From here you can:
-
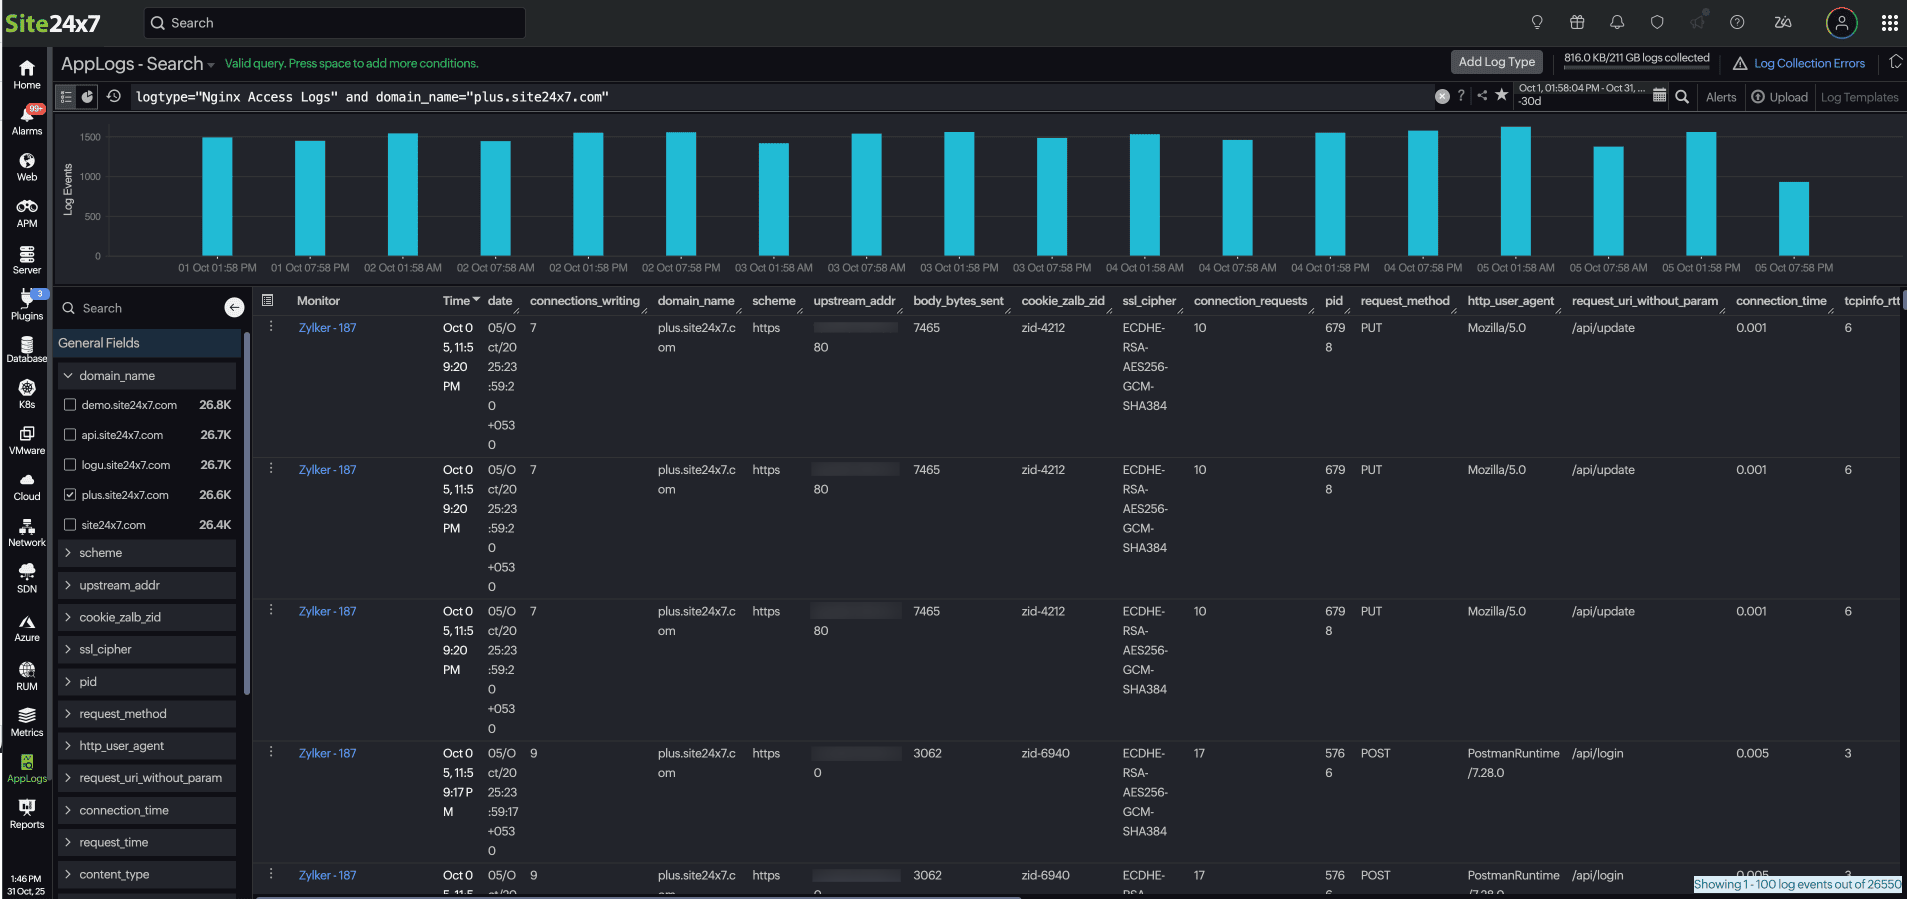
Apply a filter: In the Field Explorer, select the domain_name field to focus on a specific domain.
-
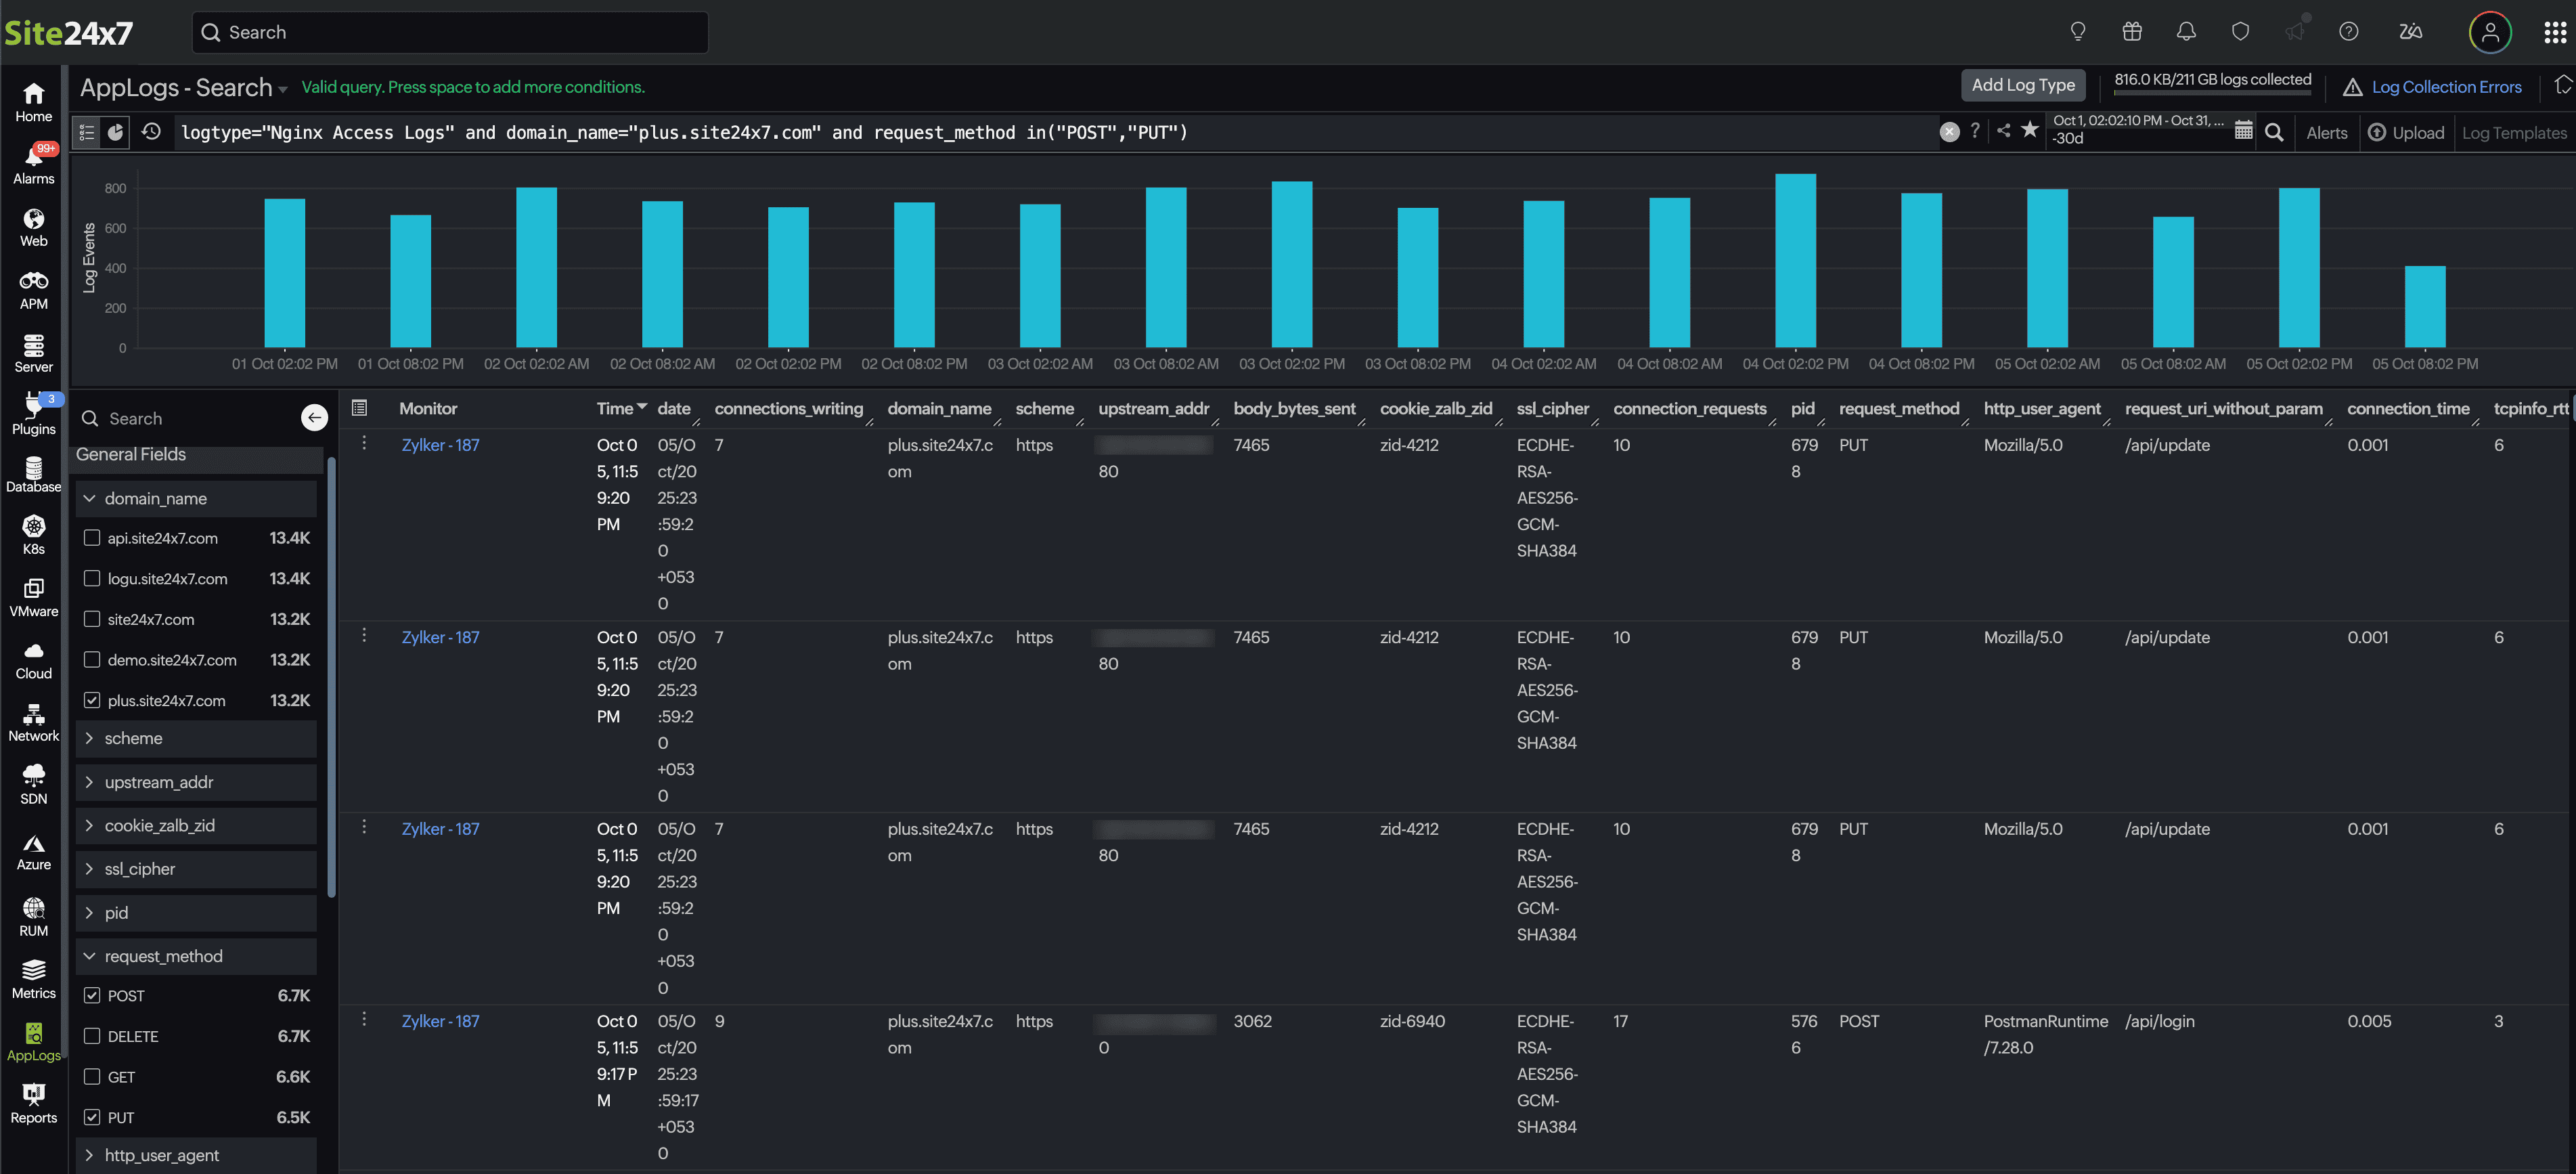
Drill down further: From the request_method field, choose POST and PUT to isolate those requests.
-
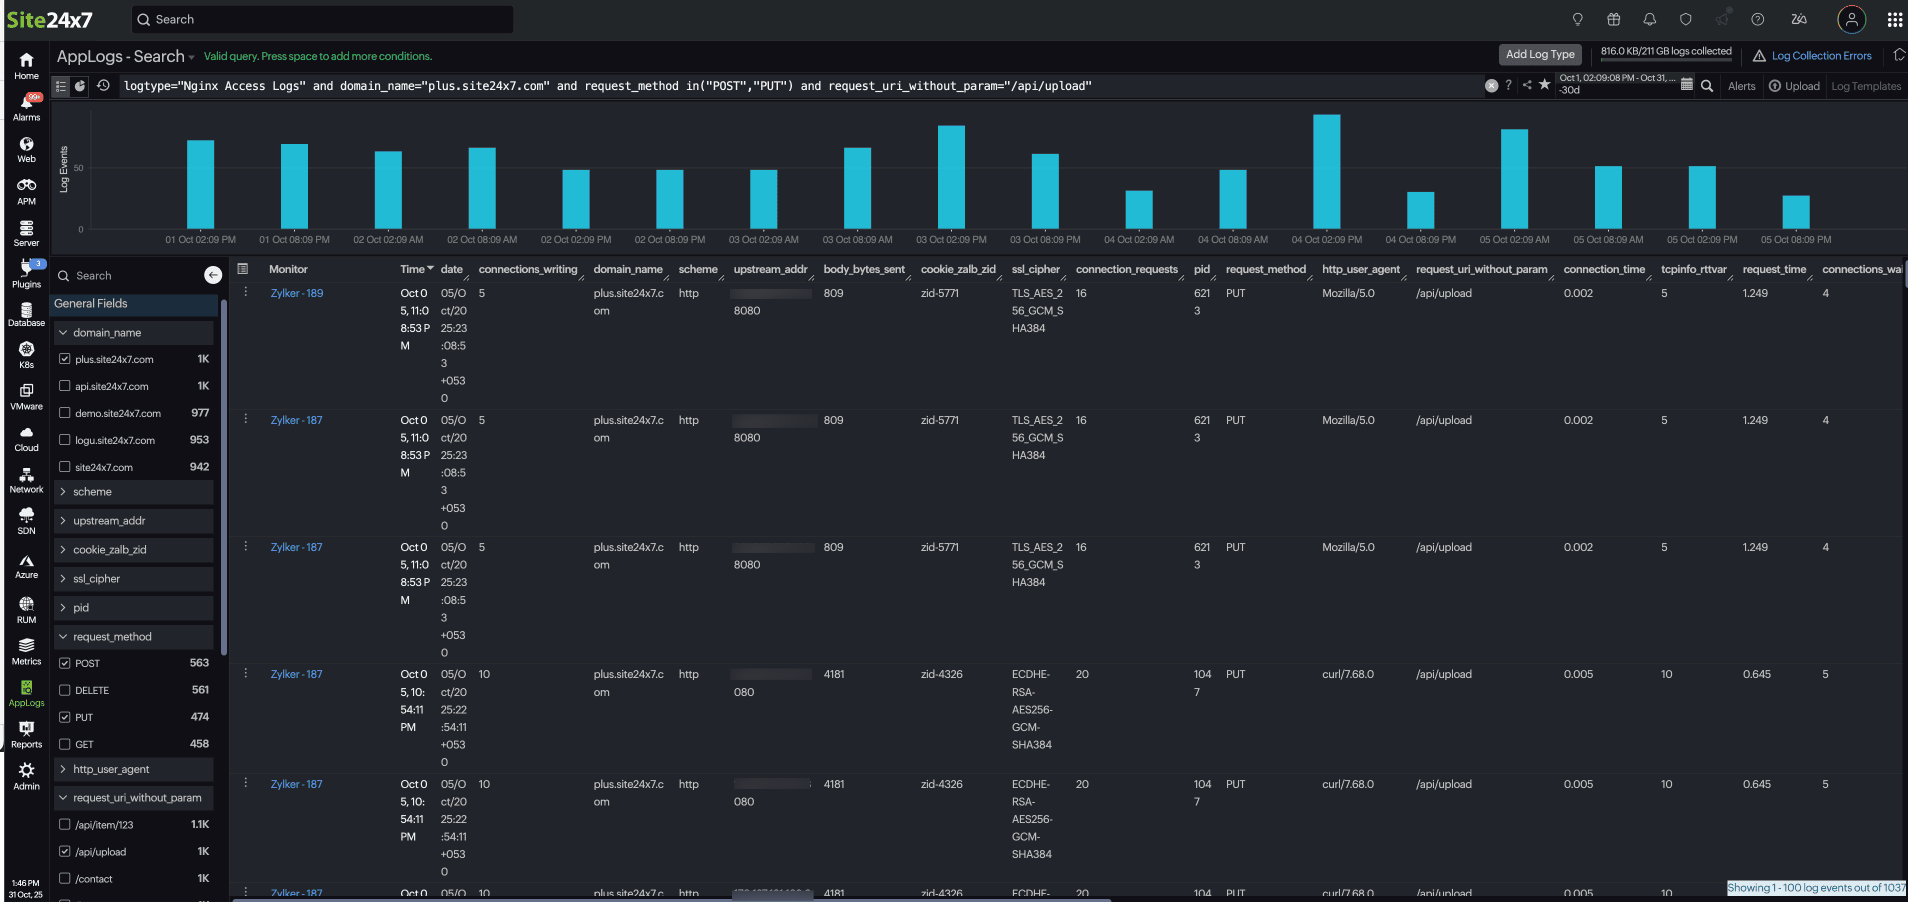
Refine and analyze: Allow the query to update dynamically.
For example:This instantly displays only relevant logs, helping you track the POST and PUT requests to "/api/upload" on "plus.site24x7.com" to measure upload performance and latency.logtype="Nginx Access Logs" and server_name="plus.site24x7.com" and request_method in("POST","PUT") and request_uri_without_param="/api/upload"

You can create or modify queries either through the query language or the Field Explorer. This update allows you to drill down into logs efficiently using either method.
