Network logs collection via On-Premise Poller
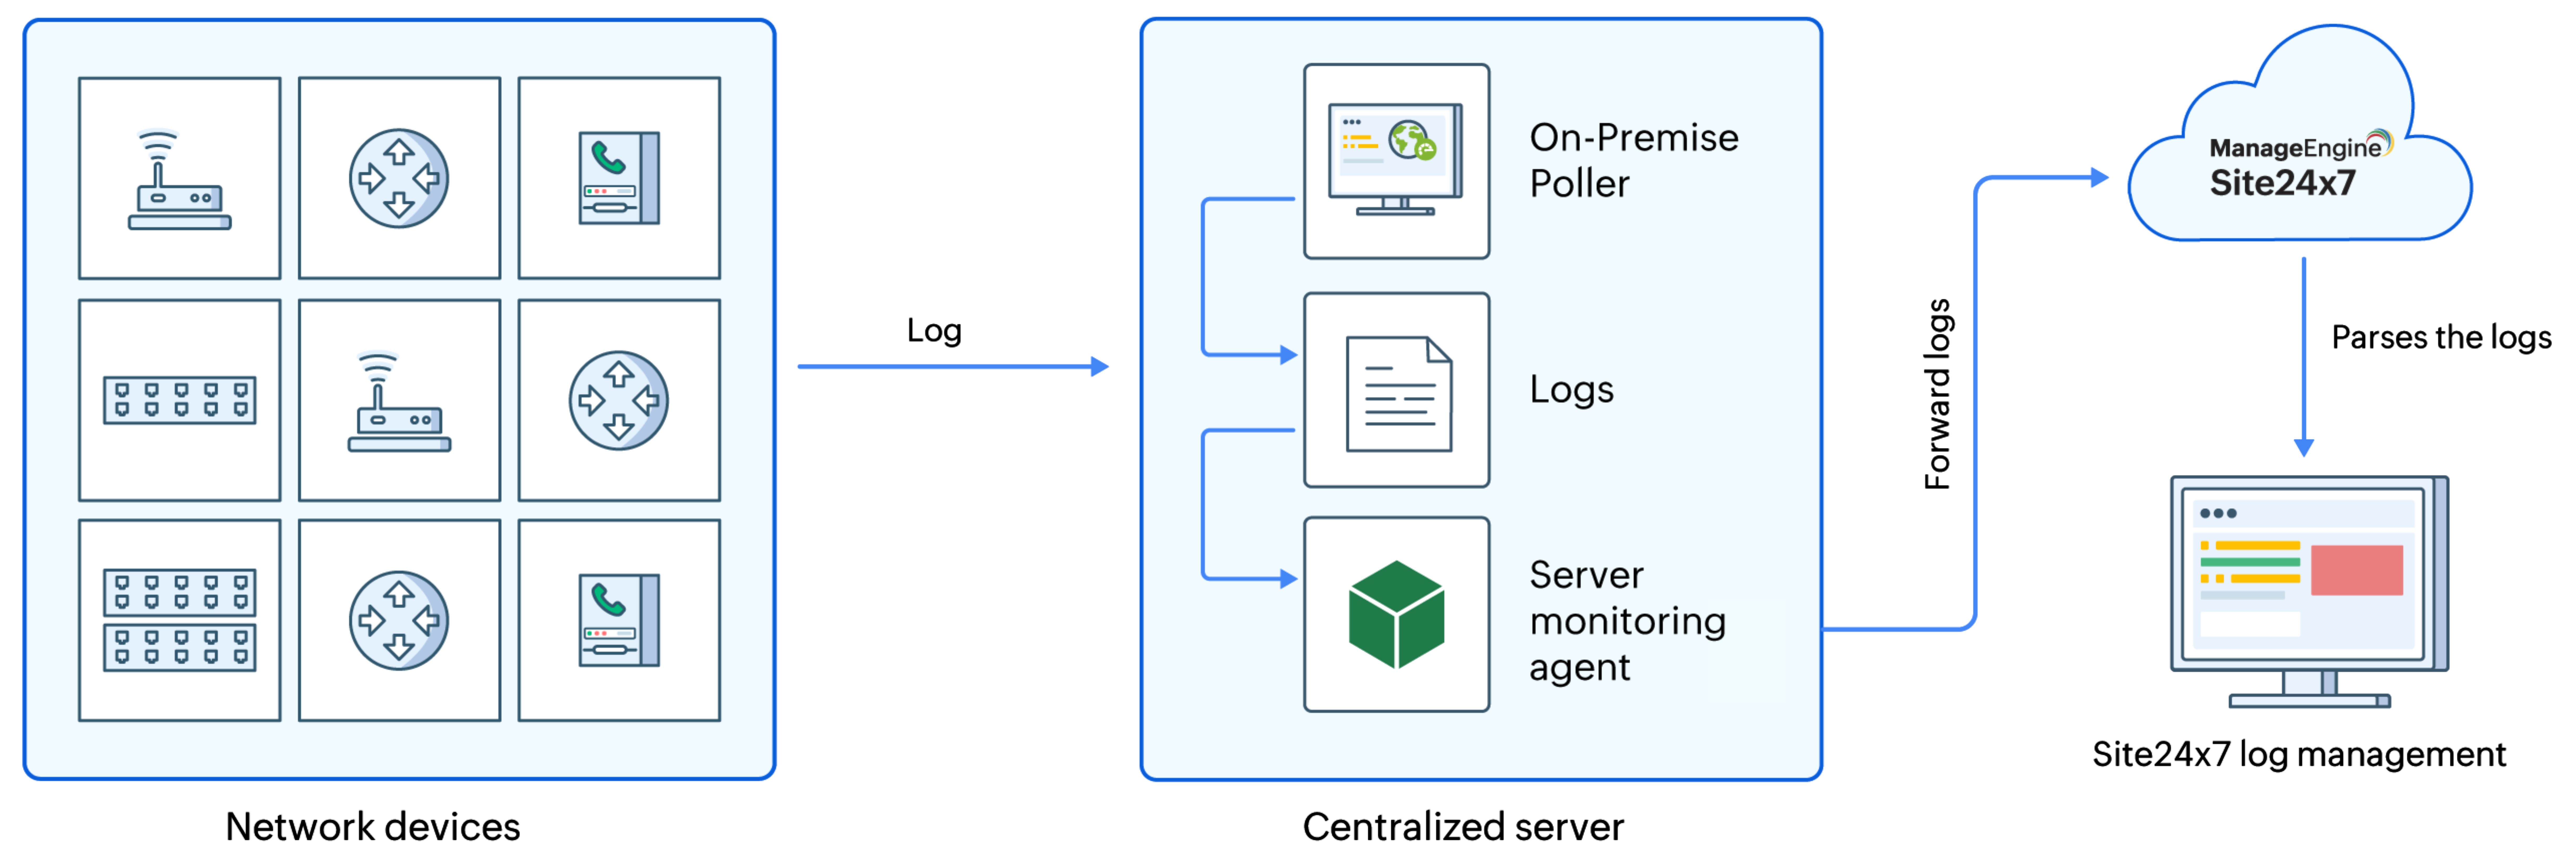
Centralized logging is essential for real-time monitoring, troubleshooting, and auditing data across distributed network environments. Site24x7 enables log collection from multiple network devices by using an On-Premise Poller.
This setup enables you to receive and monitor logs forwarded from different devices (such as firewalls, routers, and switches) to a centralized server.
This feature is currently enabled only on demand. Please contact our support team to activate it.
How it works
There are two levels of configuration required:
-
Server-level configuration: The central server should have both the On-Premise Poller and the Site24x7 server agent installed. The On-Premise Poller is responsible for capturing the logs and writing them to a local file. The agent then reads this file, parses the data, and sends it to Site24x7 for monitoring.
-
Device-level configuration: Each device must be set up to forward logs to the remote server on the specified port.

Prerequisites
To start receiving logs, install both the On-Premise Poller and the Site24x7 server monitoring agent on the log receiver server (Windows or Linux). The On-Premise Poller listens on the specified port (e.g., UDP 514), and the agent processes and forwards the data.
-
Install the On-Premise Poller (Linux | Windows)
-
Install the server monitoring agent (Linux | Windows)
-
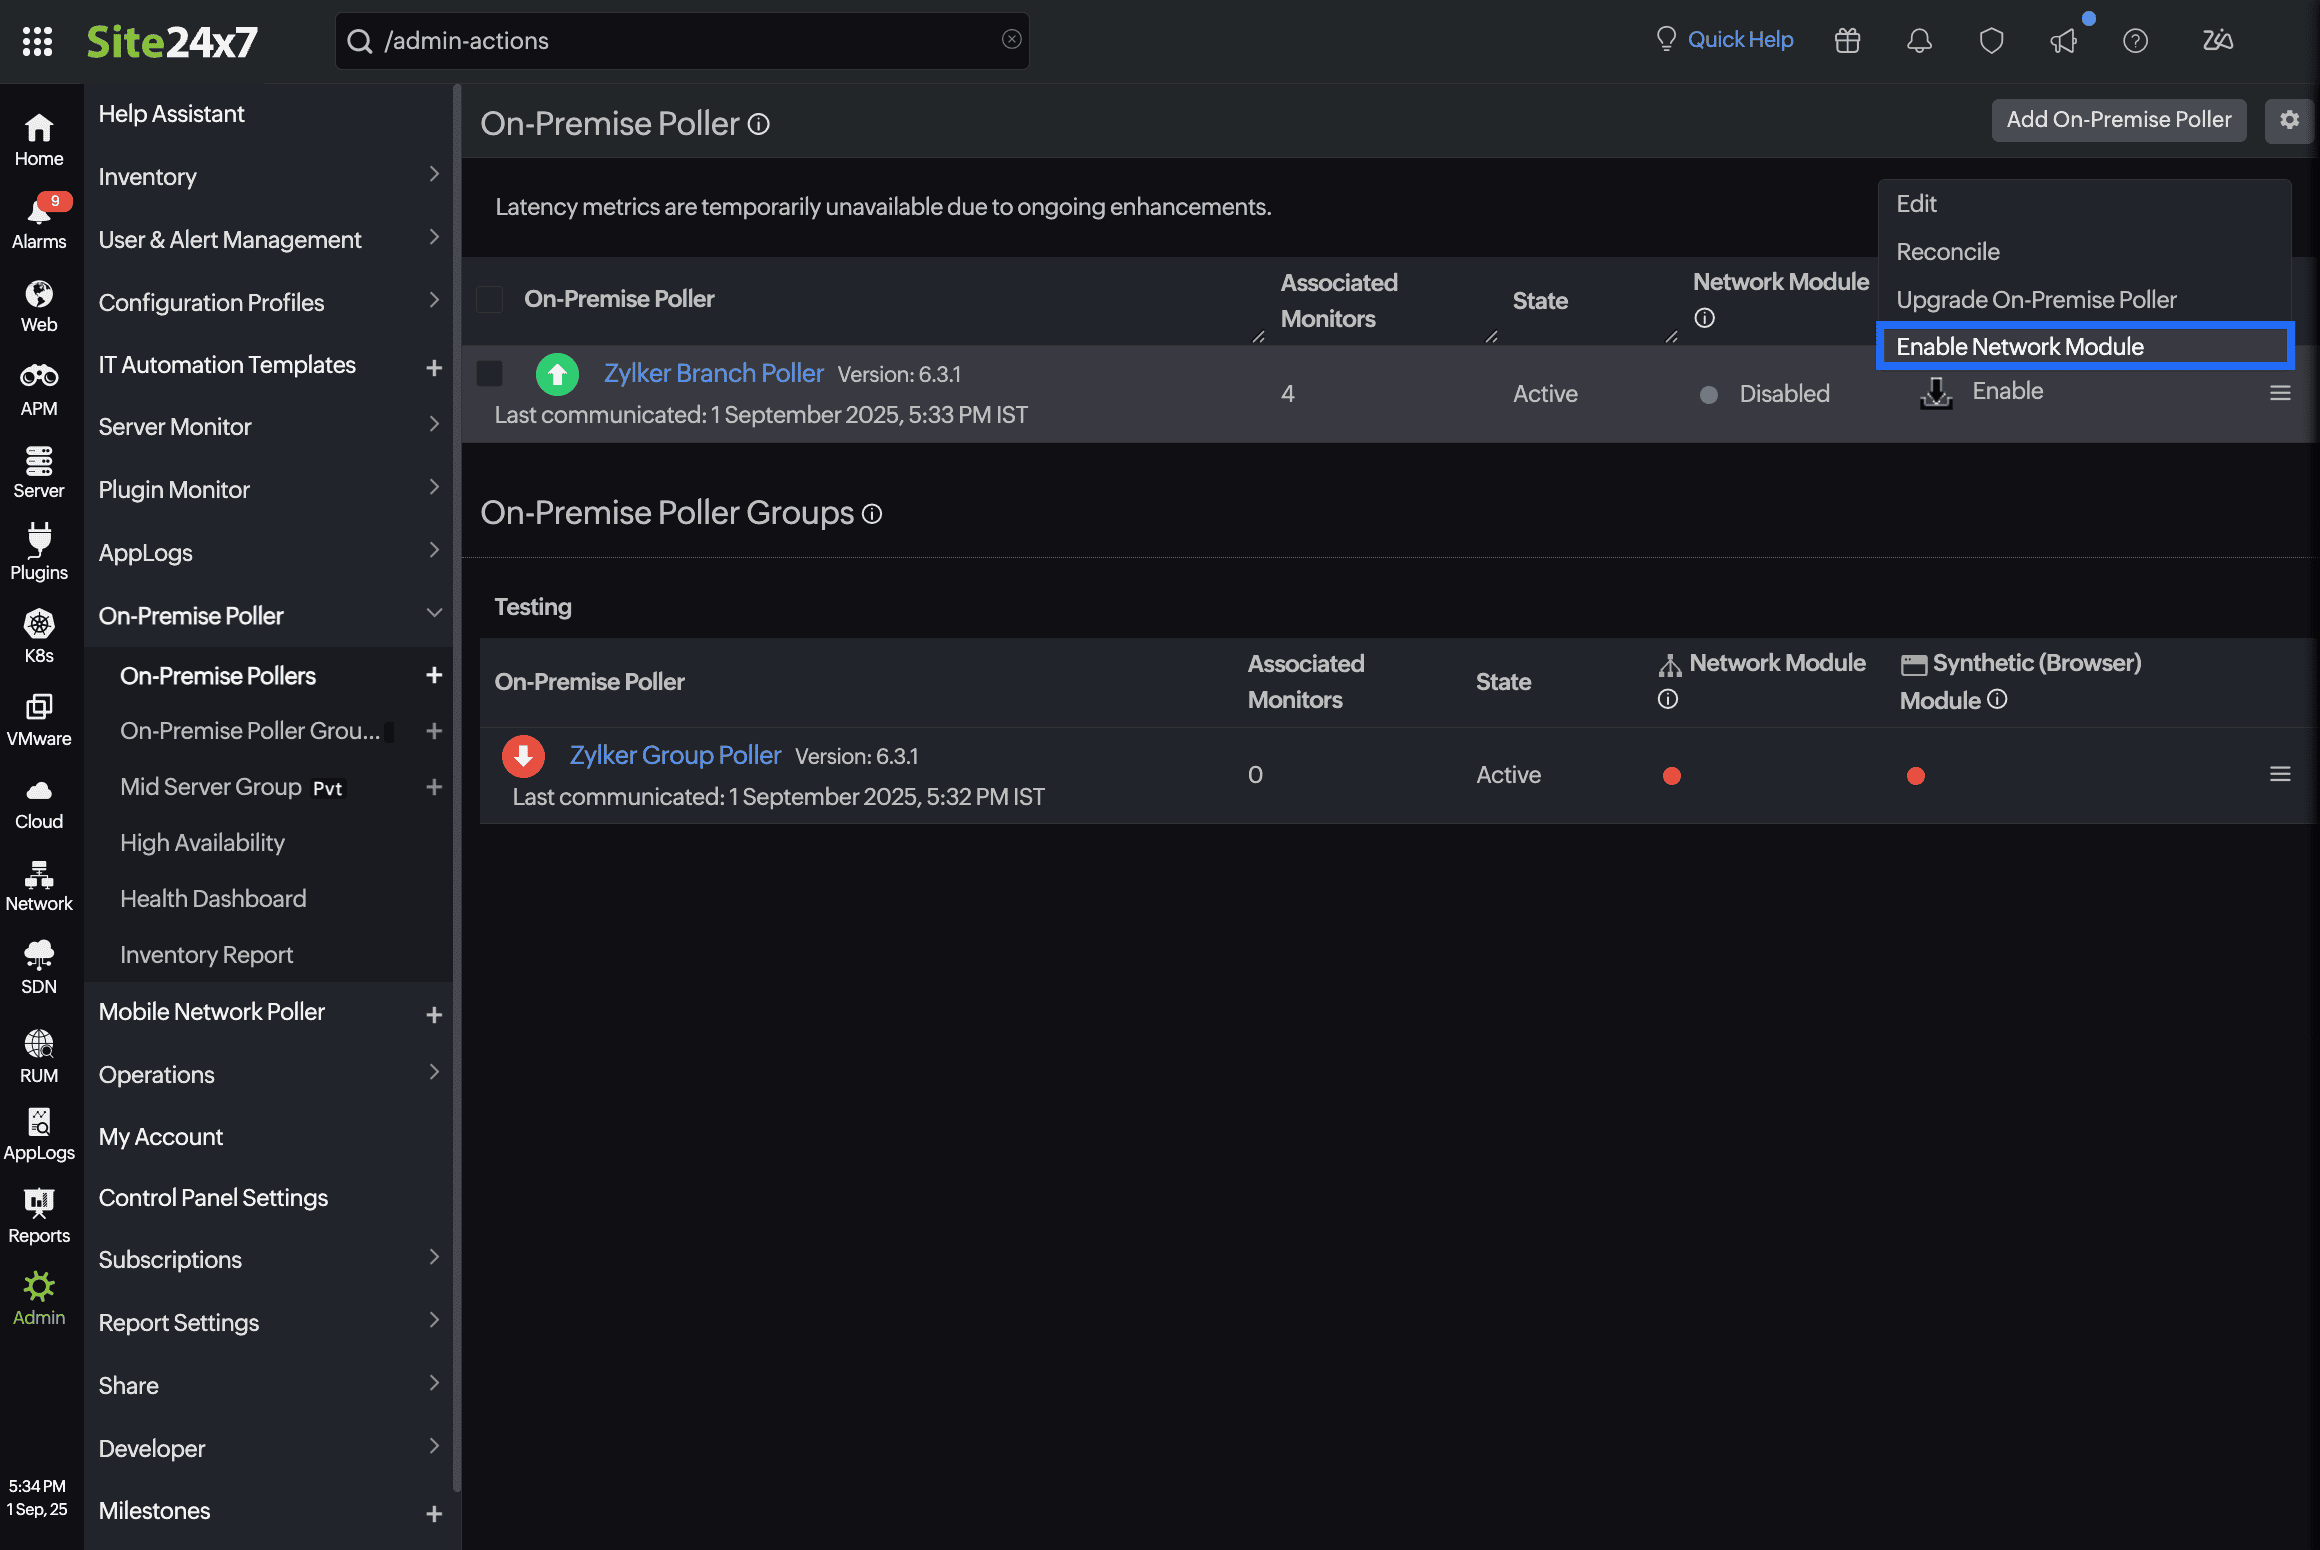
The Network module should be enabled in the On-Premise Poller that you select. If not, it must be manually enabled.
Network log collection can be accomplished using both Windows and Linux agents. However, for collecting network logs on Windows, it is essential to use an On-Premise Poller.

Ensure both are installed on the same machine for seamless log ingestion and processing.
Configuring syslog in network devices
Below is a sample configuration for enabling syslog on Cisco devices. Configure the Cisco switch to forward syslog messages to the designated port on the server hosting the Site24x7 On-Premise Poller agent:
-
Open the command line interface on your network logs and begin a session. Verify that the privileged EXEC mode is enabled. If not, enter privileged EXEC mode by typing the following command:
Switch to global configuration mode by typing the following command:enable
configure terminal
-
Verify that logging is enabled. If not, enable it using the following command:
logging enable
-
Configure the network logs to send log messages to the server on which the Site24x7 Linux server monitoring agent is installed by typing the following command:
Here, host is the name or IP address of the device in which the Site24x7 Linux server monitoring agent is installed.logging host
-
Based on the priority level, you can limit the messages sent. For this, use the following command:
Here, the level can be emergencies, alerts, errors, warnings, notifications, informational (default level), and debugging.logging trap level
-
Return to privileged EXEC mode by typing the command:
end
The default UDP port is 514. You can see the syslog messages in the path configured in the following OS:
-
-
-
For Windows: C:\Program Files(x86)\Site24x7OnPremisePoller\syslogs\*\*
-
For Linux: /opt/Site24x7OnPremisePoller/syslogs/*/*
-
-
Add a Log Type
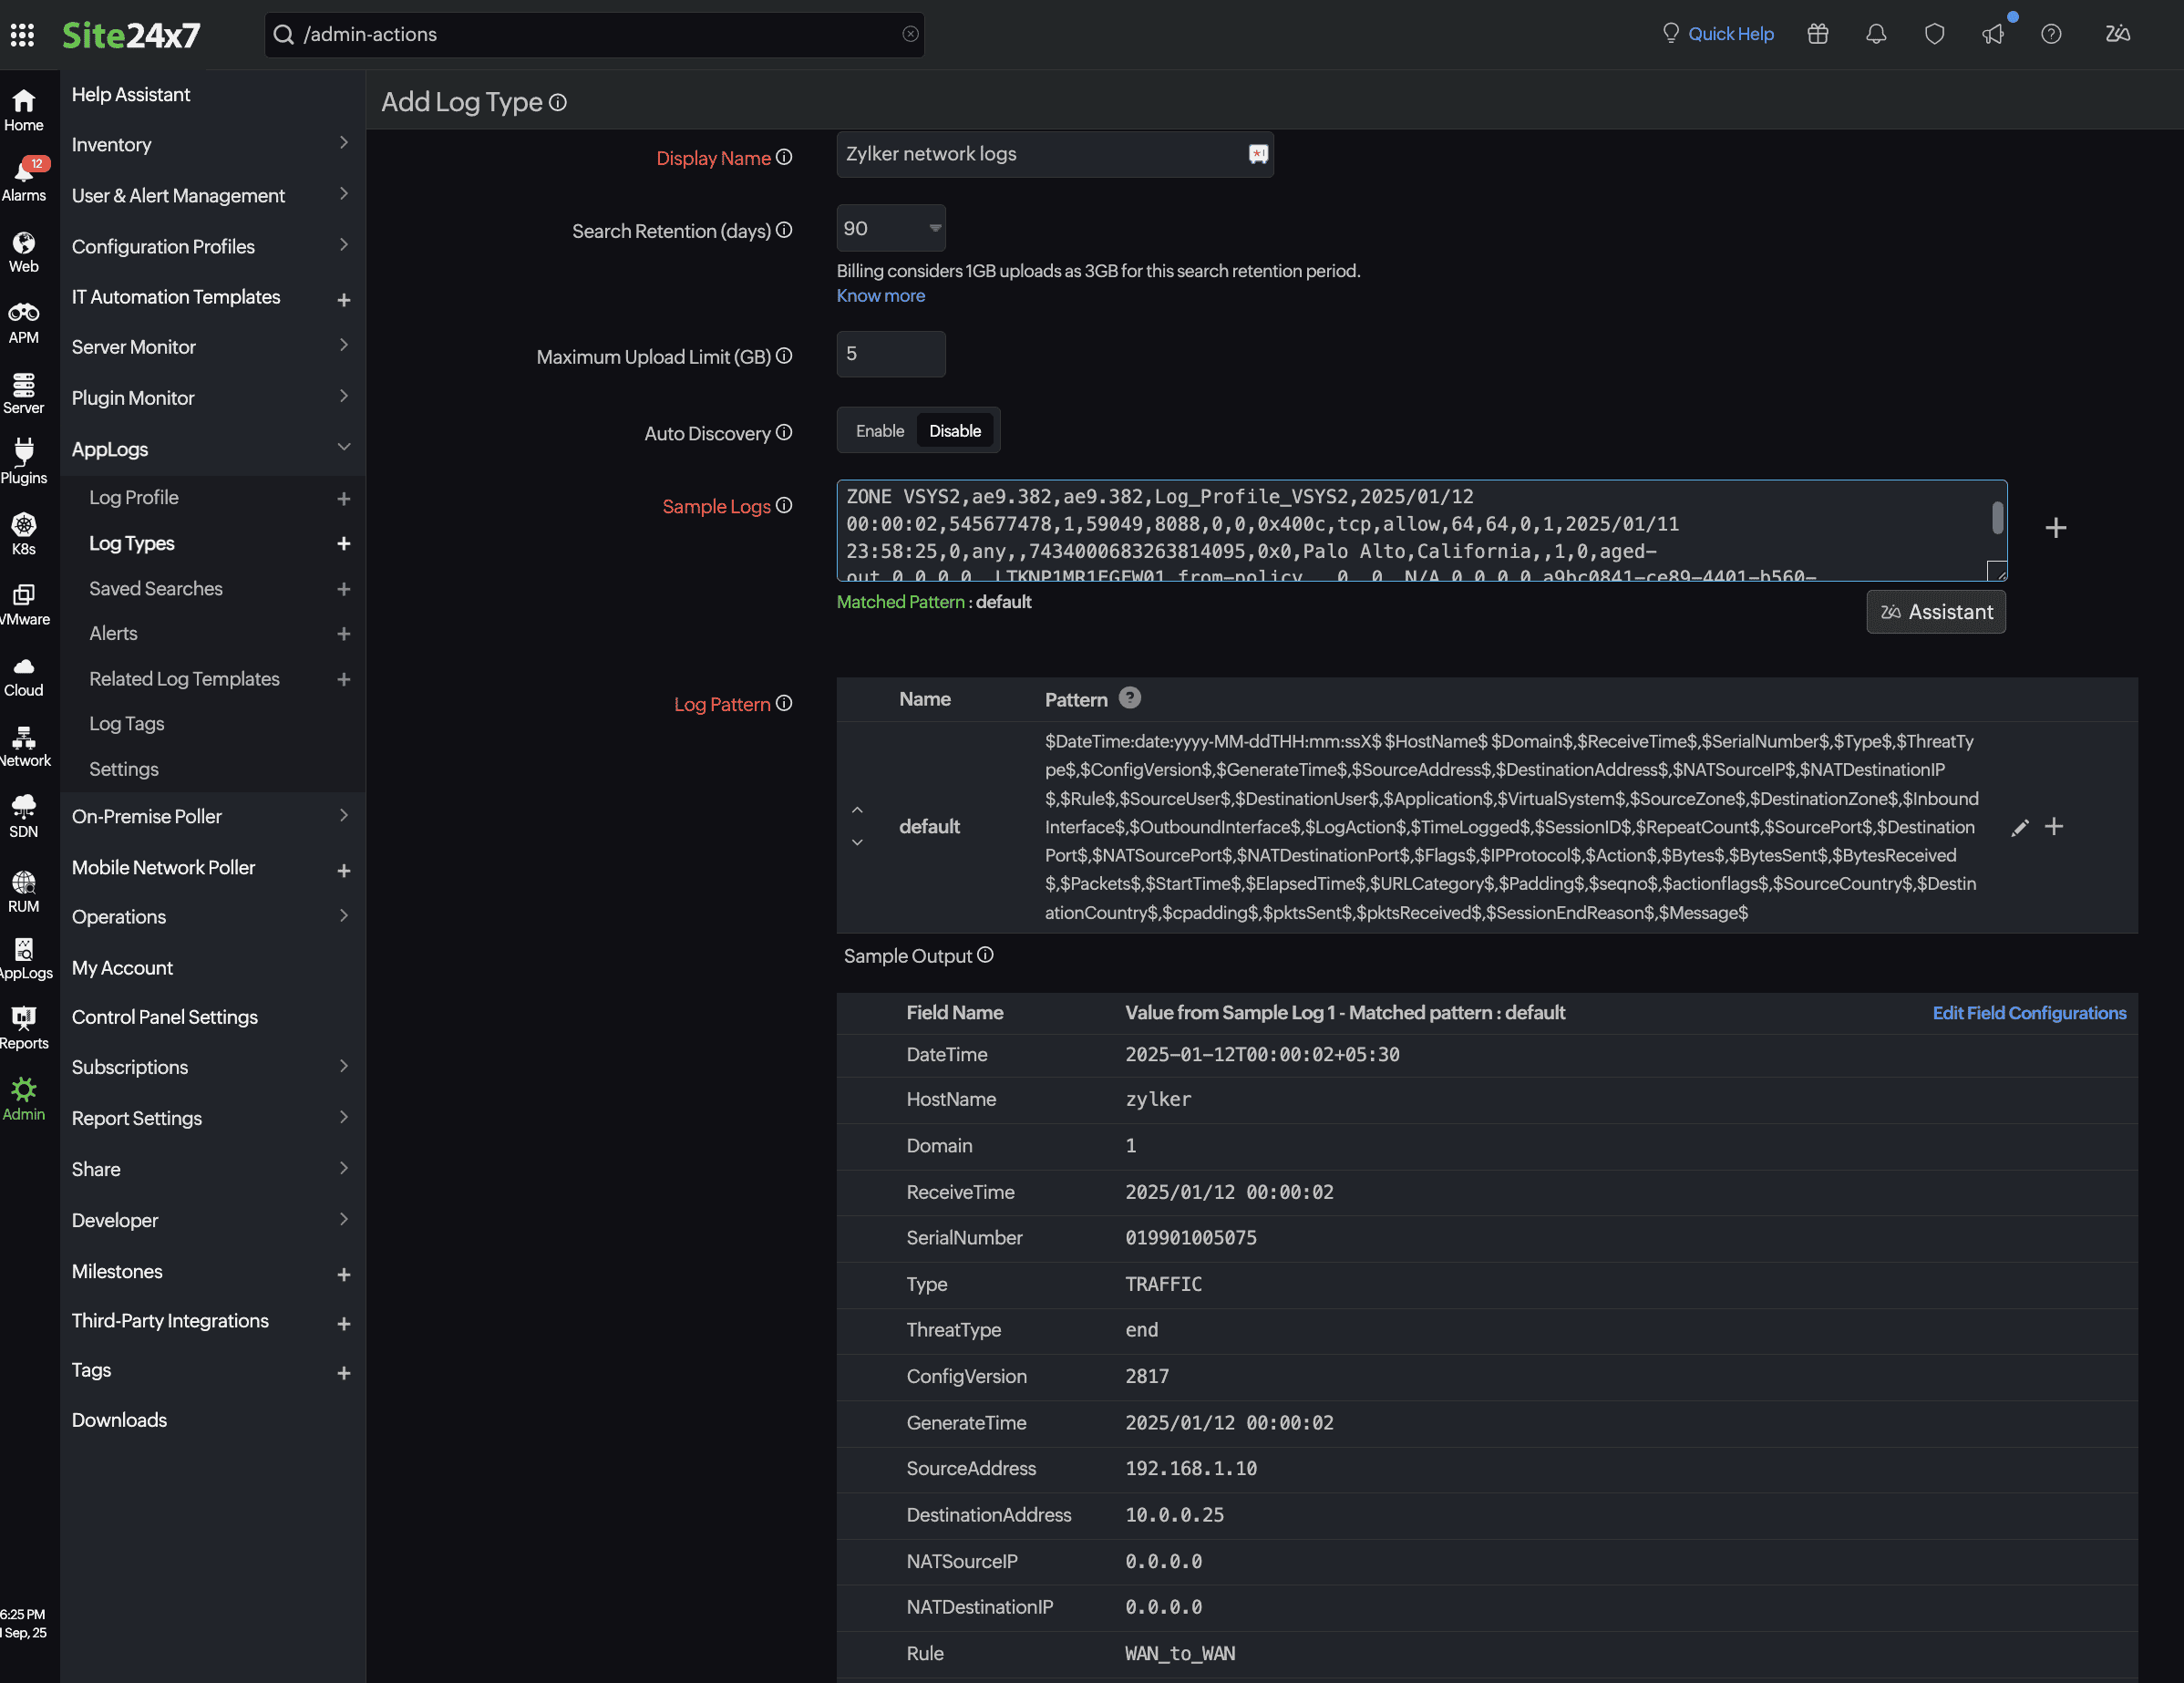
Once the setup is ready, define a custom log type in Site24x7 to parse and interpret the logs correctly. Here is the sample log entry from a firewall:
2025-01-12T00:00:02+05:30 zylker 1,2025/01/12 00:00:02,019901005075,TRAFFIC,end,2817,2025/01/12 00:00:02,192.168.1.10,10.0.0.25,0.0.0.0,0.0.0.0,WAN_to_WAN,,,incomplete,vsys2,WAN ZONE VSYS2,WAN ZONE VSYS2,ae9.382,ae9.382,Log_Profile_VSYS2,2025/01/12 00:00:02,545677478,1,59049,8088,0,0,0x400c,tcp,allow,64,64,0,1,2025/01/11 23:58:25,0,any,,7434000683263814095,0x0,Palo Alto,California,,1,0,aged-out,0,0,0,0,,LTKNP1MR1EGFW01,from-policy,,,0,,0,,N/A,0,0,0,0,a9bc0841-ce89-4401-b560-157301d29dab,0,0,,,,,,,,,,,,,,,,,,,,,,,,,,,,,,,,,,,2025-01-12T00:00:02.804+05:30,,,unknown,unknown,unknown,1,,,incomplete,no,no,0,NonProxyTraffic
Log pattern
$DateTime:date:yyyy-MM-ddTHH:mm:ssX$ $HostName$ $Domain$,$ReceiveTime$,$SerialNumber$,$Type$,$ThreatType$,$ConfigVersion$,$GenerateTime$,$SourceAddress$,$DestinationAddress$,$NATSourceIP$,$NATDestinationIP$,$Rule$,$SourceUser$,$DestinationUser$,$Application$,$VirtualSystem$,$SourceZone$,$DestinationZone$,$InboundInterface$,$OutboundInterface$,$LogAction$,$TimeLogged$,$SessionID$,$RepeatCount$,$SourcePort$,$DestinationPort$,$NATSourcePort$,$NATDestinationPort$,$Flags$,$IPProtocol$,$Action$,$Bytes$,$BytesSent$,$BytesReceived$,$Packets$,$StartTime$,$ElapsedTime$,$URLCategory$,$Padding$,$seqno$,$actionflags$,$SourceCountry$,$DestinationCountry$,$cpadding$,$pktsSent$,$pktsReceived$,$SessionEndReason$,$Message$

When adding a log type
-
Add your network device log details to the sample log.
-
Define relevant fields like timestamp, hostname, source IP, destination IP, action, and interface.
-
Validate the format using the actual logs from your device.
Add a Log Profile
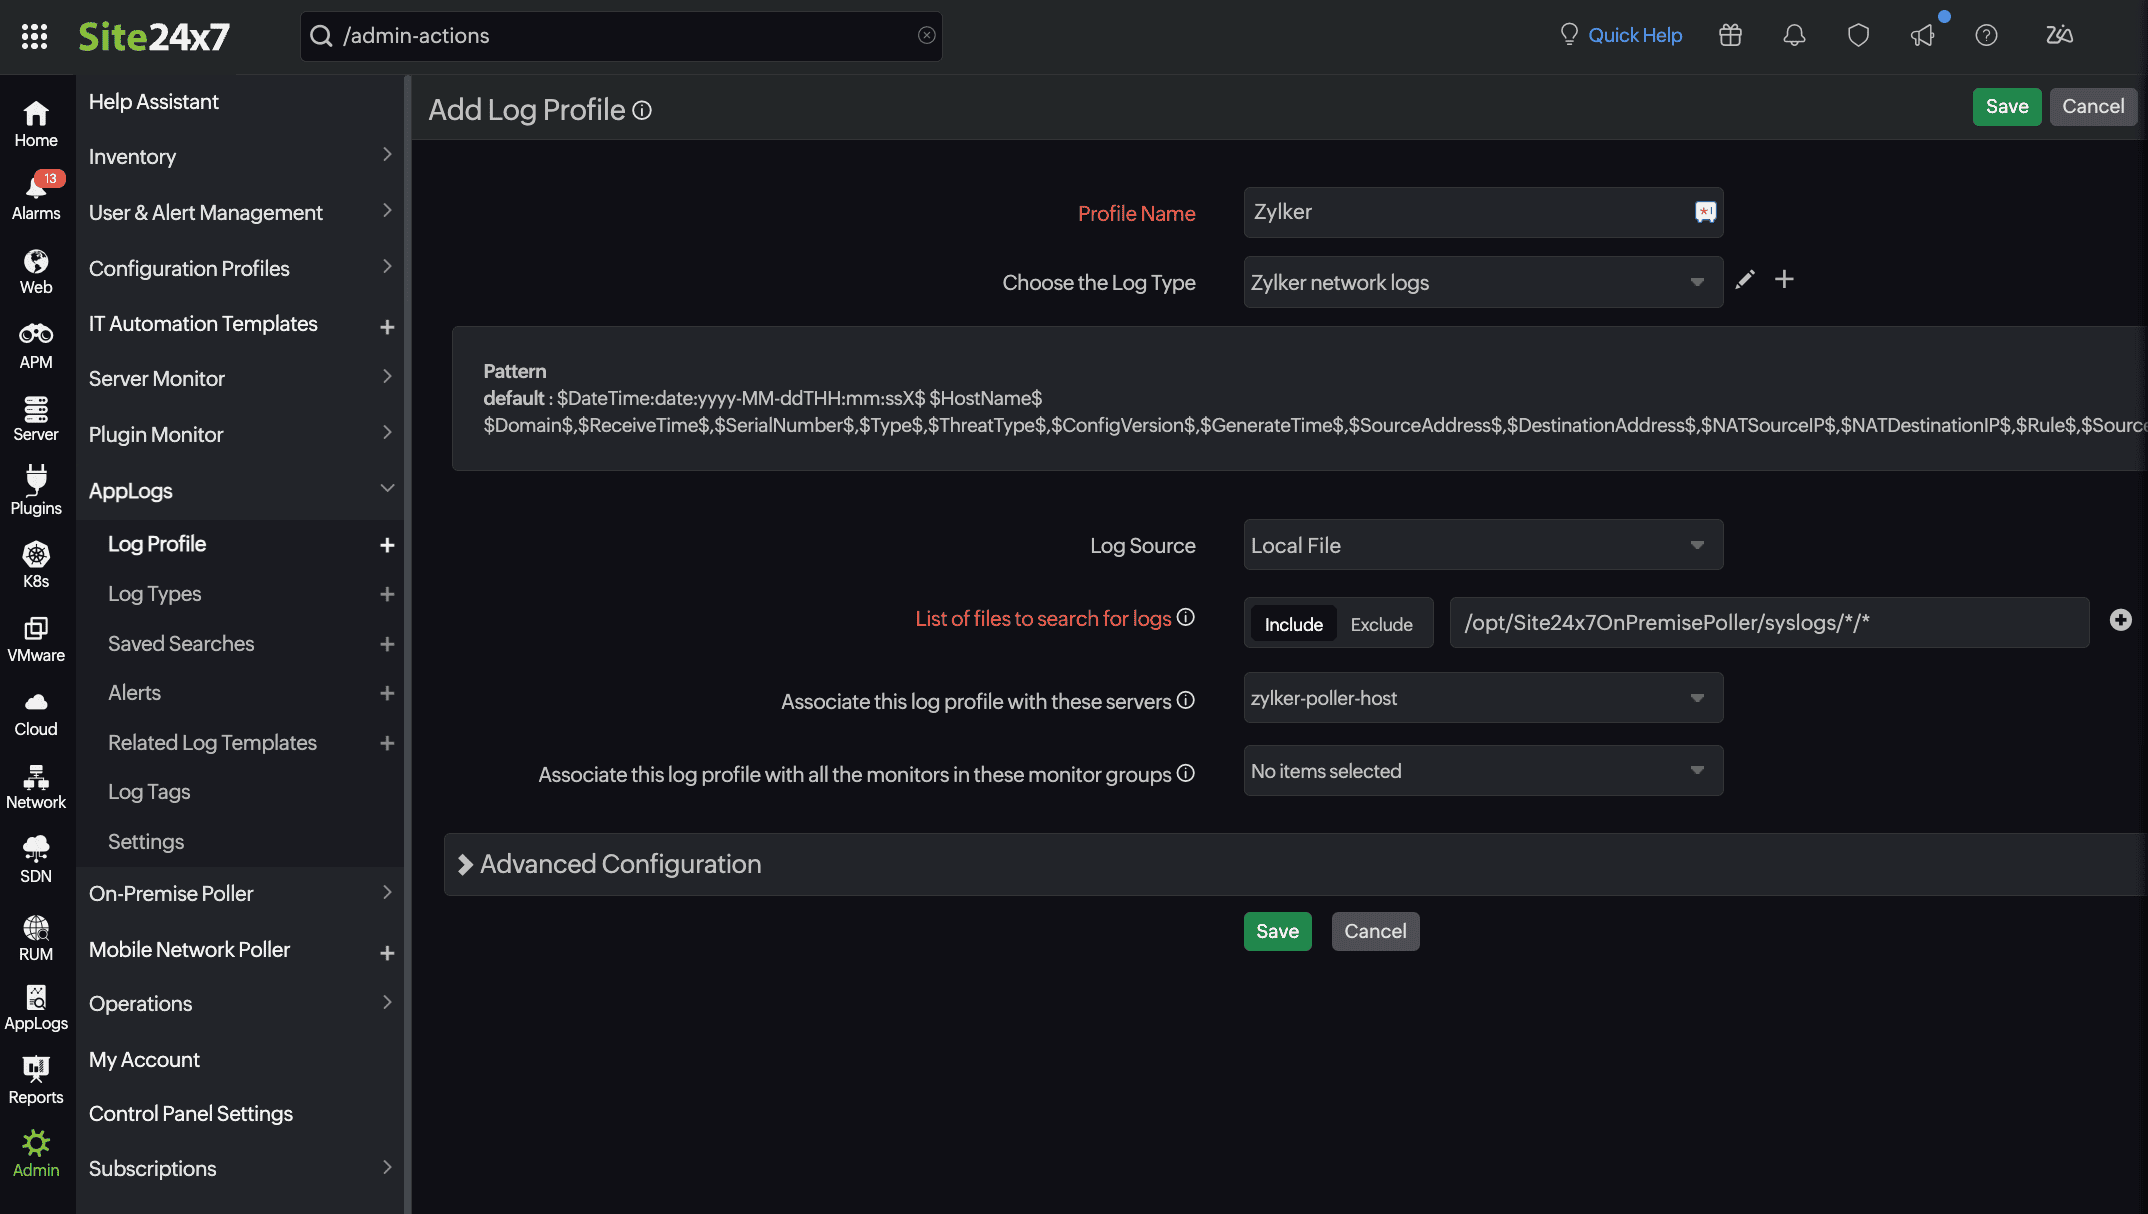
Create a log profile in Site24x7 to link the On-Premise Poller output file with the parsing logic. Navigate to Admin > AppLogs > Log Profile (+). This profile defines:
-
The path to the log file written by the On-Premise Poller.
Example:-
For Windows:
C:\Program Files (x86)\Site24x7OnPremisePoller\syslogs\
-
For Linux:
/opt/Site24x7OnPremisePoller/syslogs/*/*
-
If multiple network device types are configured, replace * with the respective device IPs in the log profile page.
-
The log type (which you just created from the above step) and the associated log type.
Example: Zylker network logs -
The server where the agent is installed.
Example: zylker-poller-host

By using Site24x7’s On-Premise Poller for log ingestion, organizations can centralize log data from multiple devices, maintain real-time visibility, and proactively monitor network activities. The combined setup of On-Premise Poller, agent, custom log types, and log profiles ensures seamless log collection, parsing, and transmission to Site24x7 for further analysis.
