NGINX Logs
Site24x7 AppLogs is an agent-based log management tool on the cloud that natively facilitates effective and simple management for NGINX logs. It separates critical data in a simple and accessible format by segregating them into components like remote address, remote user, date & time, method, request-URI, protocol, status, bytes sent, referrer, user agent, and forwardedFor. Learn more about log management with Site24x7.
Getting started
- Log in to your Site24x7 account.
- Download and install the Site24x7 Server Monitoring agent (Windows | Linux).
- Go to Admin > AppLogs > Log Profile and Add Log Profile.
Logs file path
Each application writes logs in different folders and files. By default, NGINX logs are sourced from the below-mentioned folder path for the respective Operating System. If you have logs in a different folder, you can mention it under the File Path to source them from that particular folder while creating a log profile.


Log pattern
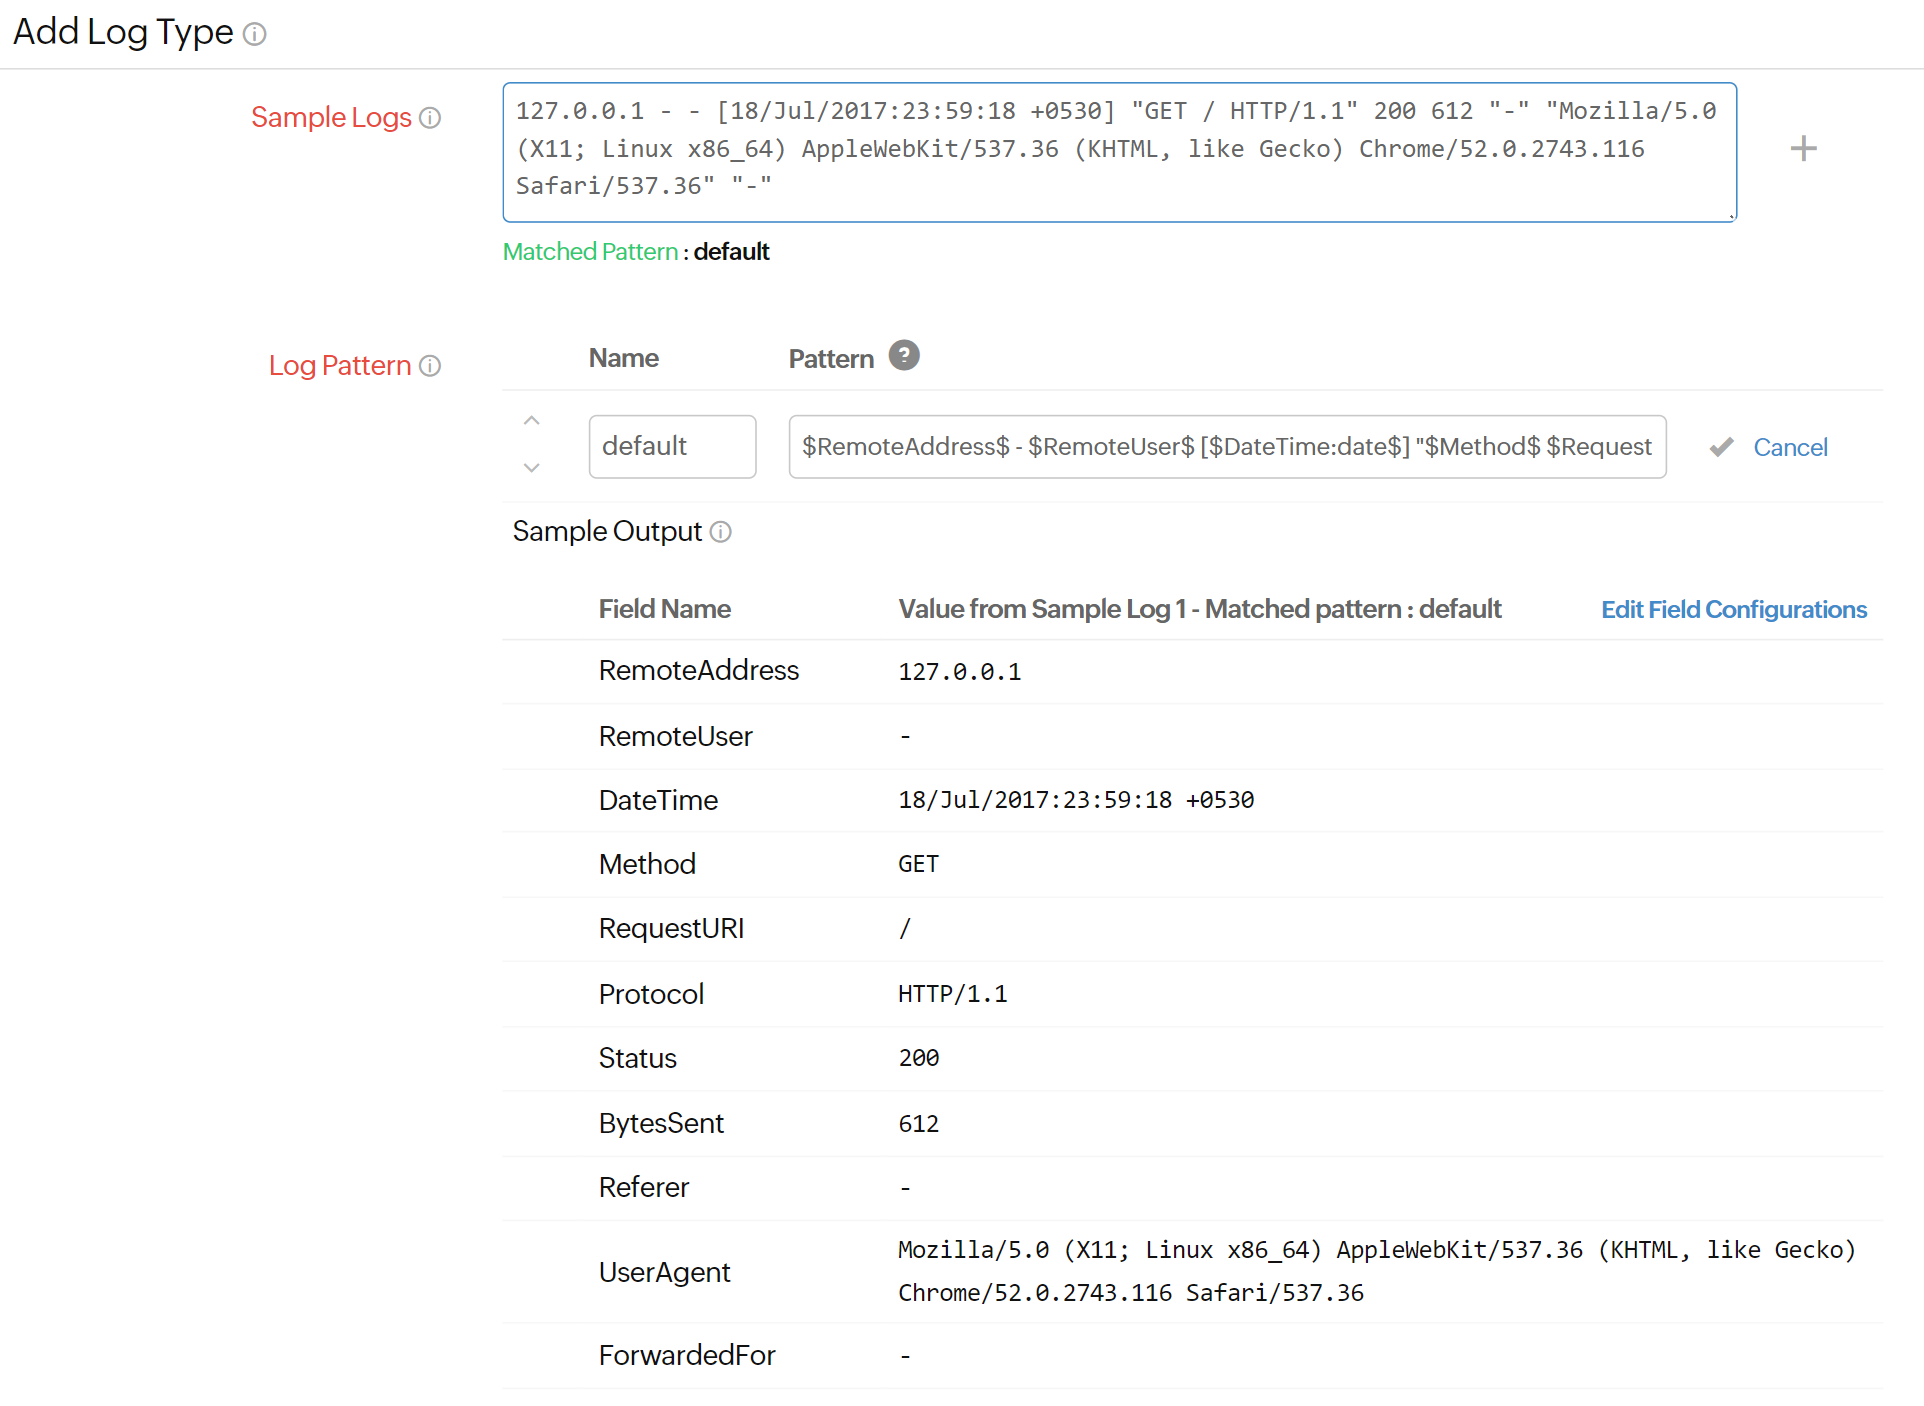
$RemoteAddress$ - $RemoteUser$ [$DateTime:date$] "$Method$ $RequestURI$ $Protocol$" $Status:number$ $BytesSent:number$ "$Referer$" "$UserAgent$"! "$ForwardedFor$"!
This is the default pattern defined by Site24x7 for parsing NGINX logs based on the sample log mentioned below.
Sample log
127.0.0.1 - - [18/Jul/2017:23:59:18 +0530] "GET / HTTP/1.1" 200 612 "-" "Mozilla/5.0 (X11; Linux x86_64) AppleWebKit/537.36 (KHTML, like Gecko) Chrome/52.0.2743.116 Safari/537.36" "-"
The above sample log can be separated into 11 fields, each of which will take its respective value from here and will then be uploaded to Site24x7.
| Field name | Field value |
| RemoteAddress | 127.0.0.1 |
| RemoteUser | - |
| DateTime | 18/Jul/2017:23:59:18 +0530 |
| Method | GET |
| RequestURI | / |
| Protocol | HTTP/1.1 |
| Status | 200 |
| BytesSent | 612 |
| Referer | - |
| UserAgent | Mozilla/5.0 (X11; Linux x86_64) AppleWebKit/537.36 (KHTML, like Gecko) Chrome/52.0.2743.116 Safari/537.36 |
| ForwardedFor | - |

To filter the bot traffic from your access logs, you can configure filters on the UserAgent field using the Filter Log Lines at Source option available on the log type page.
NGINX logs dashboard
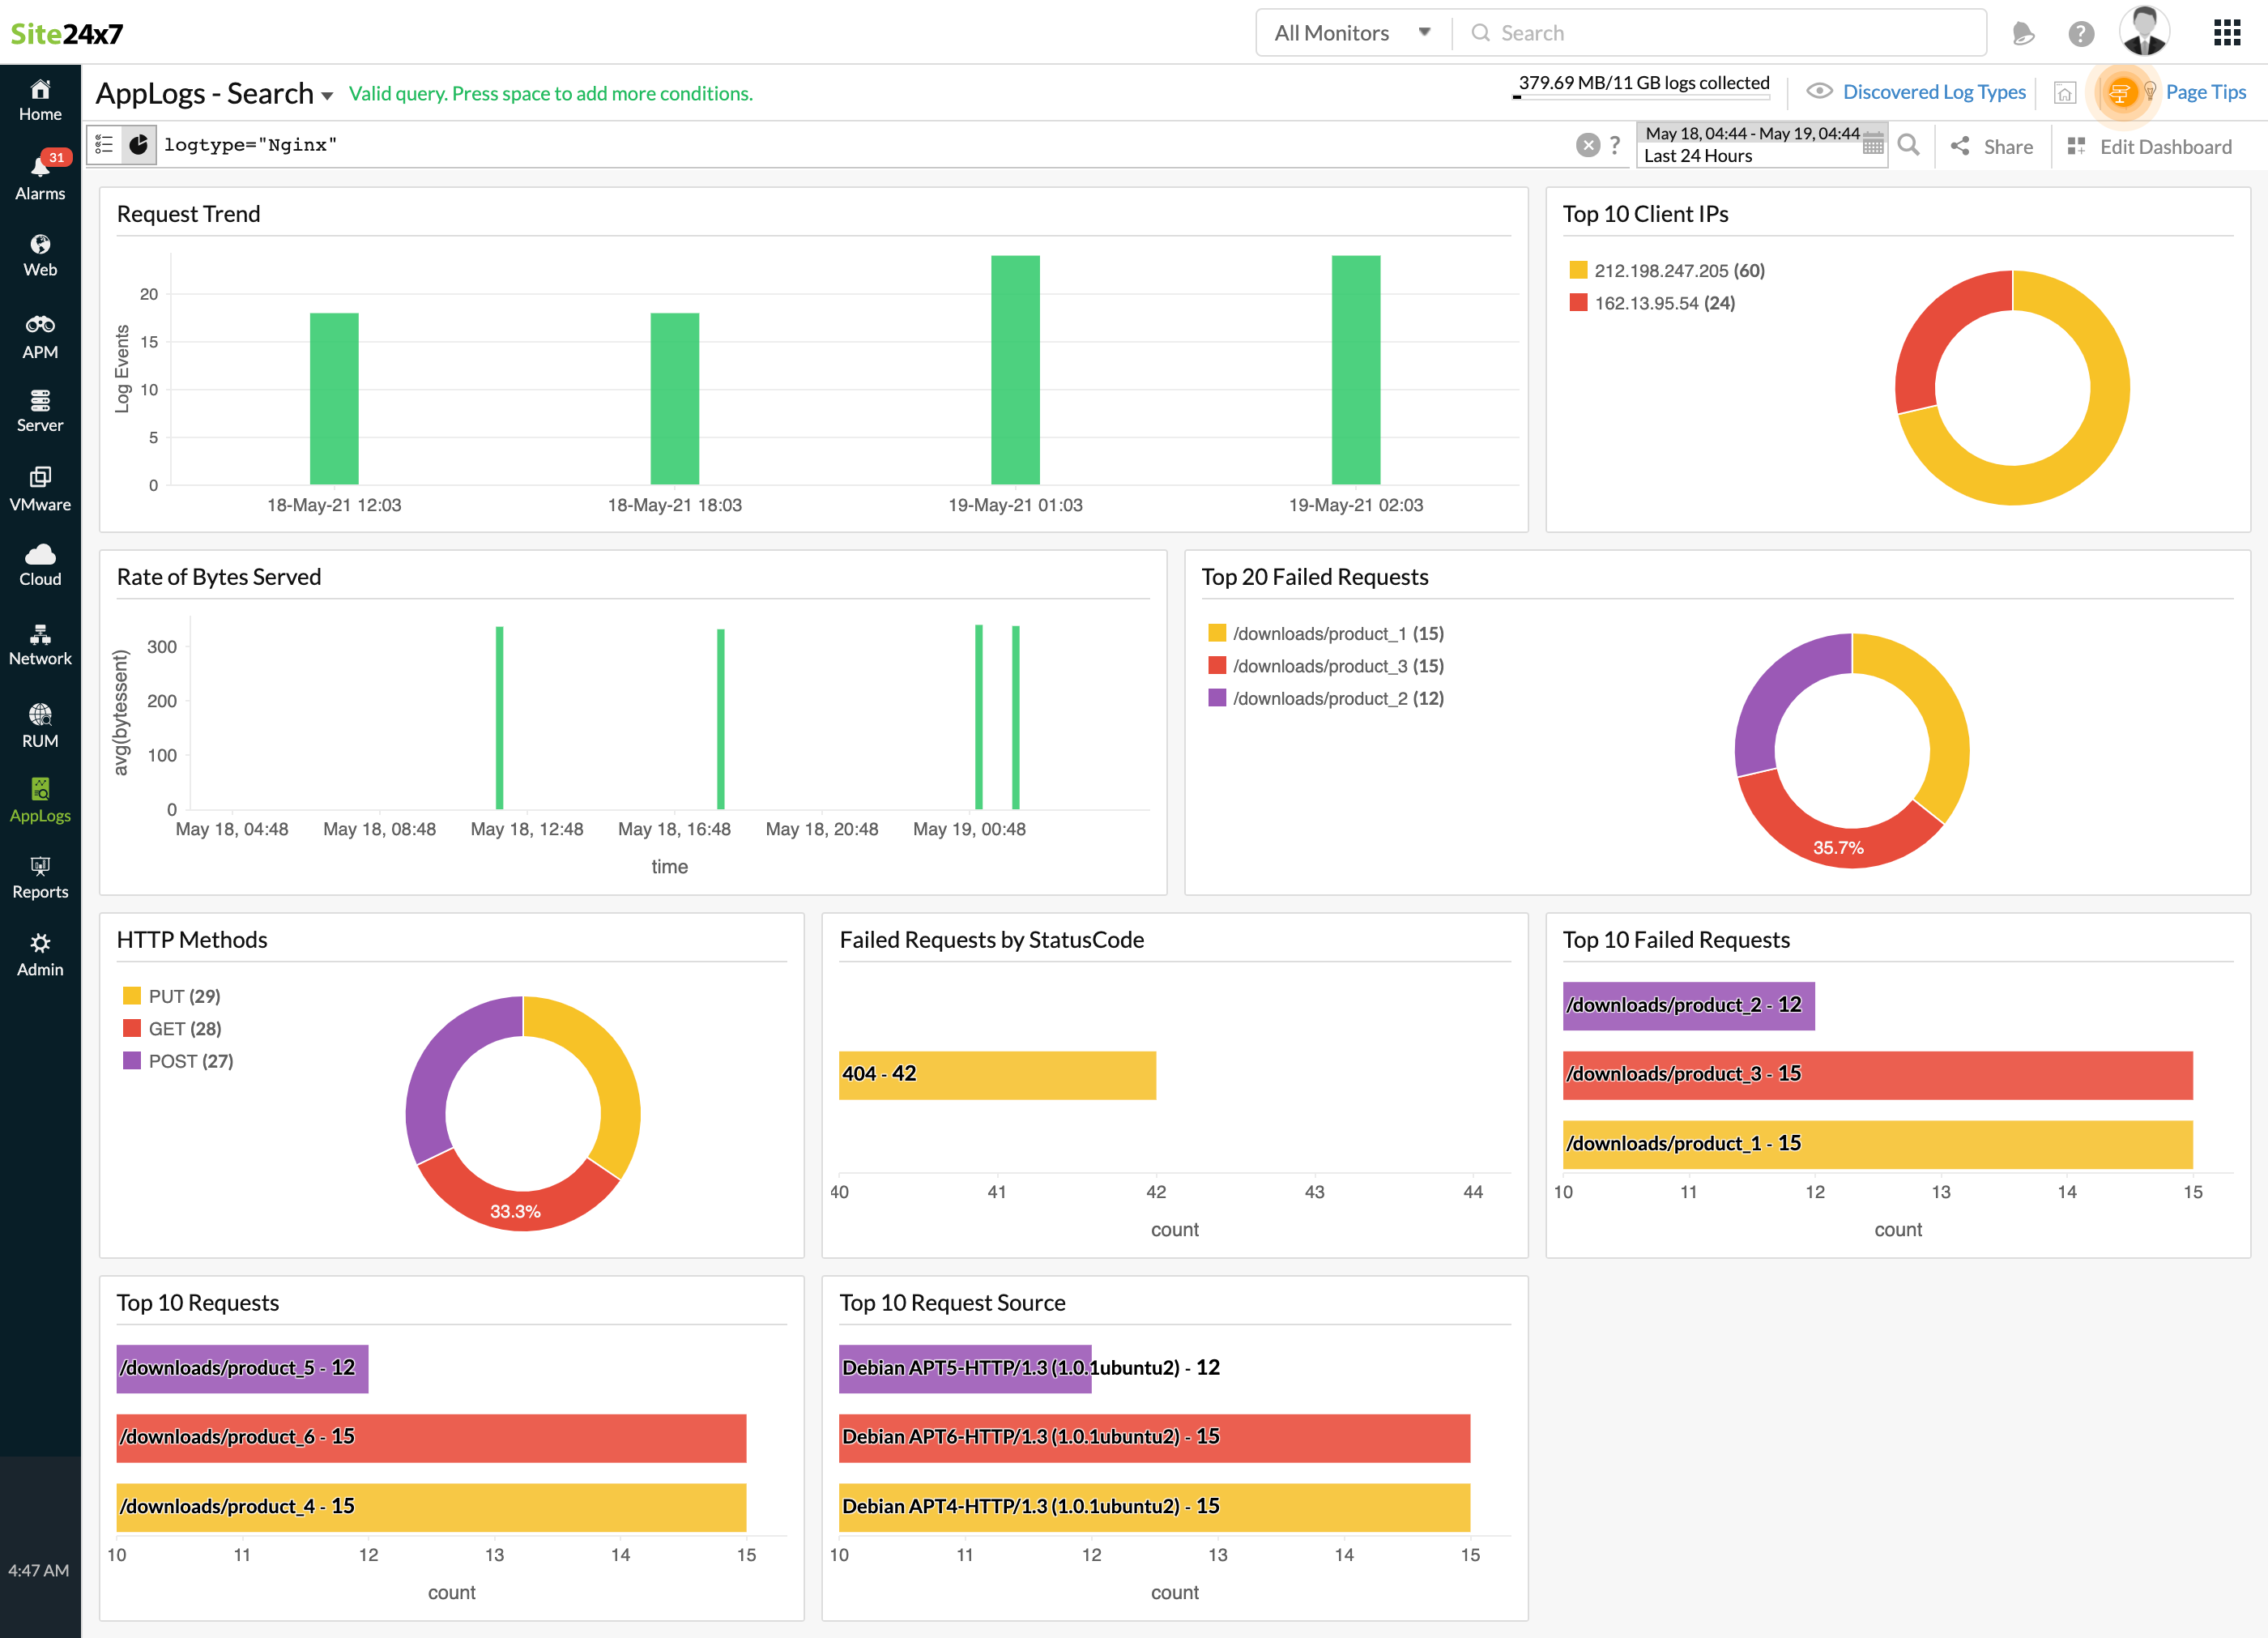
AppLogs creates an exclusive dashboard for every Log Type, and shows a few widgets by default. Here's a list of the widgets available in the NGINX logs dashboard:
- Request Trend
- Top 10 Client IPs
- Rate of Bytes Served
- Top 20 Failed Requests
- Status Code Stats
- User Agent Stats
- HTTP Methods

In addition to the default widgets, your saved searches will also be added to the dashboard automatically.
