Puppet Server Access Logs
Puppet is a configuration management tool created by Puppet Labs to automate infrastructure management and configuration. Puppet is a powerful tool which helps in the concept of Infrastructure as code. Site24x7 AppLogs provides built-in support for Puppet server access logs.
Getting started
1. Log in to your Site24x7 account.
2. Download and install the Site24x7 Server Monitoring Agent (Windows | Linux).
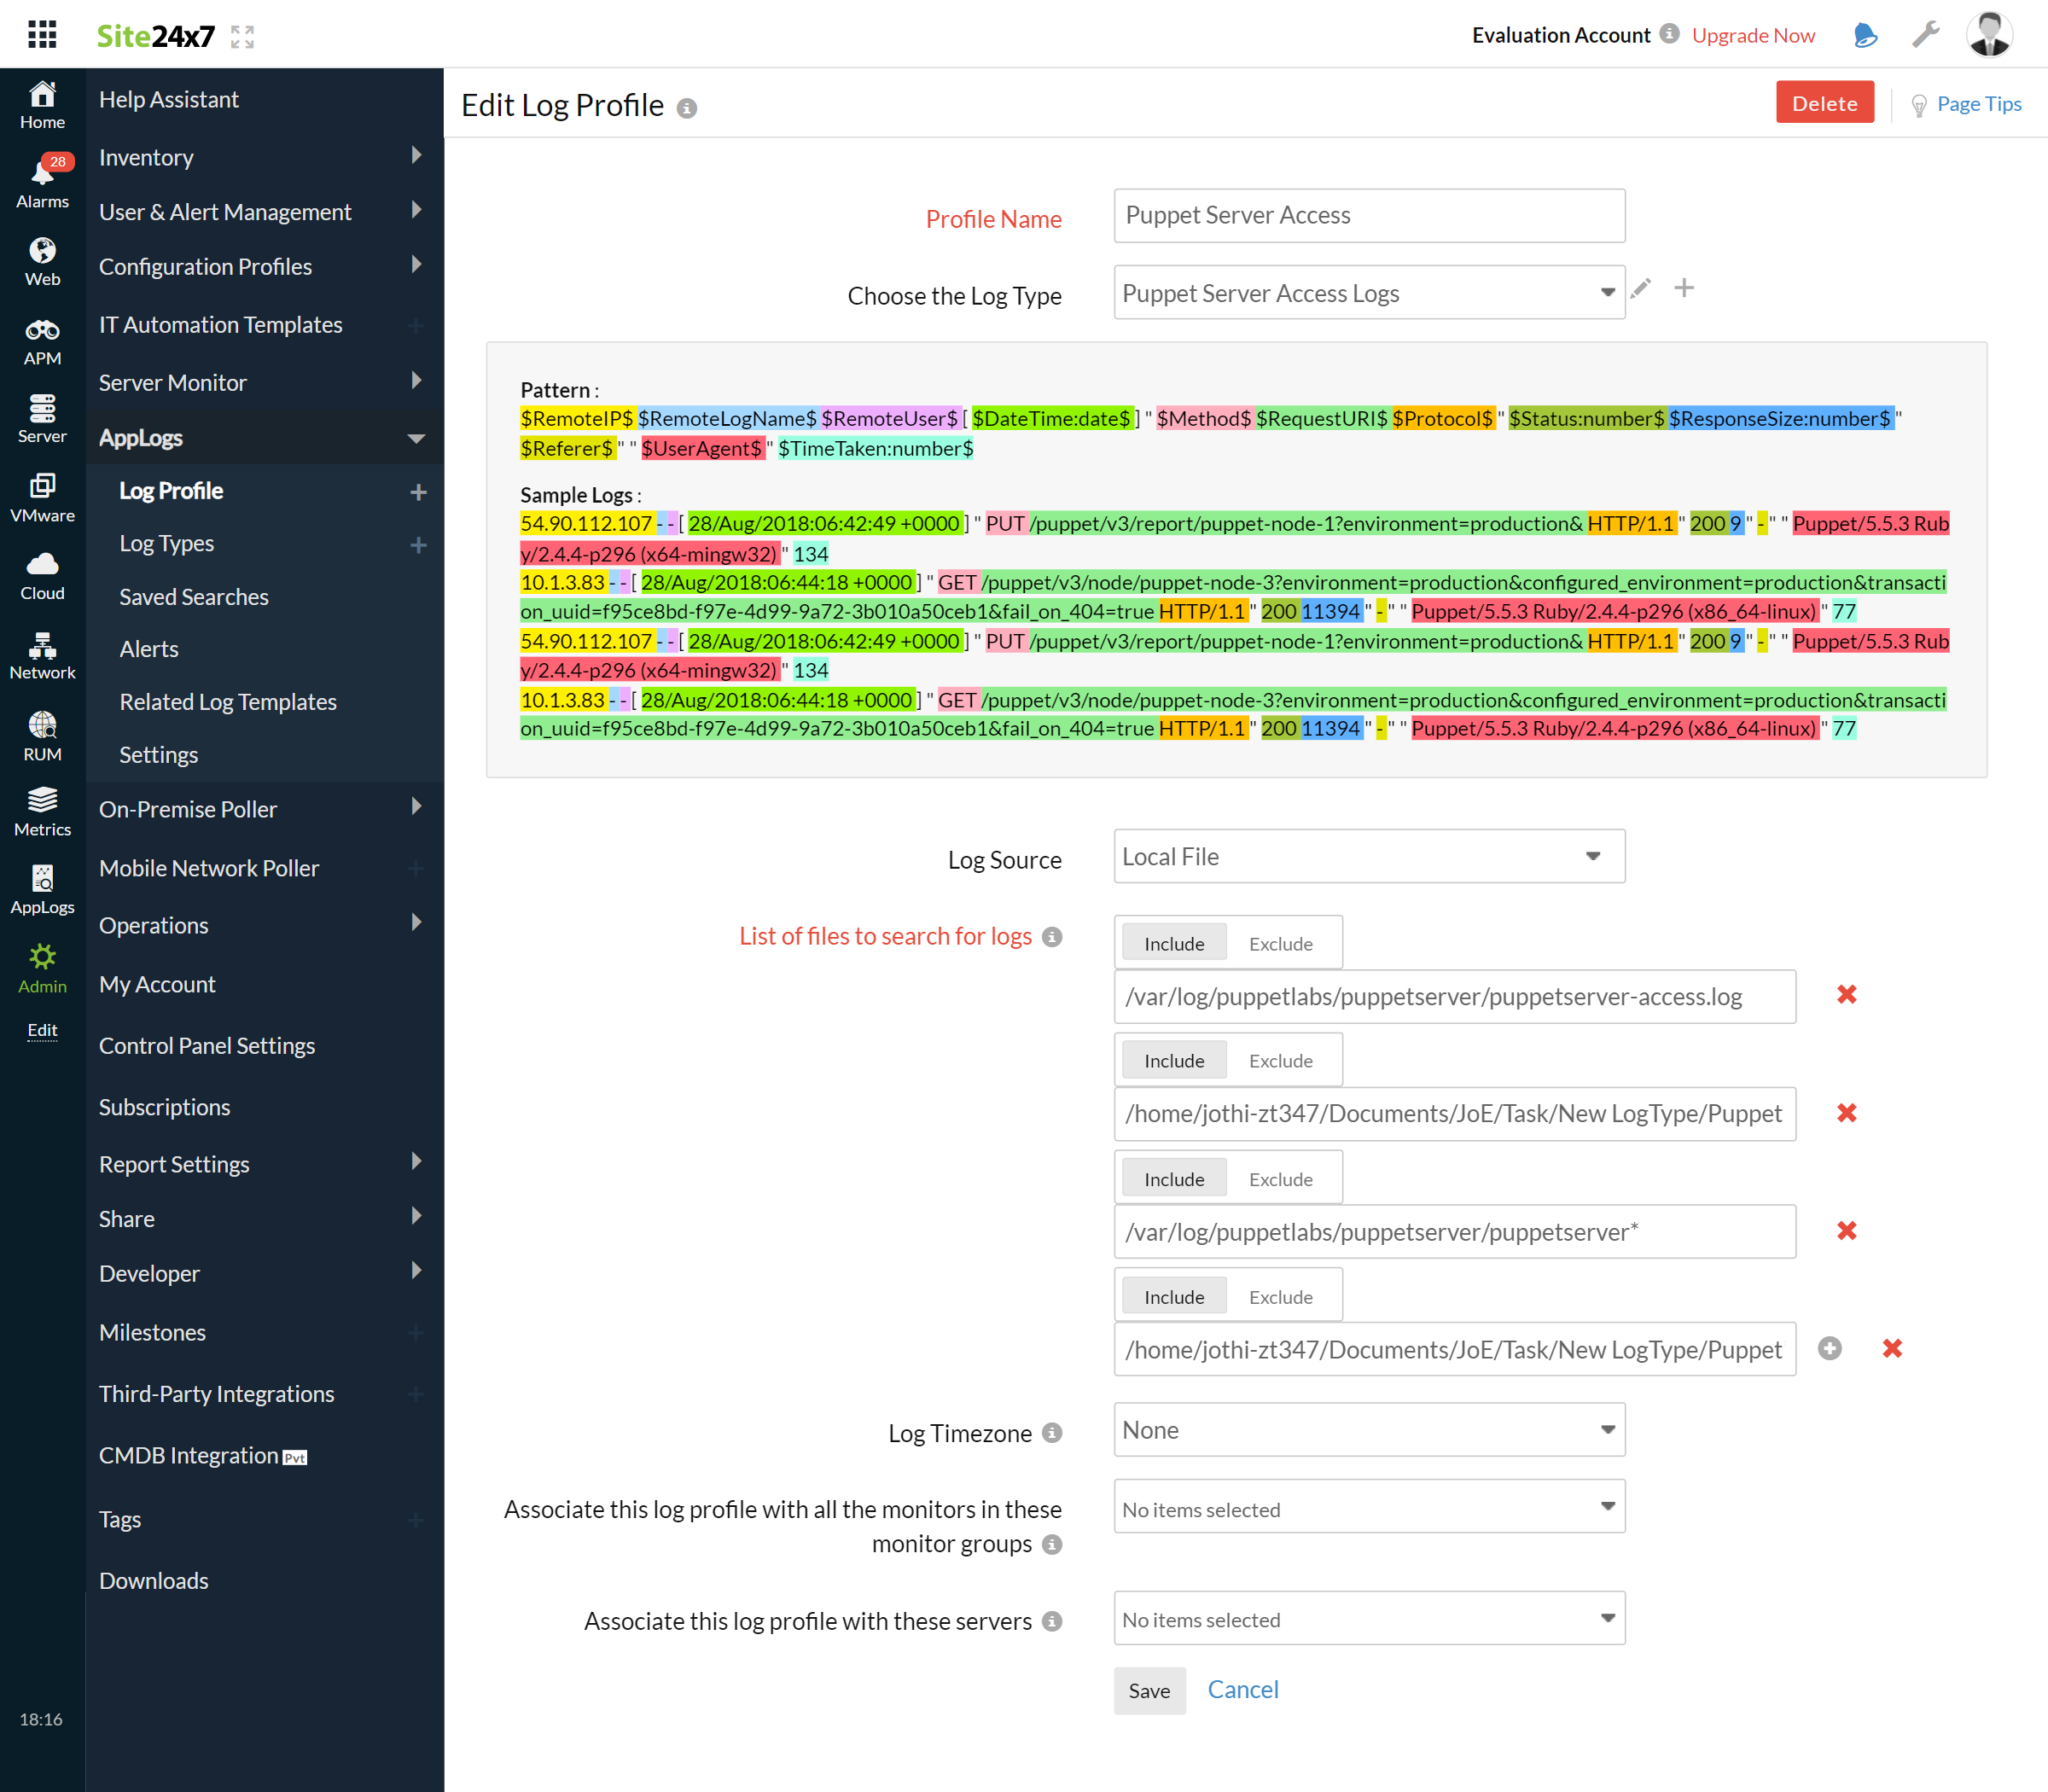
3. Go to Admin > AppLogs > Log Profile and select Add Log Profile.
4. Enter the Profile Name.
5. Select Puppet server access logs from the Choose the Log Type dropdown.
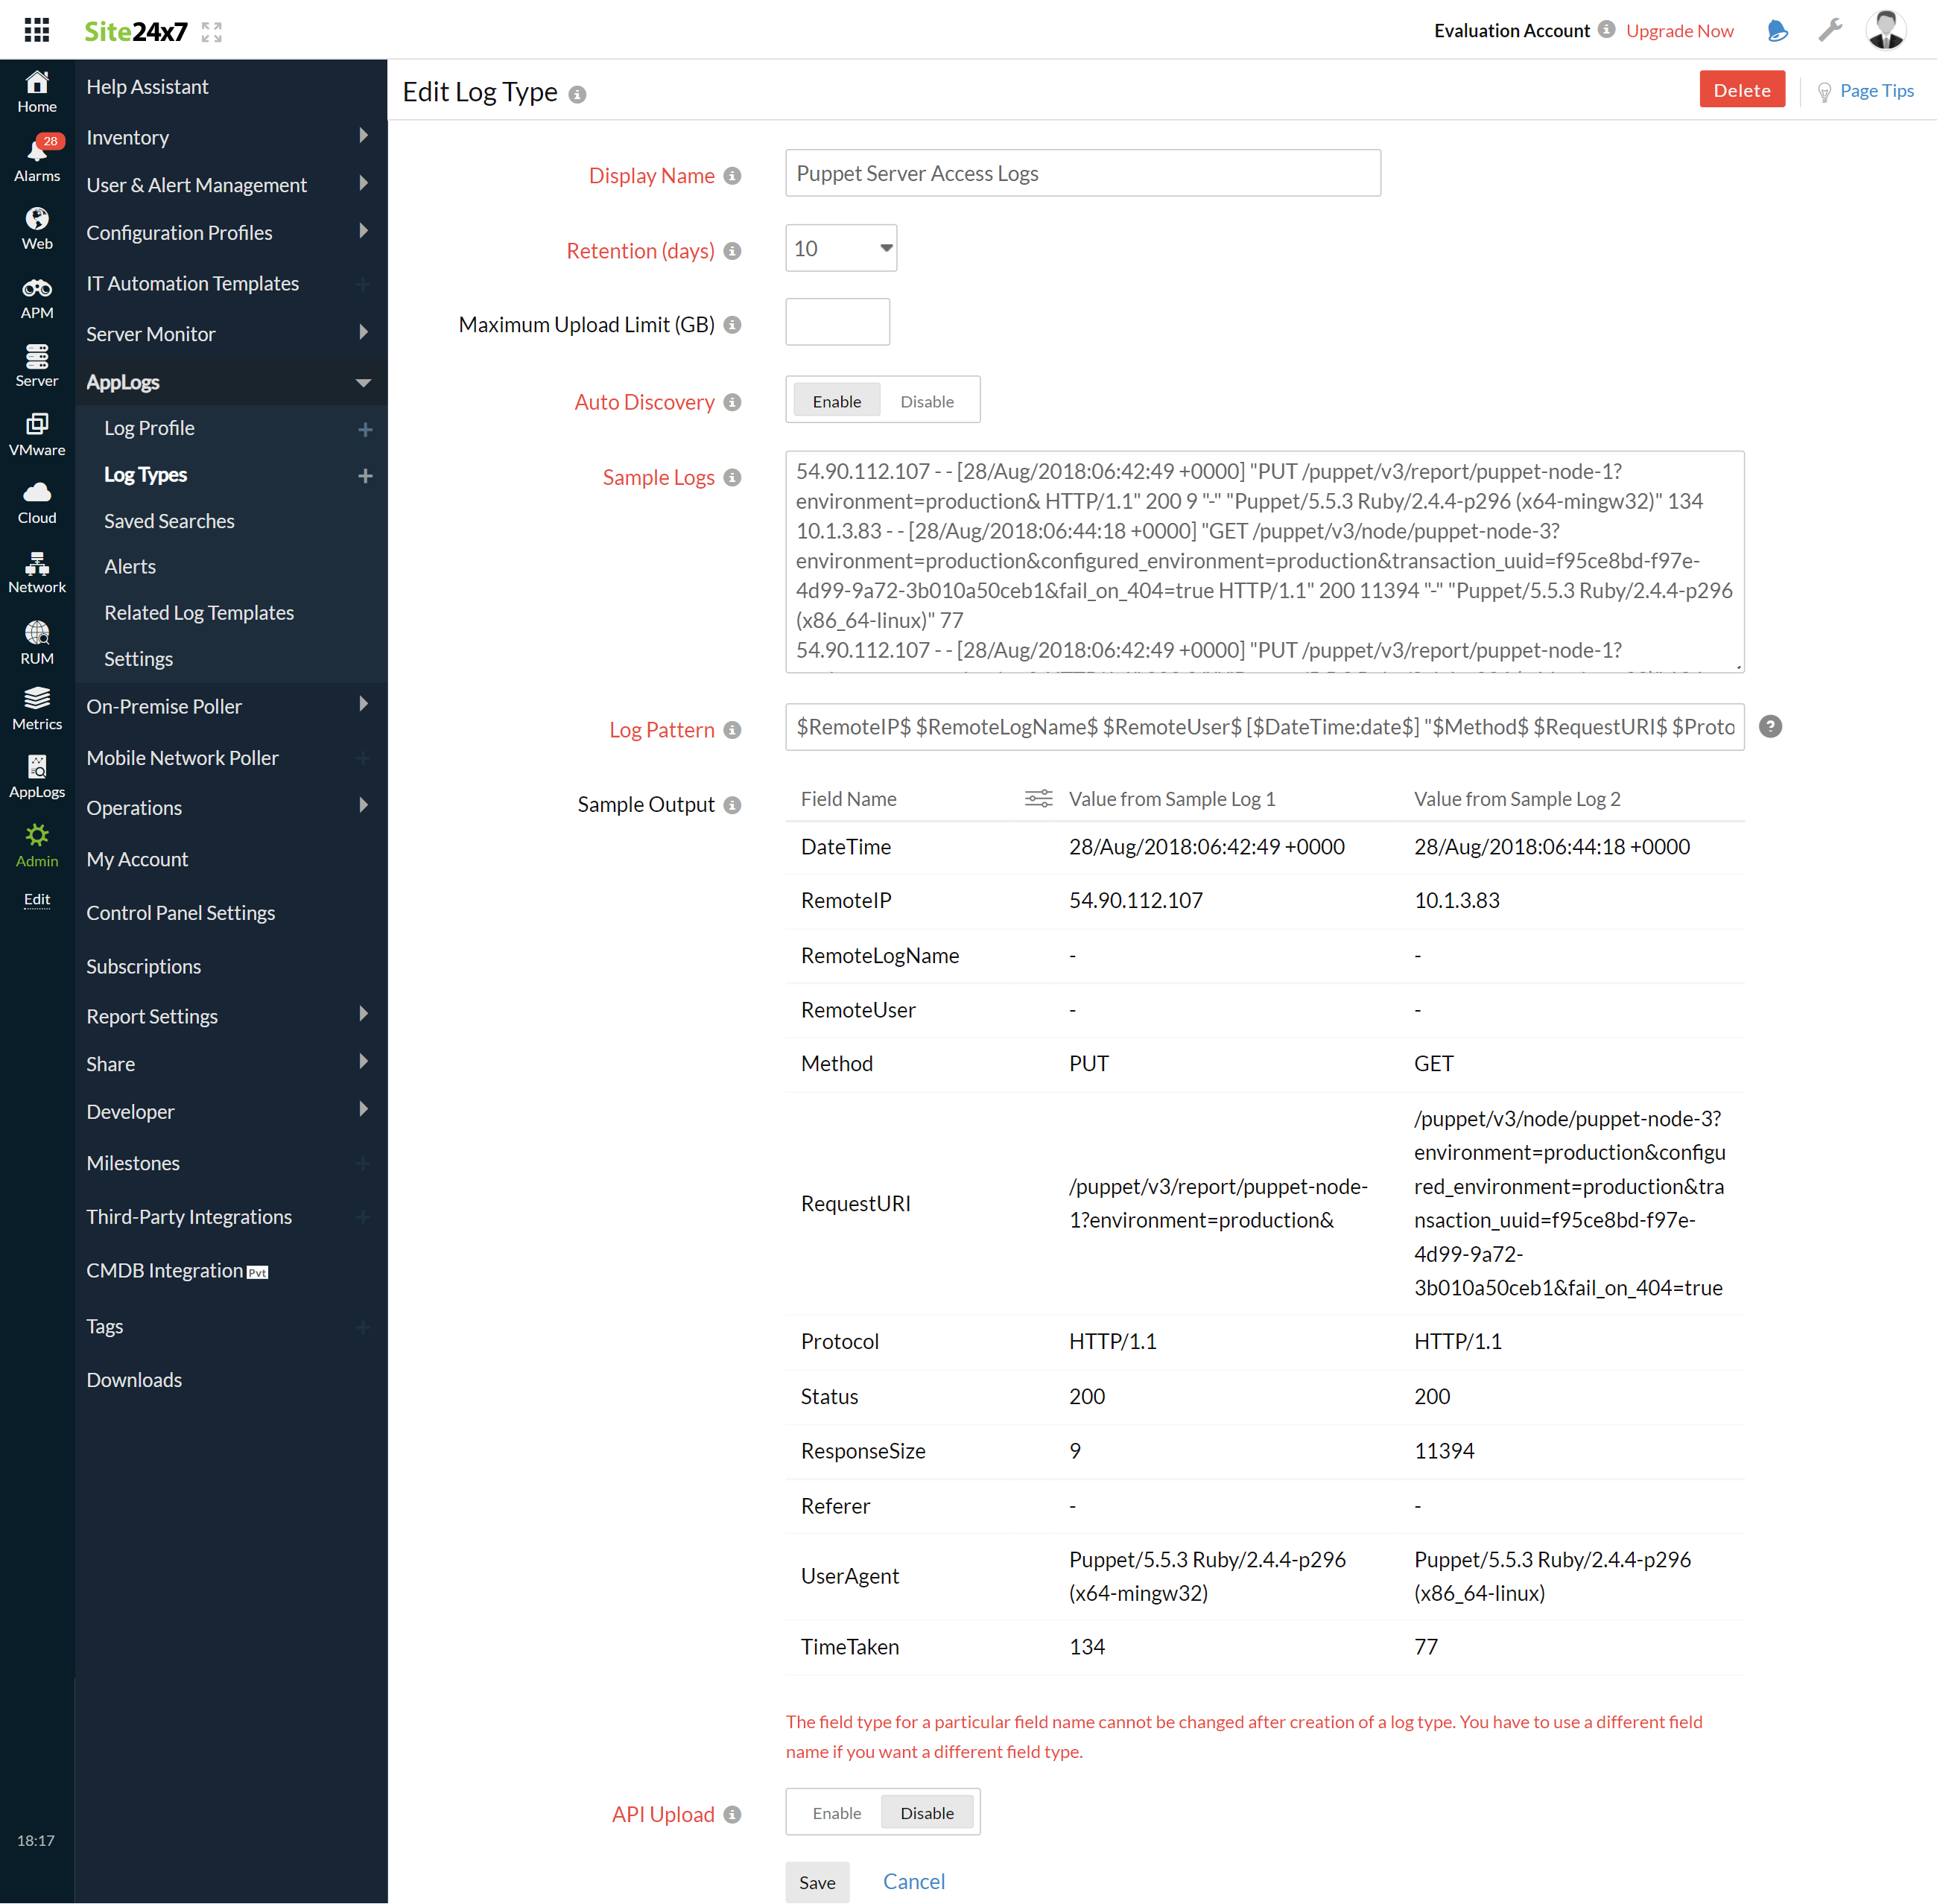
- The Sample Logs and Log Pattern are displayed below.
Sample Logs:
54.90.112.107 - - [ 28/Aug/2018:06:42:49 +0000 ] " PUT /puppet/v3/report/puppet-node-1?environment=production& HTTP/1.1 " 200 9 " - " " Puppet/5.5.3 Ruby/2.4.4-p296 (x64-mingw32) " 134
10.1.3.83 - - [ 28/Aug/2018:06:44:18 +0000 ] " GET /puppet/v3/node/puppet-node-3?environment=production&configured_environment=production&transaction_uuid=f95ce8bd-f97e-4d99-9a72-3b010a50ceb1&fail_on_404=true HTTP/1.1 " 200 11394 " - " " Puppet/5.5.3 Ruby/2.4.4-p296 (x86_64-linux) " 77
These logs are separated into fields, each of which takes its respective value and is then uploaded to Site24x7.
- By default, this is the Log Pattern identified by AppLogs for Puppet server access logs:
$RemoteIP$ $RemoteLogName$ $RemoteUser$ [ $DateTime:date$ ] " $Method$ $RequestURI$ $Protocol$ " $Status:number$ $ResponseSize:number$ " $Referer$ " " $UserAgent$ " $TimeTaken:number$
- You can add a custom Log Pattern instead of the default one. To do so, click the pencil icon and specify your pattern.

6. Select the Local File as the Log Source.
7. By default, the path below is used as the file source:
Linux: "/var/log/puppetlabs/puppetserver/puppetserver-access.log"
- If your source path is different from the default path, specify in the List of files to search for logs field.
8. Select either monitors or monitor groups to collect the logs.

9. Click Save.
Dashboard
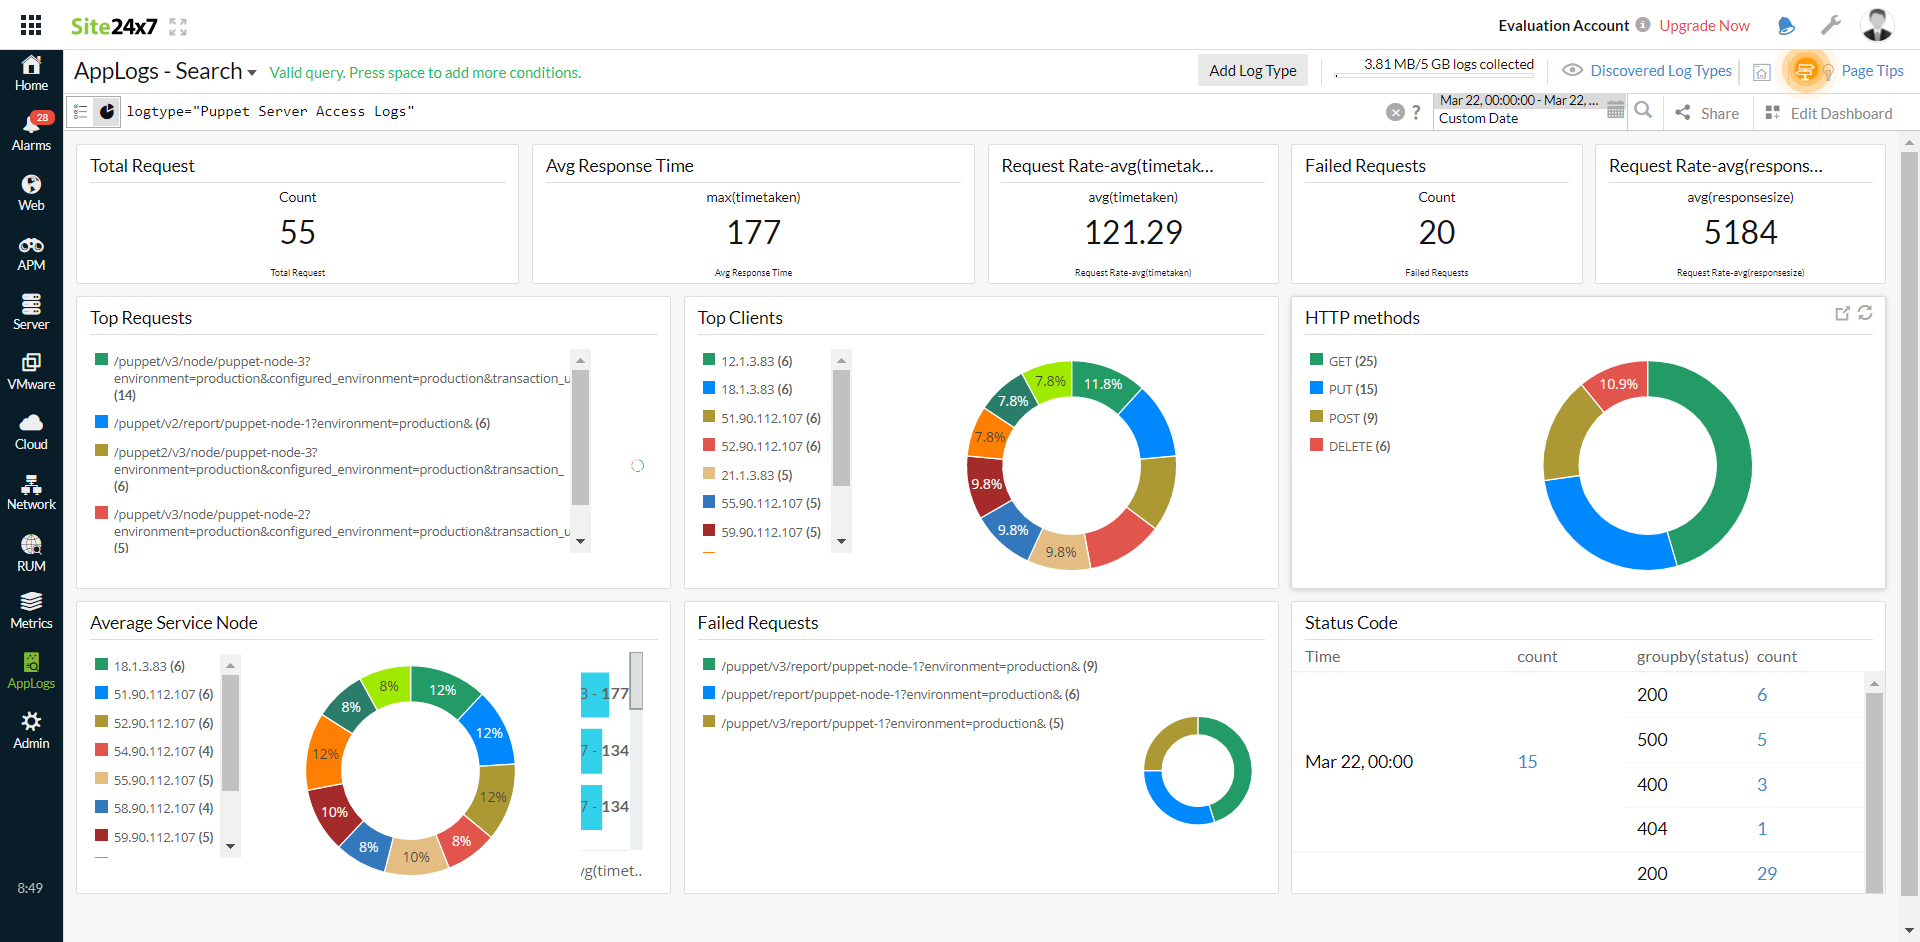
AppLogs creates an exclusive dashboard for every log type and shows a few widgets by default. Here's a list of the widgets available on the Puppet server access logs dashboard:
- Total Requests
- Failed Requests
- Successful Requests
- Average Response Time
- Top 10 Client IPs
- HTTP Methods
- Top 50 Successful Requests
- Top 20 Failed Requests
- Status Code Stats
- User Agent Stats
- Response Time Stats
- Request Trend
- Average Service Time per Puppet Node

Related log types
-
On this page
- Getting started
- Dashboard
- Related log types
