Puppet Server Logs
Puppet is a configuration management tool built by Puppet Labs to automate infrastructure management and configuration. Site24x7 AppLogs provides built-in support for Puppet server logs.
Getting started
1. Log in to your Site24x7 account.
2. Download and install the Site24x7 Server Monitoring Agent (Windows | Linux).
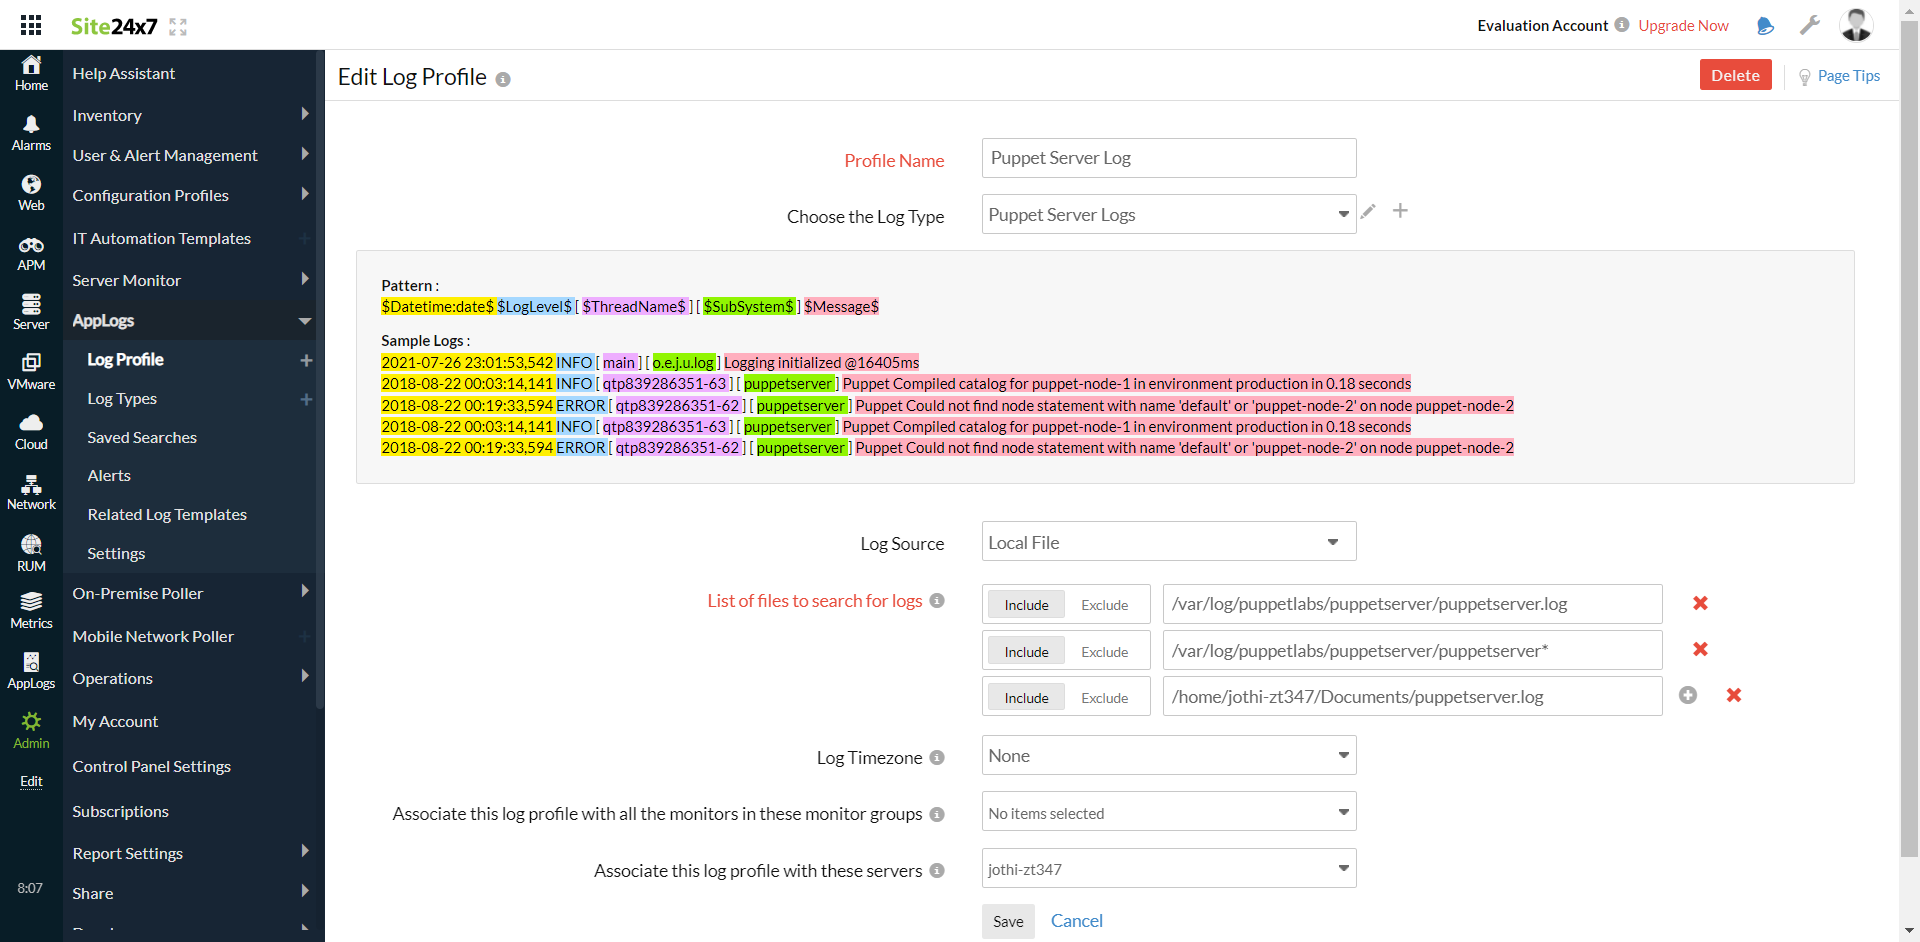
3. Go to Admin > AppLogs > Log Profile and select Add Log Profile.
4. Enter the Profile Name.
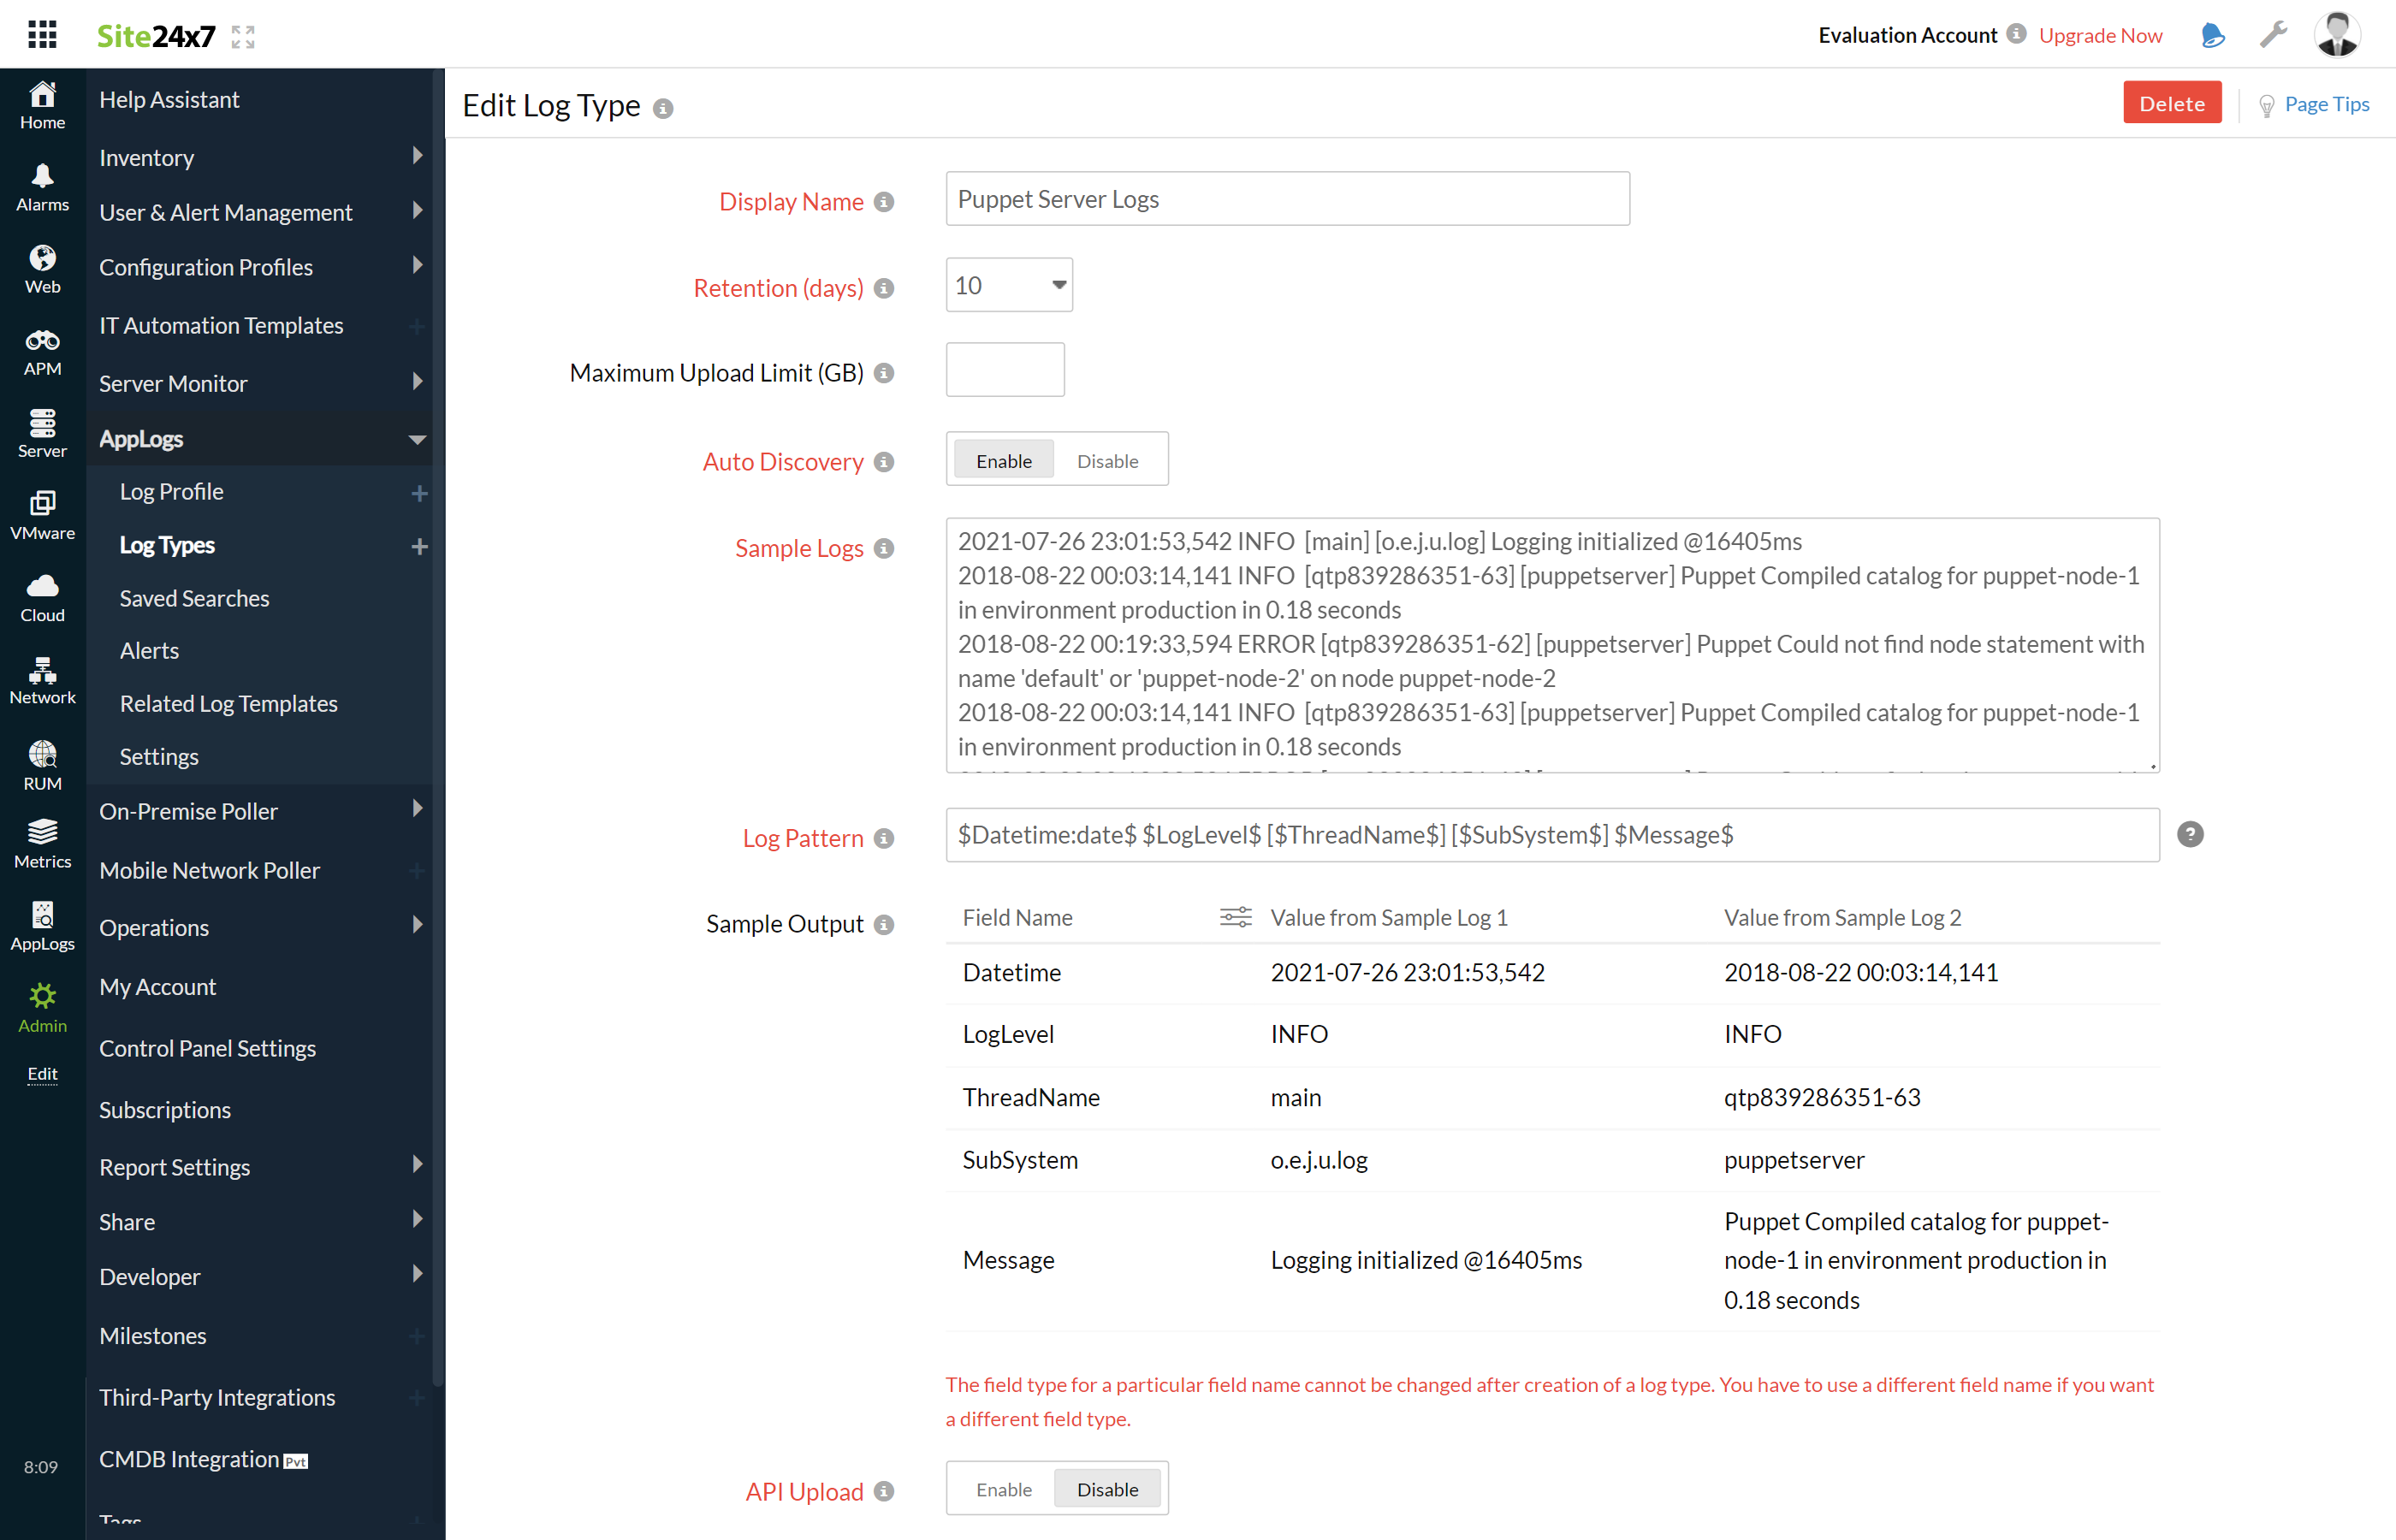
5. Select Puppet server logs from the Choose the Log Type dropdown.
- The Sample Logs and Log Pattern are displayed below.
Sample Logs:
2021-07-26 23:01:53,542 INFO [ main ] [ o.e.j.u.log ] Logging initialized @16405ms
2018-08-22 00:03:14,141 INFO [ qtp839286351-63 ] [ puppetserver ] Puppet Compiled catalog for puppet-node-1 in environment production in 0.18 seconds
2018-08-22 00:19:33,594 ERROR [ qtp839286351-62 ] [ puppetserver ] Puppet Could not find node statement with name 'default' or 'puppet-node-2' on node puppet-node-2
These logs are separated into fields, each of which takes its respective value and is then uploaded to Site24x7.
- By default, this is the Log Pattern identified by AppLogs for Puppet server logs:
$Datetime:date$ $LogLevel$ [ $ThreadName$ ] [ $SubSystem$ ] $Message$
- You can add a custom Log Pattern instead of the default one. To do so, click the pencil icon and specify your pattern.

6. Select the Local File as the Log Source.
7. By default, the path below is used as the file source:
Linux: "/var/log/puppetlabs/puppetserver/puppetserver.log"
- If your source path is different from the default path, specify in the list of files to search for logs field.
8. Select either monitors or monitor groups to collect the logs.

9. Click Save.
Dashboard
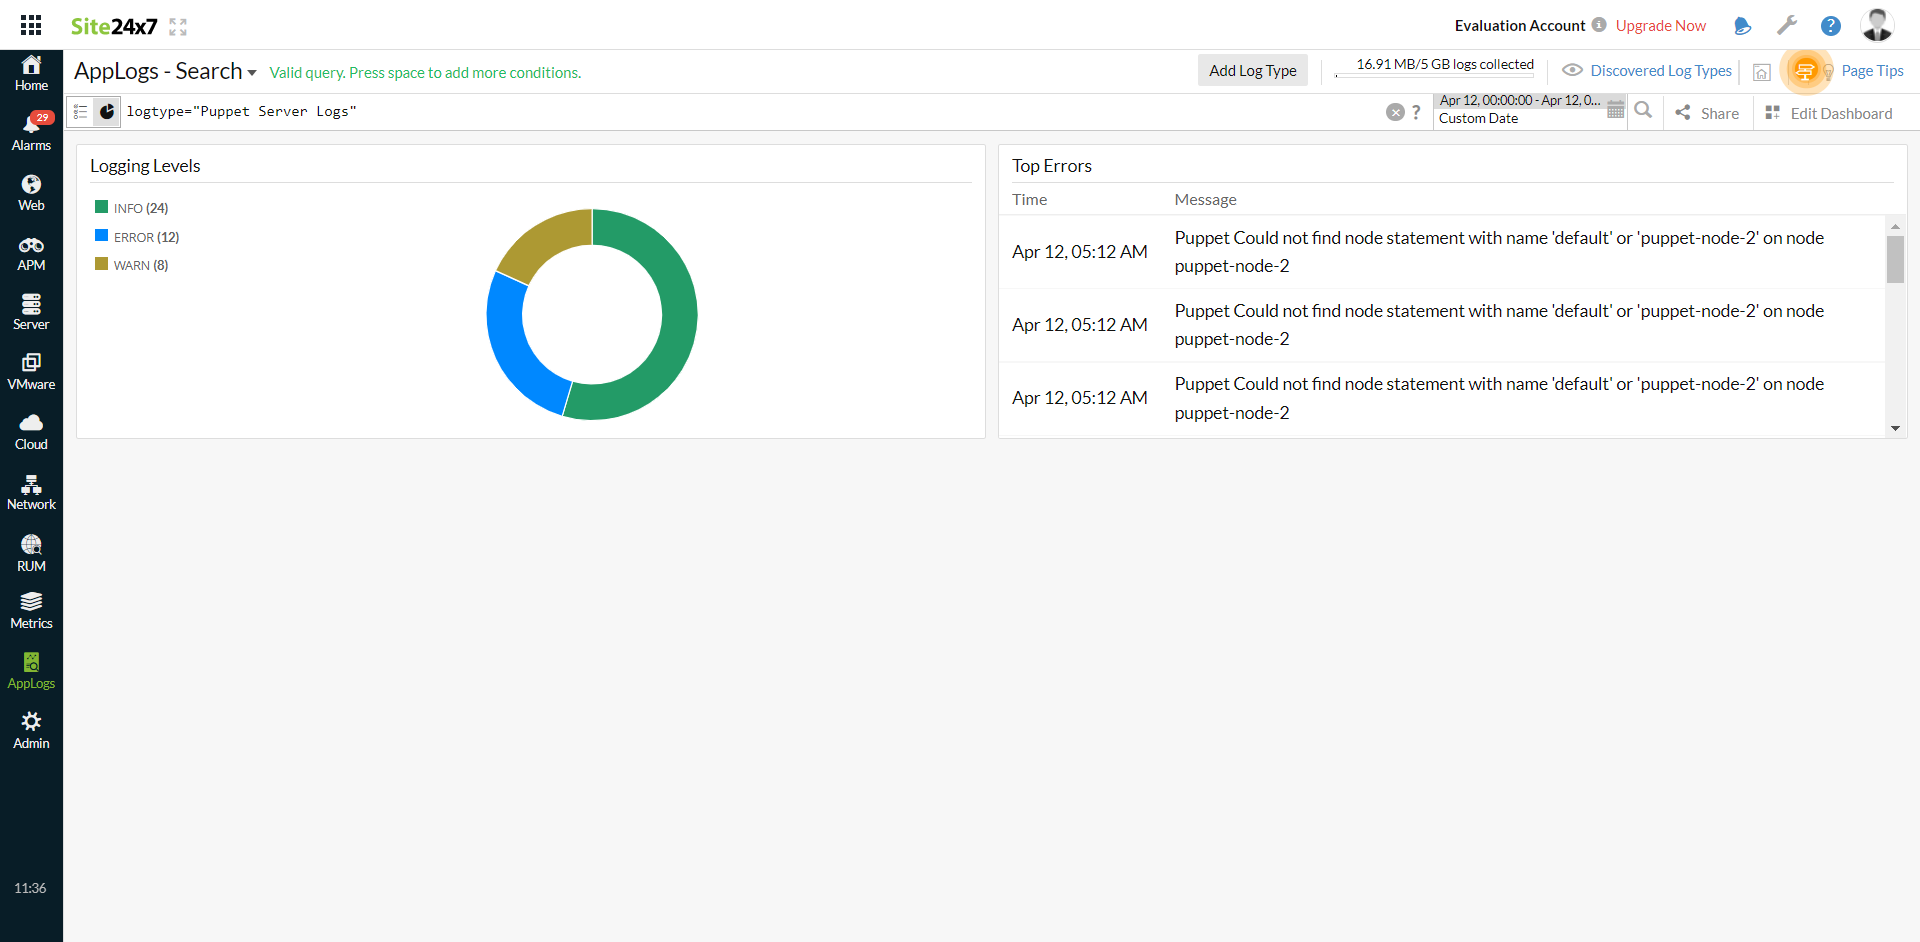
AppLogs creates an exclusive dashboard for every log type and shows a few widgets by default. Here's a list of the widgets available on the Puppet server logs dashboard:
- Logging Level
- Top Errors

Related log types
-
On this page
- Getting started
- Dashboard
- Related log types
