Data Lake dashboard
Once you've successfully added a data lake monitor via Custom Source or REST API integration, you'll be directed to the data lake dashboard. You can also access it by navigating to Metrics, then Data Lake.
Get a holistic view of your Data Lake monitors. The dashboard categorizes your monitors based on their status (Up, Trouble, Critical, or Down).
If you have created a Custom Source monitor but haven't pushed any data yet, follow these steps to do so.
Monitors view
Gives an overall summary of the Data Source, Fields Count, and Custom Attributes Monitors Count.
You can identify the monitor type (Custom Source or RESTAPI Metric) using the Data Source column.
Edit monitor
Custom Source monitor
You can update the details of the existing monitor.
- Click the hamburger icon (
 ) beside the monitor name. Click Edit.
 - In the Edit Data Lake Monitor page, you can modify the monitor's settings, including its associated monitor groups and data filtering criteria.
The Include Tags option allows you to refine the data pushed via SDK/API by specifying tag-based filters such as Starts With, Contains, or Ends With, ensuring that only the relevant metrics are processed.
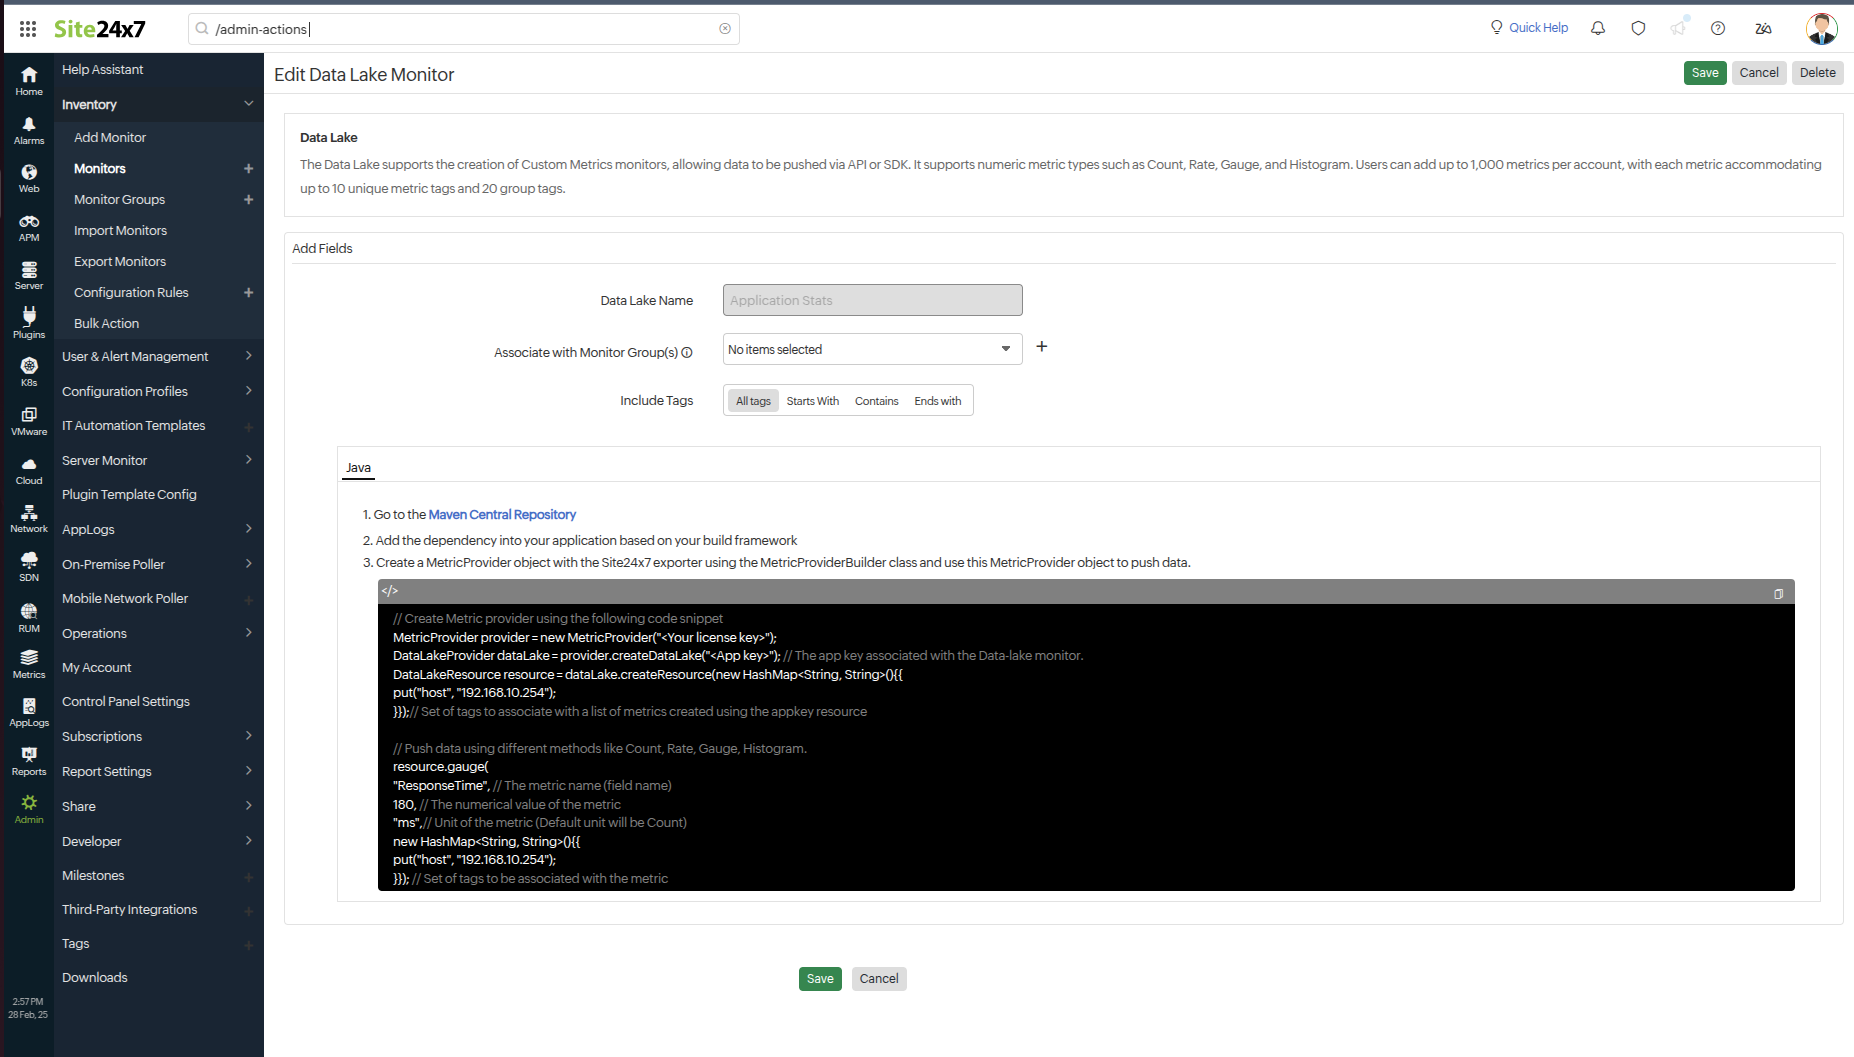
- Save your changes.
REST API Metric monitor
You can update the details of the existing REST API Metric monitor.
- Click the hamburger icon () beside the monitor name, then click Edit from the drop-down list.
-
In the Edit REST API Metric monitor page, you can modify the monitor's basic settings and include new Metric Configurations by selecting the fields from the API response.
NoteYou cannot edit the previously added fields in Metric Configuration.
- Click Save to save your changes.

Delete monitor
You can delete any data lake monitor that is no longer needed.
- Click the hamburger icon () beside the monitor name.
- Click Delete.
Fields view
Gives a comprehensive list of all the fields from all monitors. You can view details like Monitor Name, Unit Type, Tags, Description, Last Polled Value, and Last Polled time.
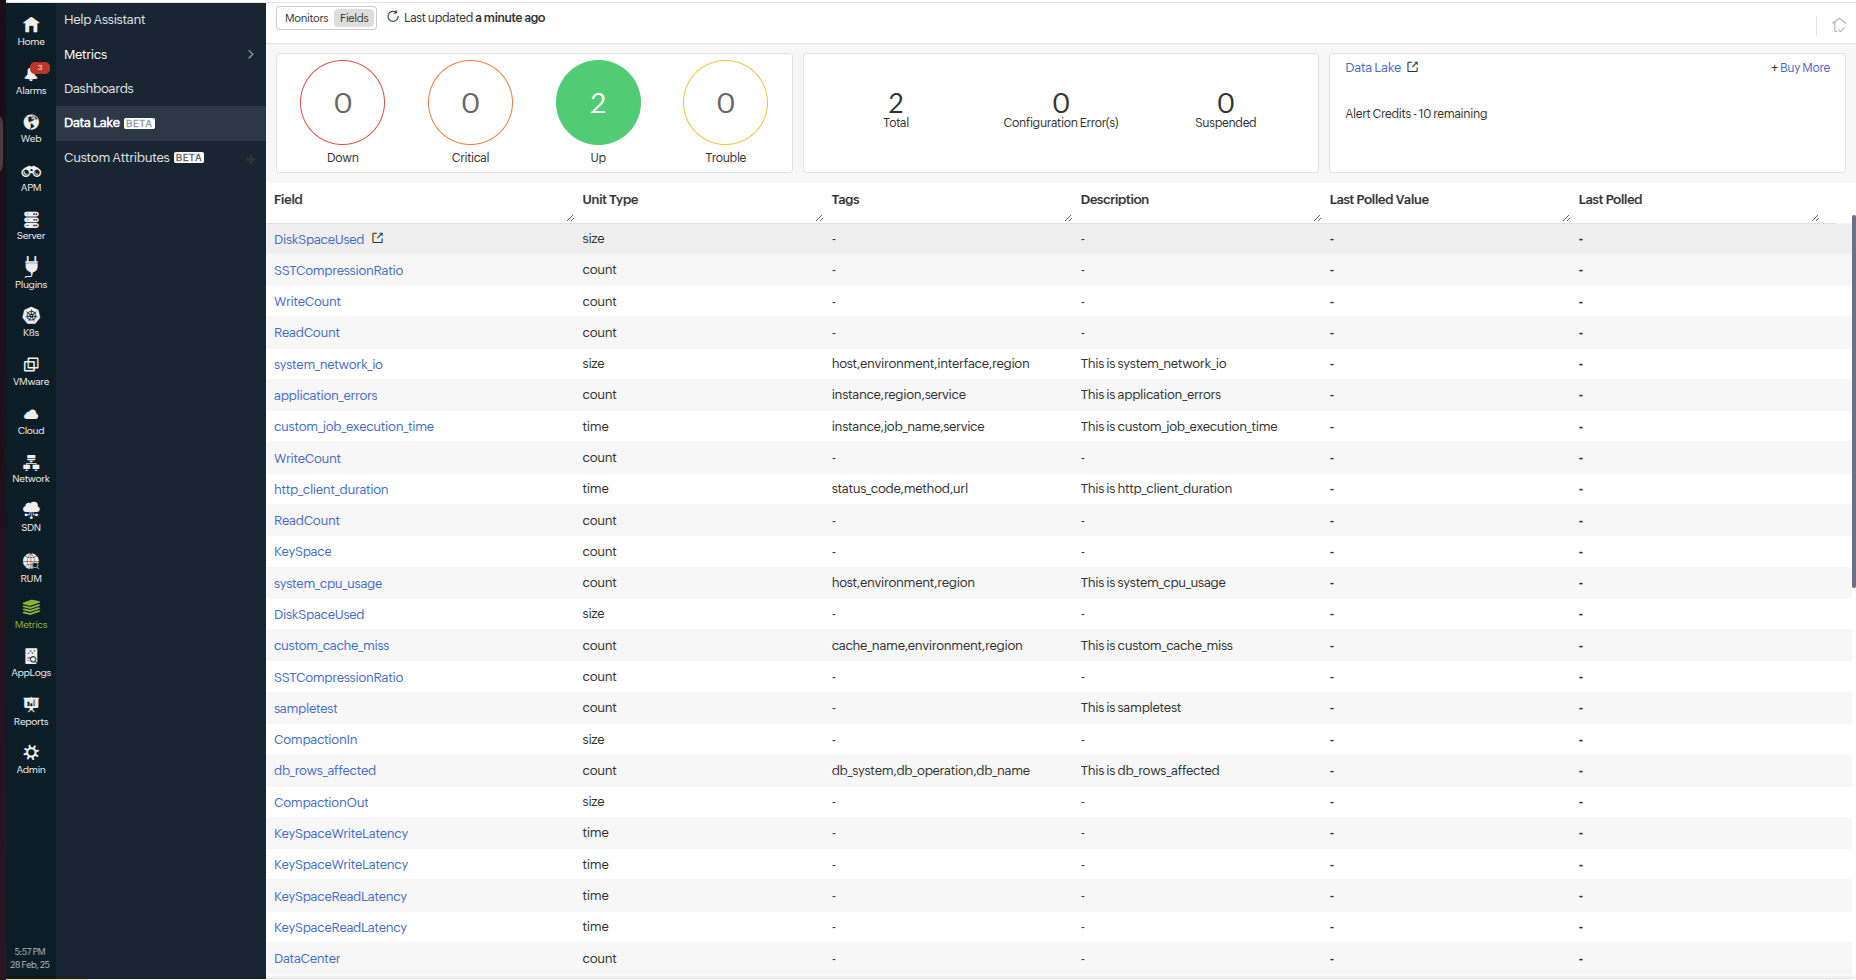
You can click on the required monitor to view the performance metrics.