Router performance
The Routing tab in Site24x7 provides real-time visibility into the health of dynamic routing protocols like Border Gateway Protocol (BGP), Open Shortest Path First (OSPF), and Enhanced Interior Gateway Routing Protocol (EIGRP). It also tracks router availability, responsiveness, and performance metrics such as buffer hits and misses.
Use case
An enterprise network admin needs to monitor the availability and routing efficiency of routers at various branch offices. This dashboard enables them to:
- Identify failing or flapping BGP/OSPF/EIGRP routing sessions.
- Monitor router availability and response time.
- Detect performance degradation through buffer miss/hit statistics.
- Set thresholds to trigger alerts when routing or performance deviates from normal.
Performance metrics
Router performance metrics monitoring is supported from On-Premise Poller version 6.5.0 and above.
BGP peer metrics
Displays the status and health of BGP peer connections.
| Column | SNMP OID | Description |
|---|---|---|
| Peer IP Address | .1.3.6.1.2.1.15.3.1.1 | IP of the BGP peer router |
| Remote AS Number | .1.3.6.1.2.1.15.3.1.9 | Remote autonomous system number |
| State | .1.3.6.1.2.1.15.3.1.2 | Session state: idle, connect, active, opensent, openconfirm, or established |
| Admin State | .1.3.6.1.2.1.15.3.1.3 | Indicates if the session is administratively enabled (start) |
| Flaps | - | Number of state transitions |
| In Updates | .1.3.6.1.2.1.15.3.1.10 | BGP routing updates received |
| Out Updates | .1.3.6.1.2.1.15.3.1.11 | BGP routing updates sent |
| Total Messages Sent | .1.3.6.1.2.1.15.3.1.13 | Total BGP messages sent |
| Total Messages Received | .1.3.6.1.2.1.15.3.1.12 | Total BGP messages received |
| Status | Visual cue for router health: Green (Up), Red (Down) | |
| Action | Click the pencil icon |
OSPF neighbor metrics
Tracks OSPF neighbor states and their transitions.
| Column | SNMP OID | Description |
|---|---|---|
| Route ID | .1.3.6.1.2.1.14.10.1.3 | Identifies the unique router ID used in OSPF to distinguish each router in the network |
| Neighbor IP Address | .1.3.6.1.2.1.14.10.1.1 | Specifies the IP address of the OSPF or BGP neighbor router with which adjacency or peering is established |
| State | .1.3.6.1.2.1.14.10.1.6 | OSPF state: down, attempt, init, twoWay, exchangeStart, exchange, loading, or full |
| Priority | .1.3.6.1.2.1.14.10.1.5 | Router priority for DR/BDR election |
| Flaps | Number of adjacency resets | |
| Status | Green = Adjacency is up Red = Adjacency is down | |
| Action | Click the pencil icon |
EIGRP peer metrics
| Column | SNMP OID | Description |
|---|---|---|
| Peer IP Address | .1.3.6.1.4.1.9.9.449.1.4.1.1.3 | The IP address of the EIGRP neighbor router with which the local router is forming a peer relationship. |
| Peer Interface Index | .1.3.6.1.4.1.9.9.449.1.4.1.1.4 | Identifies the interface on the local router through which the EIGRP peer is reachable (shown as an index number). |
| Peer Uptime | .1.3.6.1.4.1.9.9.449.1.4.1.1.6 | The duration for which the EIGRP peer relationship has remained continuously up. Helps identify recently reset or unstable peers. |
| Smooth Round Trip Time (SRTT) | .1.3.6.1.4.1.9.9.449.1.4.1.1.7 | An average measurement (in milliseconds) of the time taken for EIGRP packets to make a round trip to the peer and back. Lower values indicate better responsiveness. |
| Retransmission Timeout (RTO) | .1.3.6.1.4.1.9.9.449.1.4.1.1.8 | The time (in milliseconds) EIGRP waits before retransmitting unacknowledged packets. High values may suggest network delays or packet loss. |
| Packets Enqueued | .1.3.6.1.4.1.9.9.449.1.4.1.1.9 | The number of packets queued for transmission to the peer. Persistent high values could indicate congestion or processing delays. |
| Last Sequence Number | .1.3.6.1.4.1.9.9.449.1.4.1.1.10 | The most recent EIGRP sequence number exchanged with the peer. Used to track and order routing updates. |
| Flaps | The number of times the EIGRP peer session has gone up and down. High flap counts may signal instability. | |
| Status | Indicates the current status of the peer session. | |
| Action | Click the pencil icon |

Buffer Hit Statistics and Buffer Miss Statistics
Track and monitor the availability and response time of routers configured on your network. Gain deep visibility into key performance indicators that help identify hardware or congestion issues.
| Parameter | Description |
|---|---|
| Buffer Hit Statistics | Shows the average number of buffer hits over time, categorized by buffer size (huge, large, big, medium). A hit indicates successful packet buffering. |
| Buffer Miss Statistics | Shows the average number of buffer misses over time, categorized by buffer size (big, small, medium, large). A miss indicates packet drops due to insufficient buffer availability. |
Additional features
-
Time Filter: Toggle between time ranges (e.g., Last Month) to spot trends.
-
Incident Chat: Collaborate instantly during network events.
-
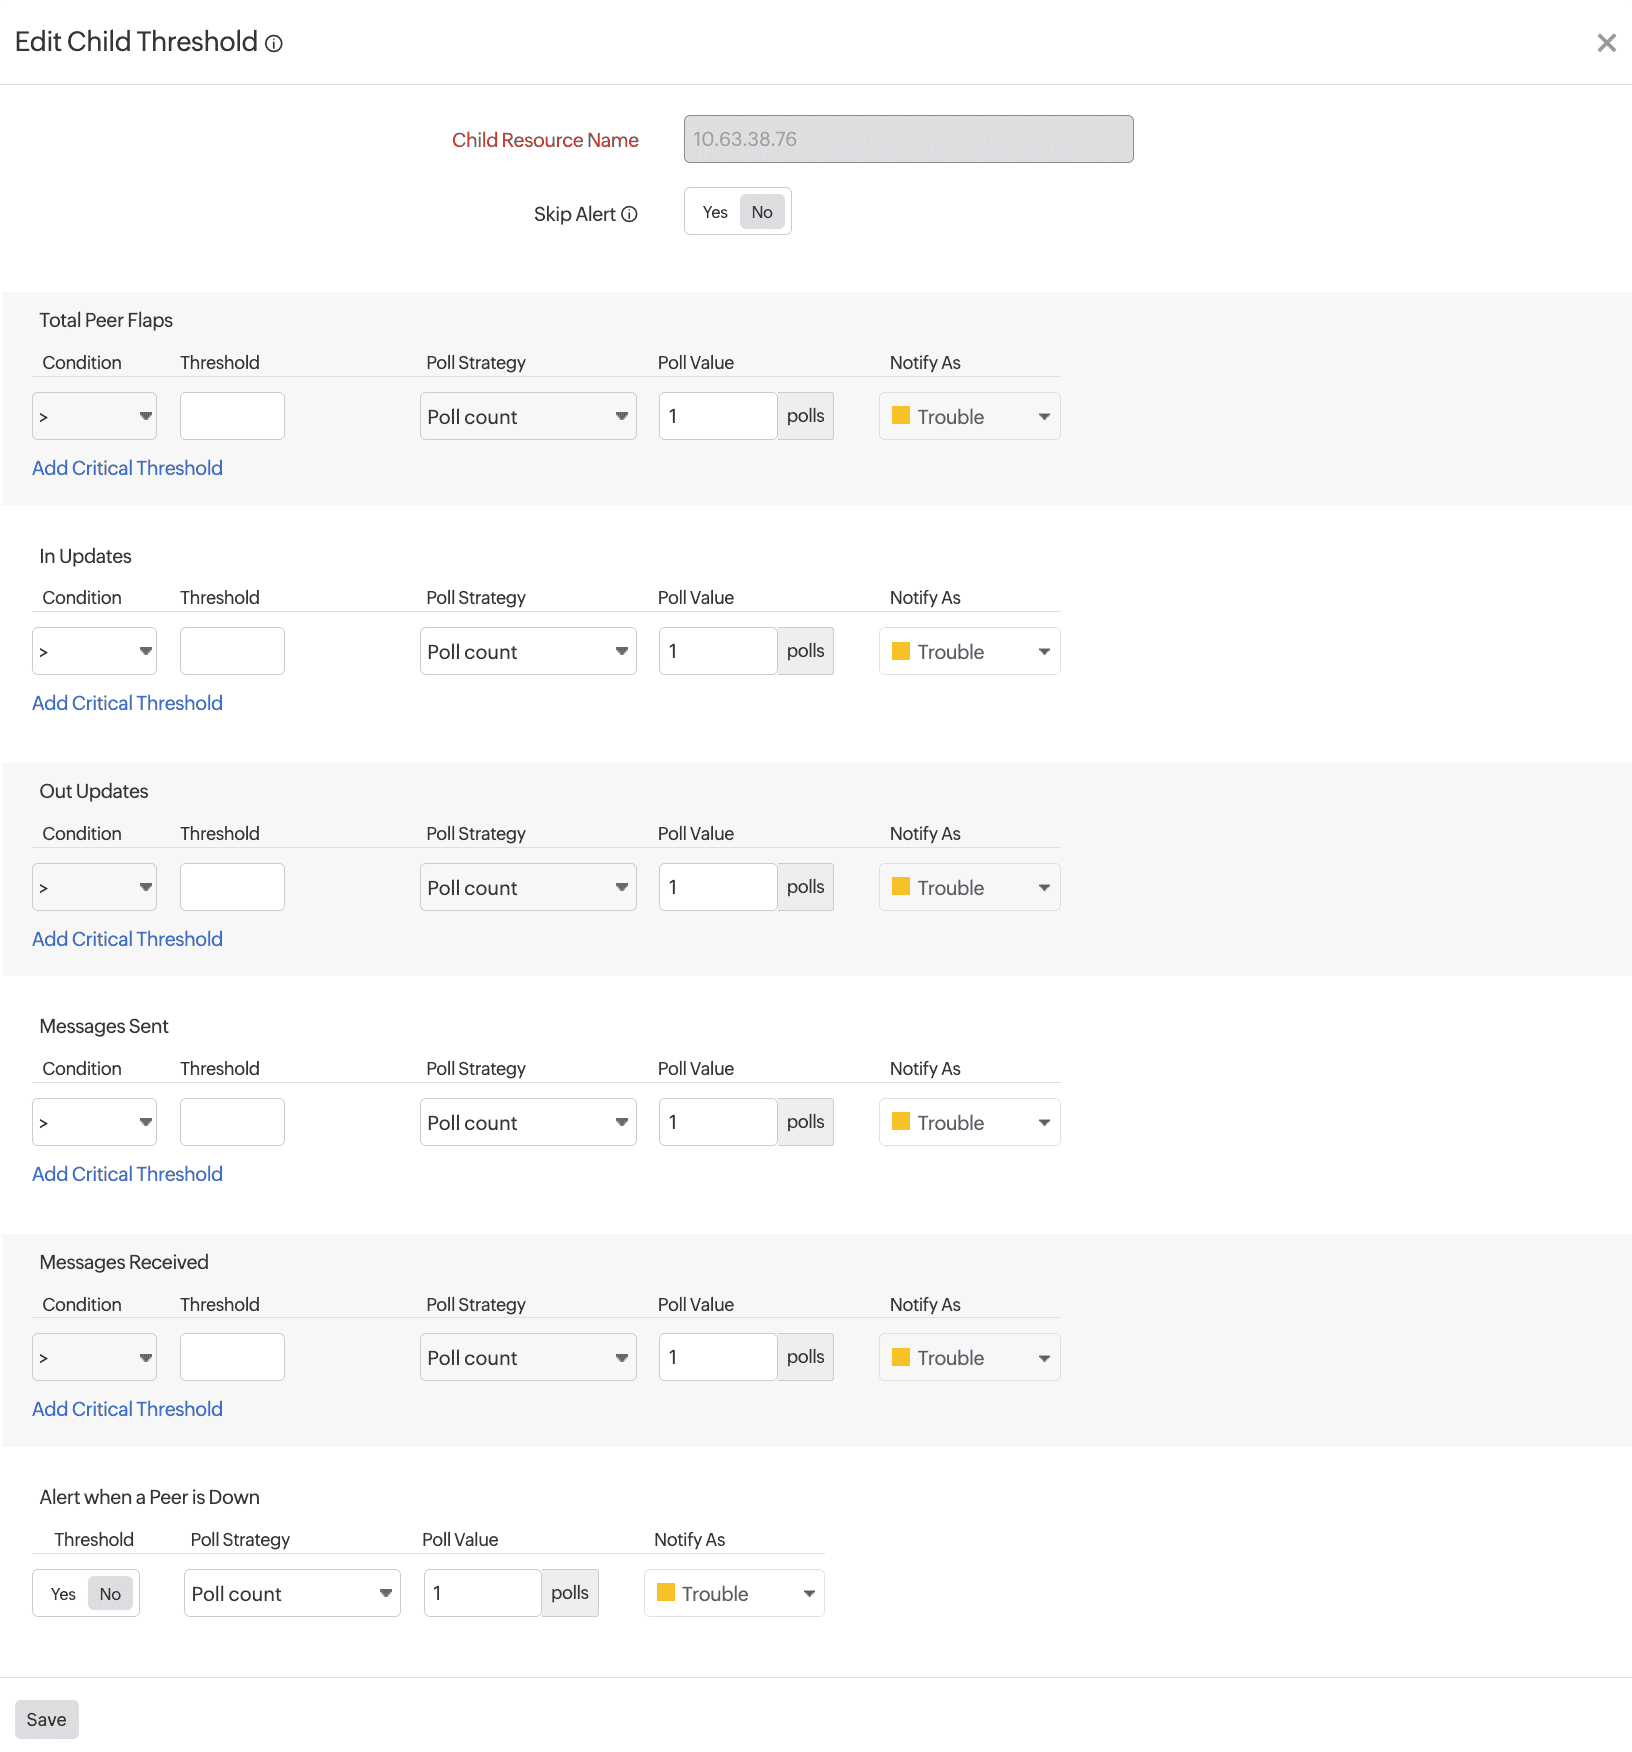
Threshold Configuration: Define and manage performance thresholds to get proactive alerts.
Best practices
- Prioritize BGP sessions not in established and OSPF neighbors not in full.
- Use flap count thresholds to track unstable routing sessions.
- Monitor buffer miss spikes—they often precede packet loss or slowdowns.
- Leverage historical data to correlate routing changes with performance dips.