Topology View
The Topology View is an intuitive visual interface that maps and displays your entire OCI infrastructure across multiple dimensions - compartment, region, and service type. This hierarchical, bird's-eye view enables users to comprehend the scope and interdependencies of OCI resources, simplifying the process of managing and troubleshooting cloud environments.
Overview
The Topology View automatically populates based on your monitored OCI compartments, visually representing resources as interactive nodes that are organized across three levels:
- OCI Compartment level: Represents individual OCI compartments you’ve integrated with Site24x7.
- Region level: Segments resources geographically based on the OCI region in which they’re hosted.
- Service type level: Clusters OCI services under each region for detailed exploration and quick health assessment.
Use case
A financial services company runs its core APIs on OCI across multiple compartments for production, staging, and analytics. One morning, customers start reporting delays when fetching compartment details. The operations team checks their usual performance dashboards, but nothing clearly points to the problem. They open the OCI Topology View to understand what is happening across regions.
They see a warning badge on the Sydney, Australia (ap-sydney-1) region in the production compartment. When they zoom in, the Base Database monitor shows a degraded state. The related connections between the database and the application subnet also show increased query latency. This helps the team trace the slowdown to an unplanned spike in storage IOPS caused by a batch job that started earlier in the day.
With this context, they pause the batch job and scale the database storage to stabilize performance. The visual layout helps them identify where the slowdown began and how it affected the application path, reducing investigation time and preventing a larger outage.
Benefits of the Topology View
You can leverage the following benefits with the Topology View feature:
- Unified visualization: See all your OCI compartments, regions, and services in a single, interactive topology map.
- Faster troubleshooting: Identify impacted services and their regional dependencies quickly with a color-coded health view.
- Simplified resource discovery: Easily locate and navigate to specific services without needing to sift through multiple dashboards.
- Improved operational awareness: Gain real-time insight into infrastructure health, regional deployments, and cross-compartment resource distribution.
Key UI components
The Topology View provides a dynamic, node-based visual representation of your entire monitored OCI infrastructure. The interface is designed to help users quickly identify the health and structure of their OCI environments across different compartments, regions, and service types.
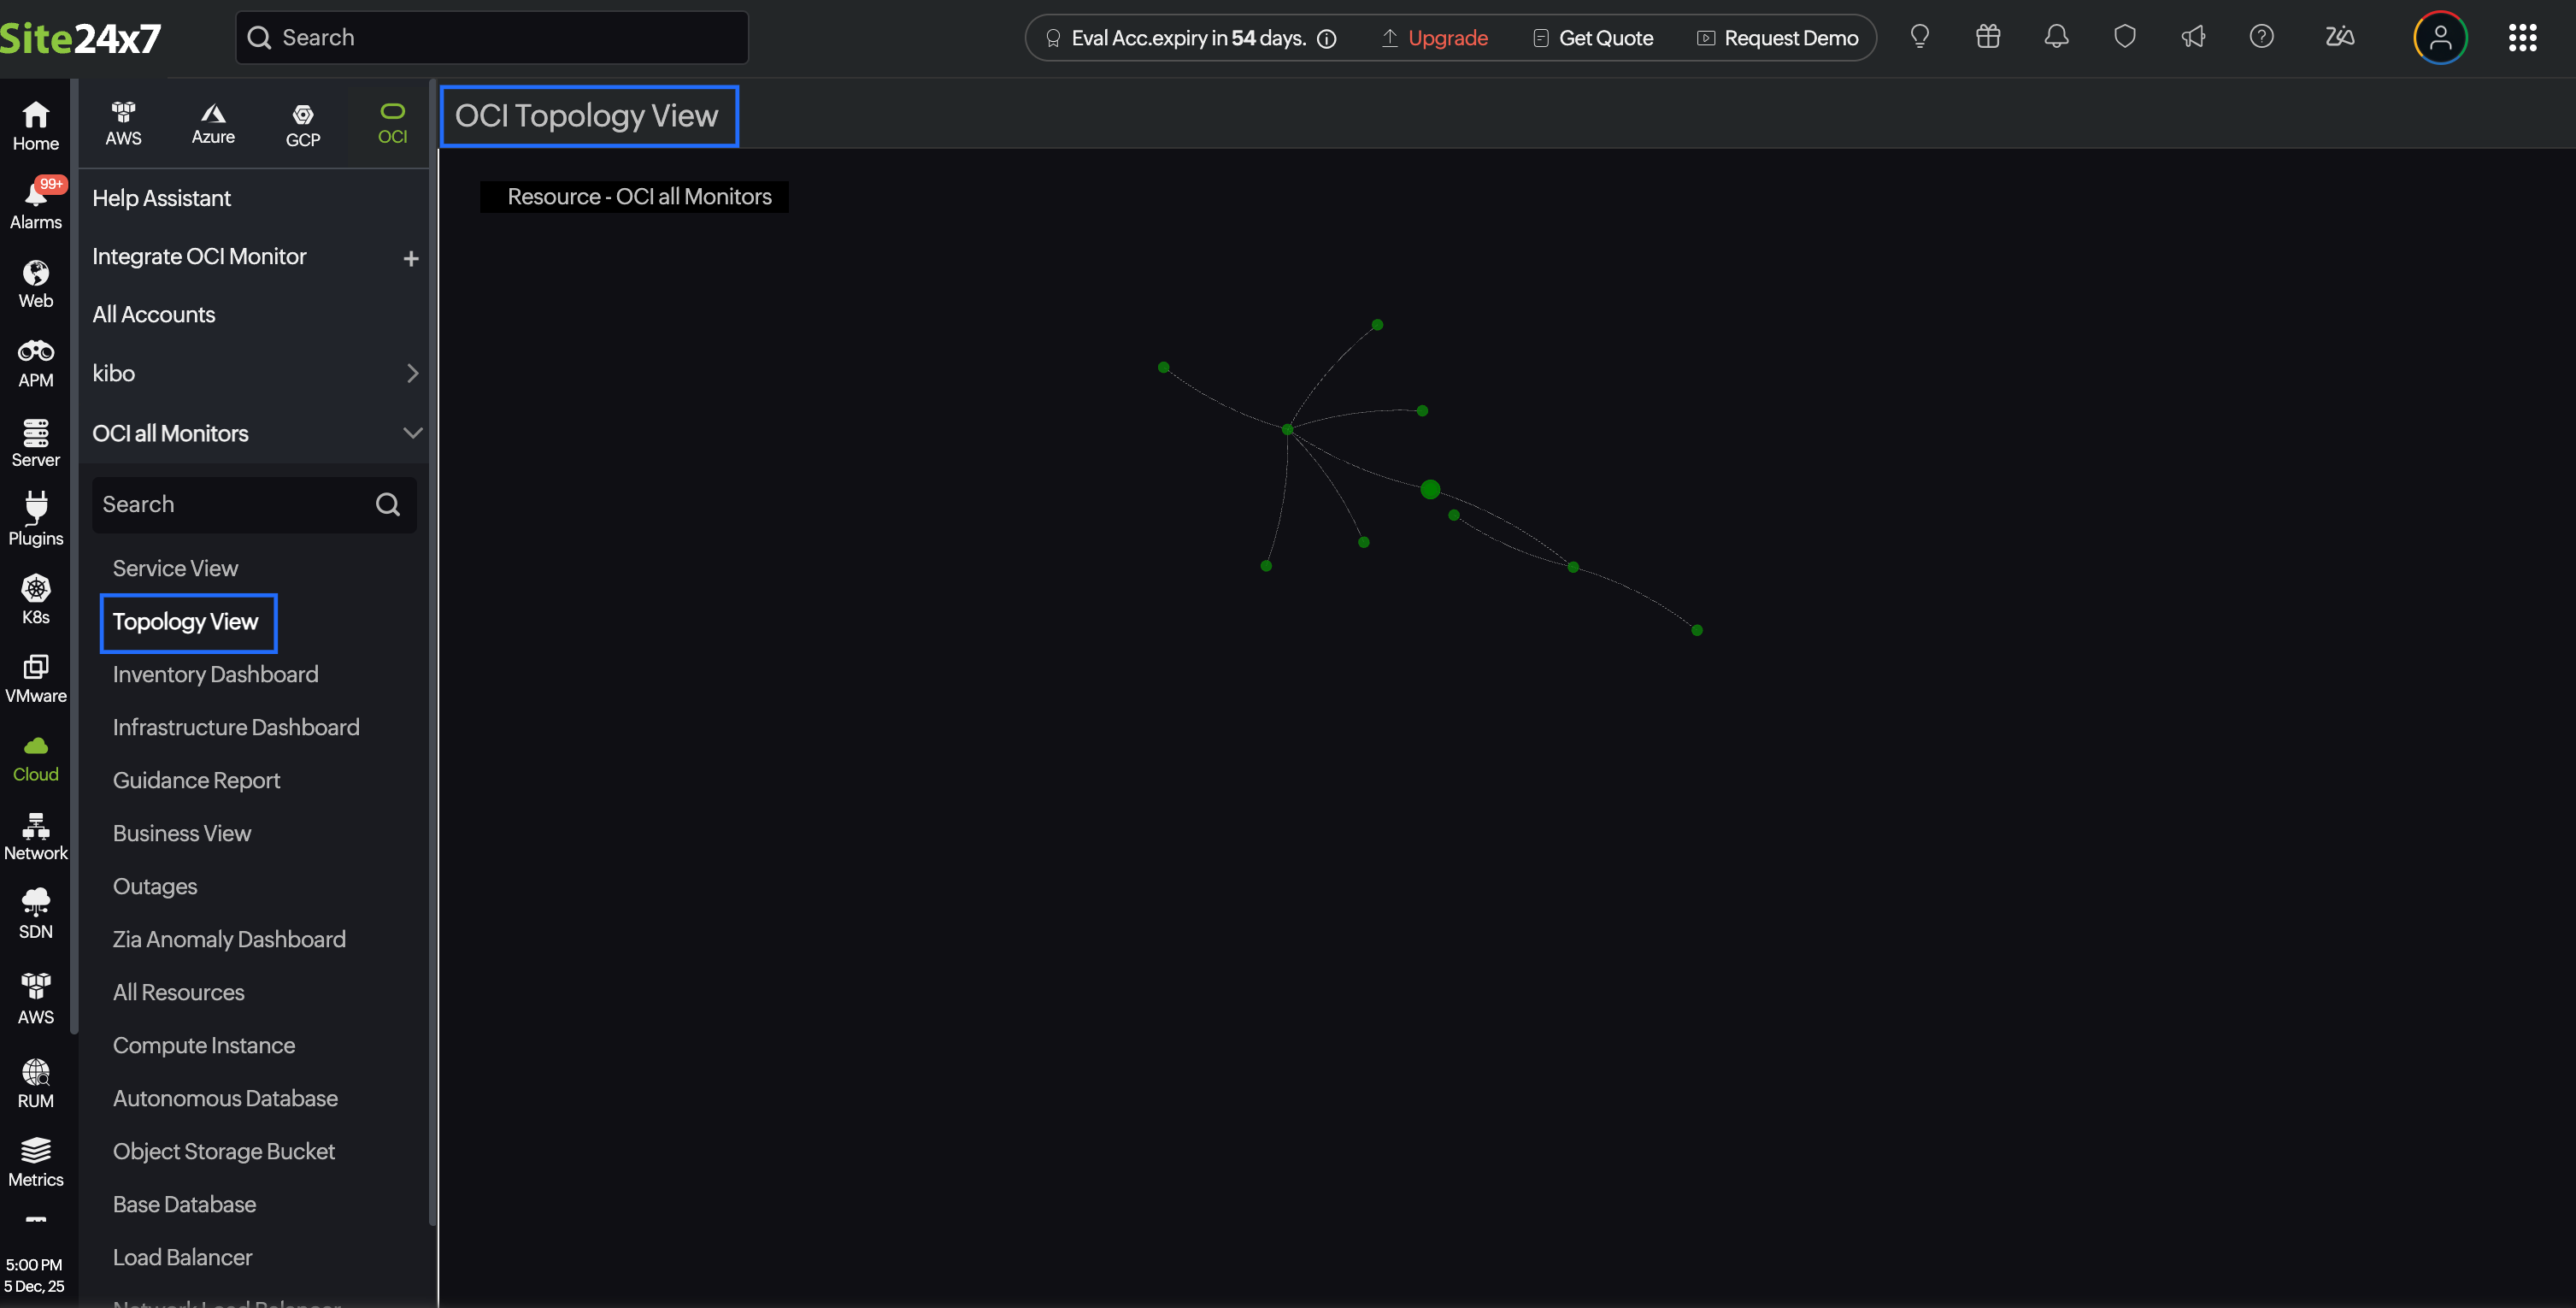
Central node
At the center of the visualization is the root node, which represents the top-level grouping of all your OCI compartments and associated regions.
Radial node layout
Branching out from the central node are multiple interconnected nodes, each representing different OCI regions. These, in turn, expand into service types within each region. The radial layout helps users easily trace paths from the top level to individual services.
Zoom and pan
Explore large topologies efficiently using zoom controls and pan navigation. Clicking a node typically displays the Component Details View panel with more in-depth details for that service or region.
Health status legends
A legend panel is provided to interpret color codes and understand resource health at a glance. Each node is color-coded to reflect the health of the corresponding component.
Component Details View
When you click on a node, the Component Details View panel appears on the right side. You can drill down into the specific region or service type. The UI visually shifts focus to that part of the topology, expanding or collapsing views accordingly. This makes root cause isolation faster and more intuitive.
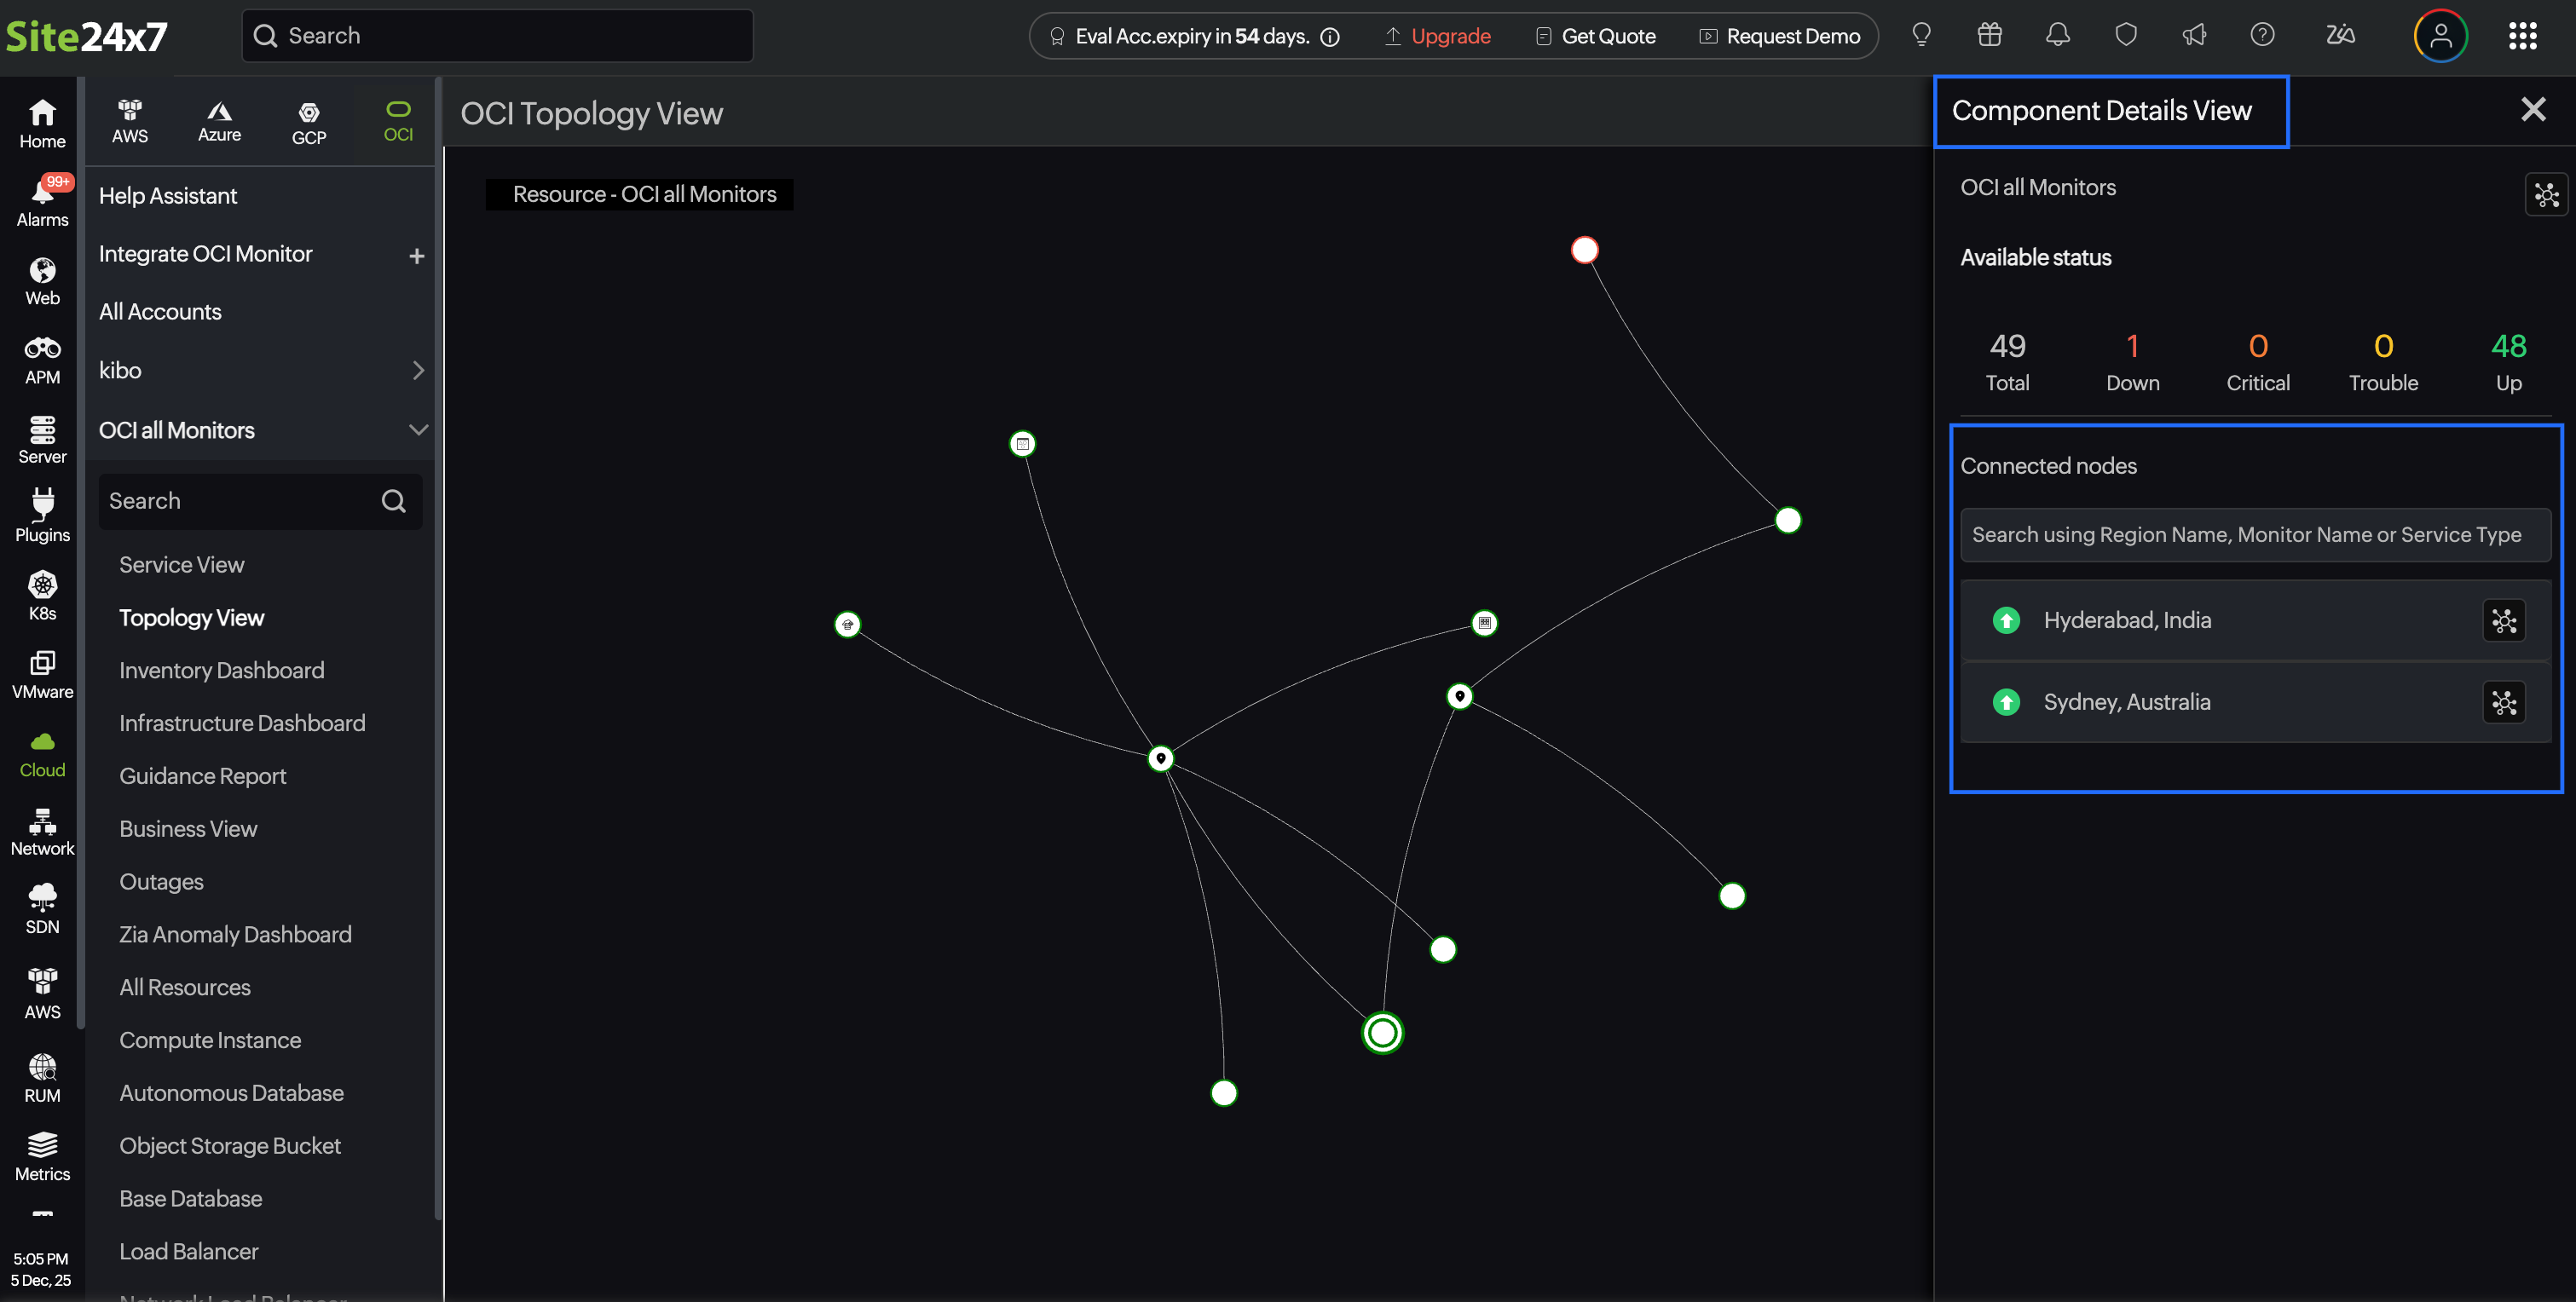
The Component Details View panel displays:
- Region or Service name: Click the View Connections icon against the region or service name to focus on the region or service. To view the monitor summary for a service type, click the new tab icon next to the service type.
- Availability Status: View details such as Total monitored resources, current Down, Critical, Trouble, and Up statuses.
- Search bar: The search bar within the panel enables you to locate a specific region, monitor, or service type for faster navigation.
- Region-wise or service-wise breakdown: A list of OCI regions or services is displayed, each with an associated health icon. This helps quickly pinpoint problematic regions or service areas.
- Monitor list view: To view the monitor list page, click the new tab icon next to the service type name in the Component Detail View panel.
Interacting with the Topology View
When you access the Topology View, the OCI compartment is automatically highlighted with double circles, and the view is zoomed in to bring it into focus. This serves as the central point from which all regions and services are mapped.
You can zoom in to focus on a region and click on the desired region (like Sydney or Mumbai) in the topology graph to explore it further. Simultaneously, the Component Details View panel on the right side of the screen will display detailed information about the selected region, such as the total number of resources, their health status, and any existing issues.
To focus on a particular region and understand its resource relationships, you can click the View Connections icon next to that region in the Component Details View panel. This action filters the topology to display only the selected region and its connected resources, helping you gain a clearer view of the dependencies and interactions within that specific region. This focused view is especially useful for troubleshooting region-specific issues or analyzing service impact in isolation.
You can also click on a specific service type (like Compute Instance or Autonomous Database) in the Component Details View > Connected Nodes section, within a region to view its individual status. The corresponding details will be displayed in the same Component Details View panel.
Additionally, you can use the search bar within the Component Details View to quickly find and highlight a specific region or service type. Upon selecting a search result, the topology view will automatically navigate to and focus on the selected item, allowing for quick and seamless navigation.
When you drill down to a specific service type within the Topology View (for example,Compute Instance or Autonomous Database), Site24x7 displays all the monitors associated with that service.This view shows how the monitors of the selected service are connected to other OCI resources and how it fits within the overall structure of your OCI compartment.
To focus on a particular monitor and understand its resource relationships, you can click the View Connections icon next to that monitor name in the Component Details View panel. From this perspective, you gain a comprehensive understanding of how a specific monitor is linked or integrated within the OCI infrastructure. For instance, the connections can be traced step-by-step: starting from a Compute Instance, which is associated with one or more Network Security Groups (NSGs) or Security Lists, and placed inside a Subnet. This Subnet belongs to a Virtual Cloud Network (VCN), which spans one or more Availability Domains (ADs) and is deployed within a specific OCI Region. Ultimately, the entire structure operates under an OCI compartment, which acts as the top-level container for all resources. This hierarchy helps visualize how OCI components are organized and how they depend on each other.
This detailed drill-down menu helps you visualize dependencies and understand the relationships between each monitor. If there's a status change or issue with a particular monitor, you can easily identify which related resources might be affected. This enables faster troubleshooting and better impact analysis in the event of an outage or performance issue.
Related topics