Performance Metrics for Hyper-V
Gather metrics on hypervisor, VMs, processor, network, storage, and more for both your host server and VMs. Monitor and manage your Hyper-V environment and resolve virtualization bottlenecks in minutes. The Hyper-V monitor uses the Site24x7 Windows agent for monitoring. Install the Windows agent and get your Hyper-V servers auto-discovered.
Once the Hyper-V server monitor is successfully added to your Site24x7 account,
- View performance metrics for Hyper-V monitors. Log in to Site24x7 and go to Server > Microsoft Hyper-V Server.
- Add a Threshold and Availability profile to declare a specific resource as critical or down. Go to Admin > Configuration Profiles > Threshold and Availability (+).
- Analyze trends and identify performance issues with exclusive performance reports.
- View key metrics in a single glance with the server inventory and health dashboards, or create your own.
- Automate the start, stop, and restart of Hyper-V VMs. Learn more.
Interpret Microsoft Hyper-V Performance Metrics
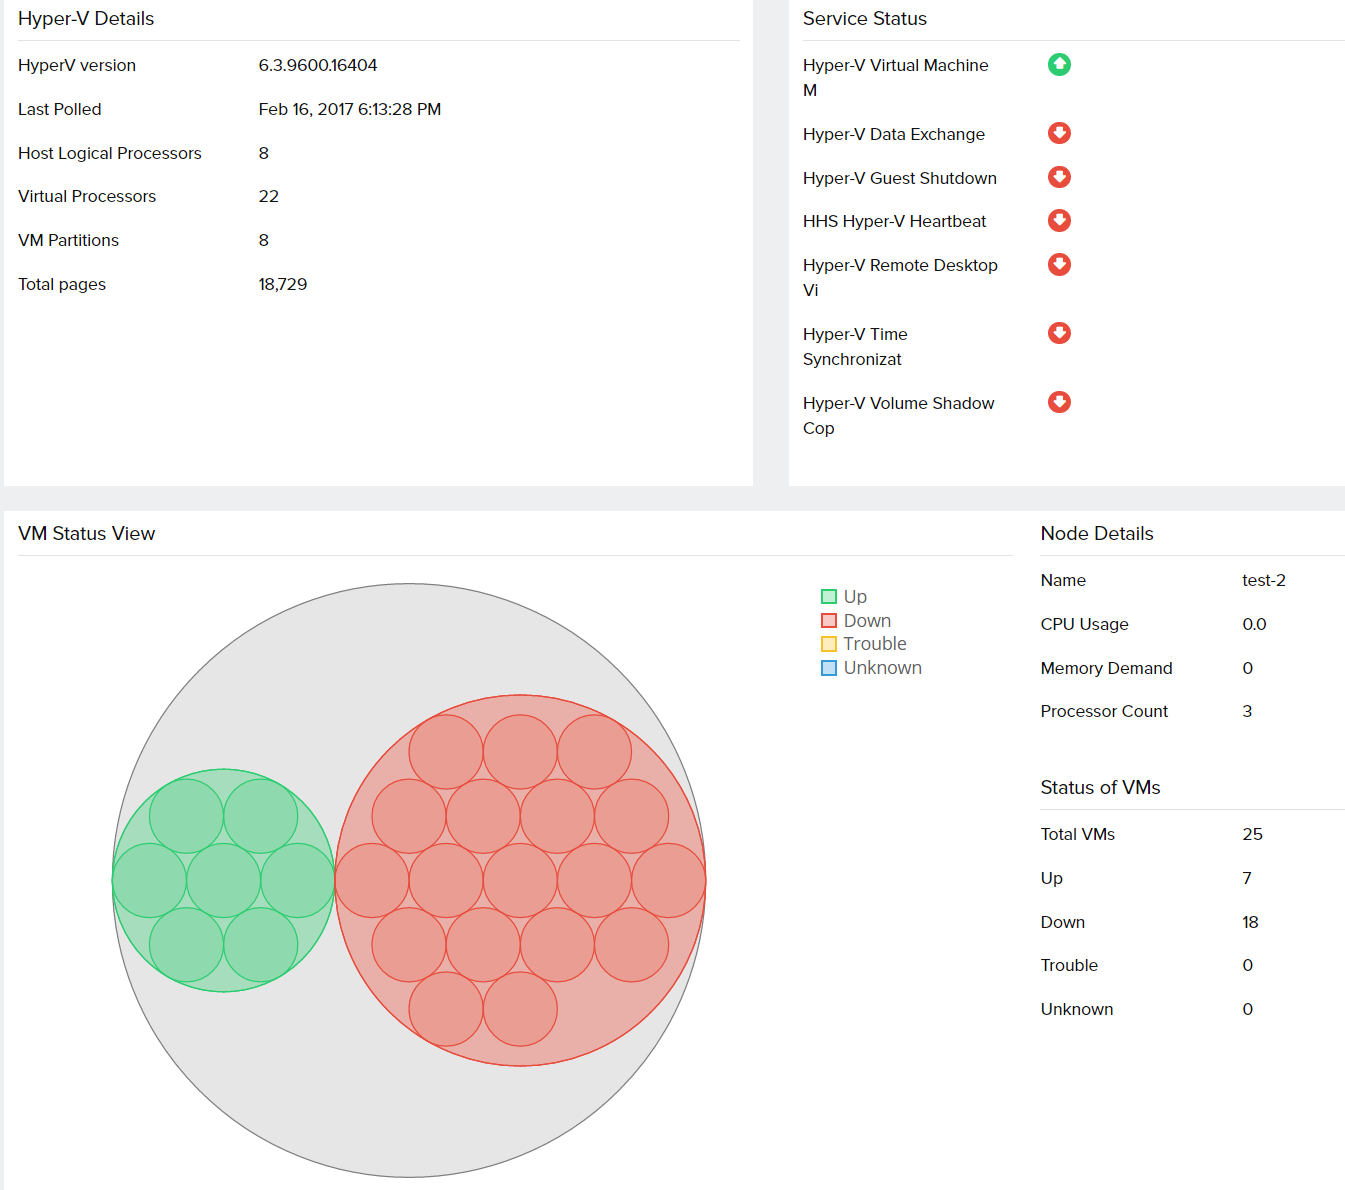
- Overview: Basic details on the Hyper-V environment including its version, status of the VMs, Hyper-V related Windows services, the last polled time, CPU, and memory usage.
- VM Details: Get information on each individual VM, its replication, and parent checkpoint details.
- Processor: Know the amount of cores that the virtual machine can see and use.
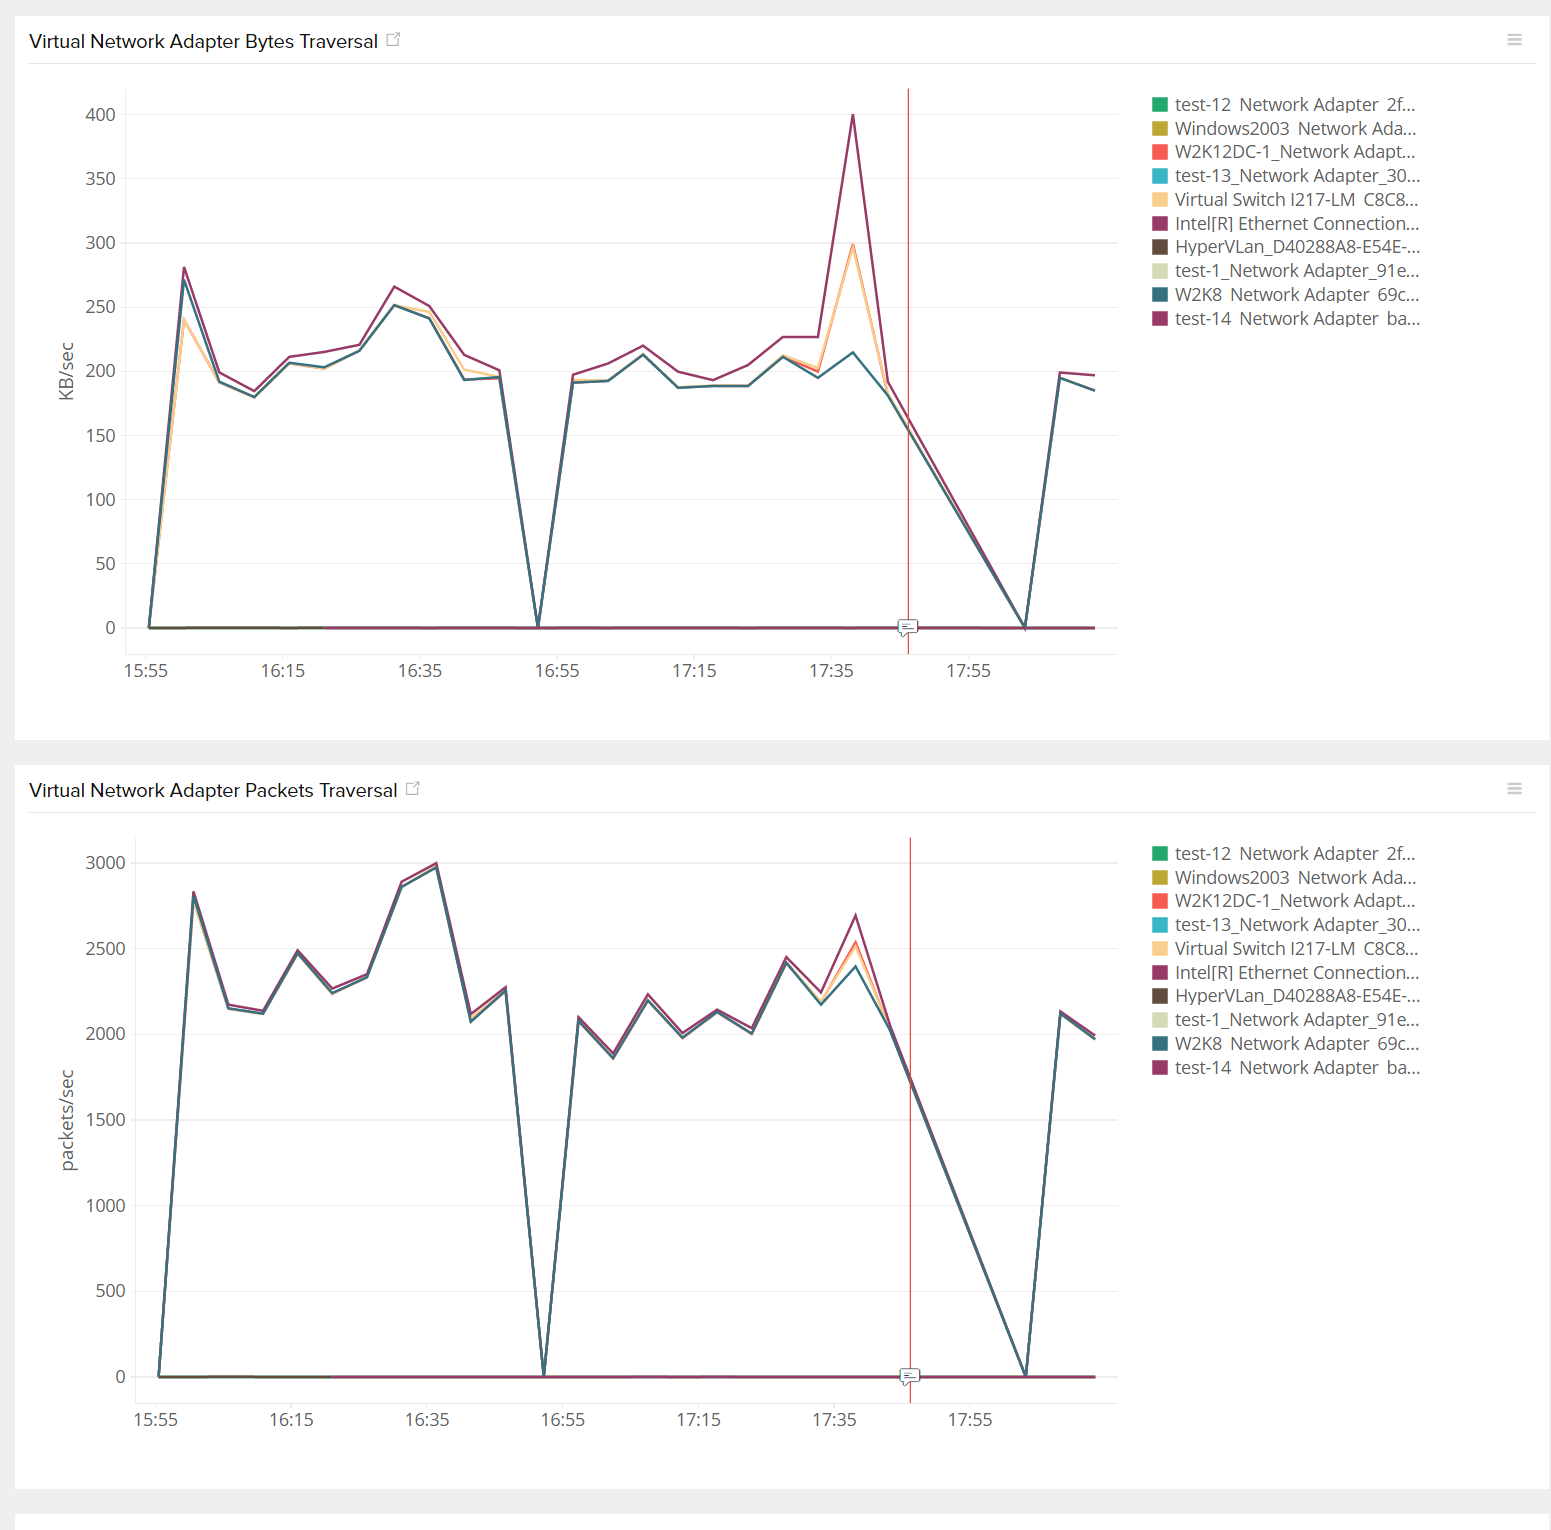
- Network: Know more on the virtual switches and virtual network adapters.
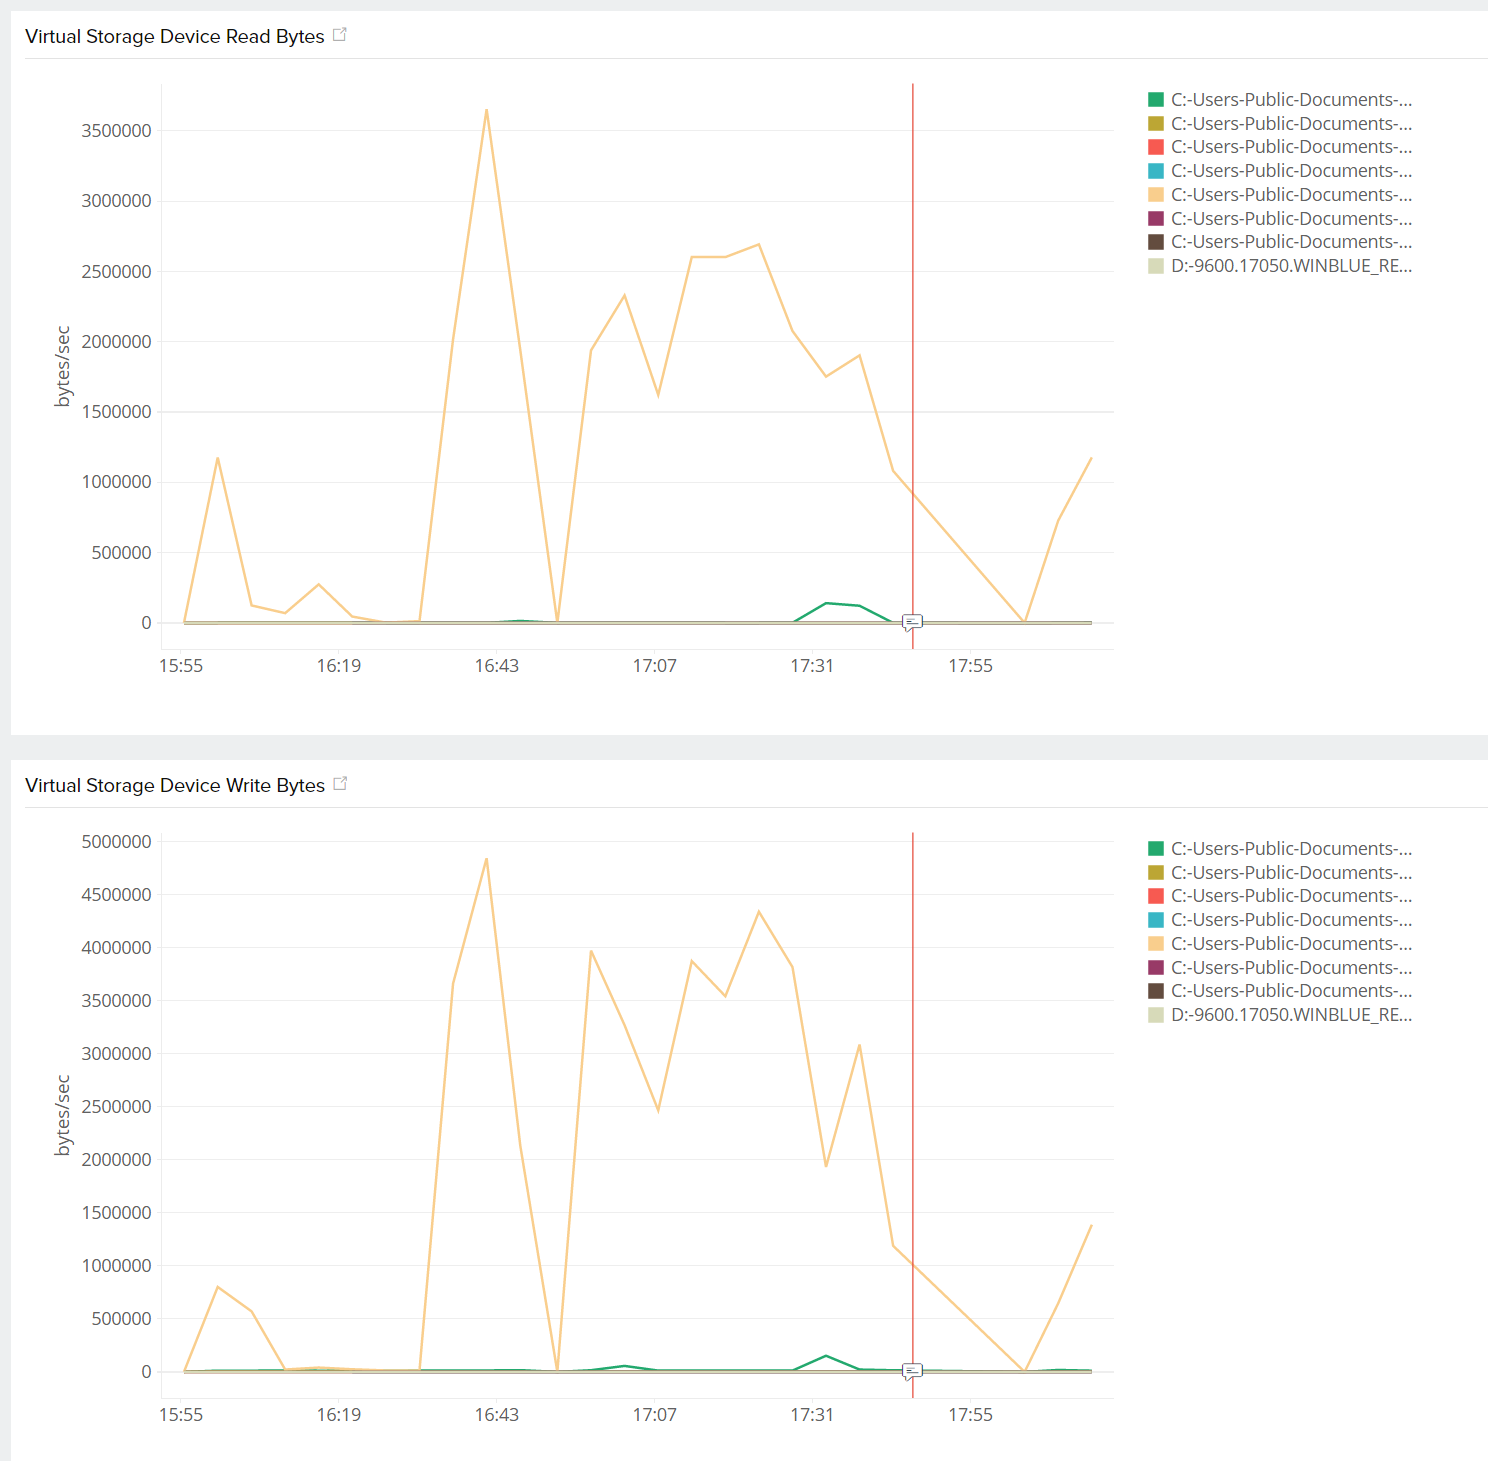
- Storage: Gain inputs on the storage device including its read, write, flush, error counts, and more.
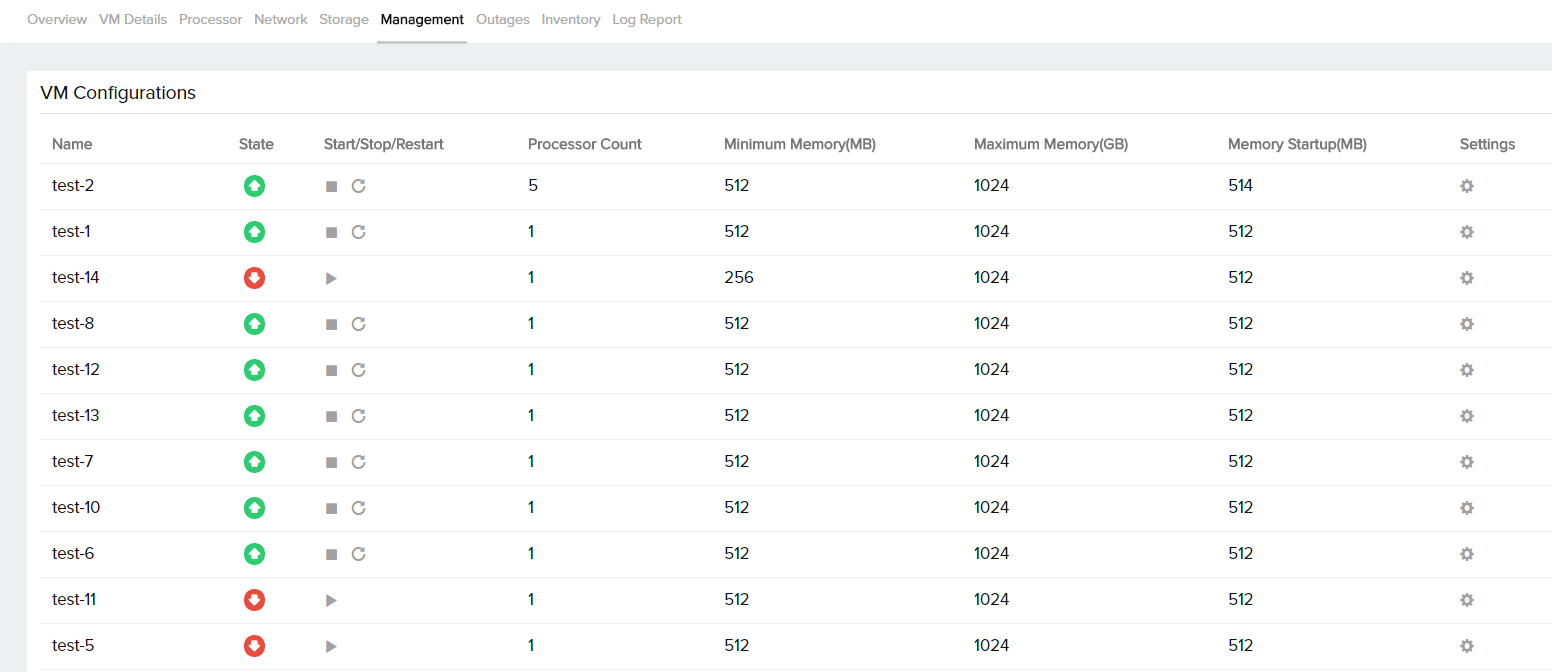
- Management: Manage your VMs by controlling their basic actions (start/stop/restart), set the processor count, and change memory configuration of each VM.
Overview
| Parameters | Description |
| Hyper-V Details | The basic details of the Hyper-V environment are listed here. This includes the Hyper-V version, the last polled time, total pages, virtual processors, VM partitions, and host logical processors |
| Service Status | Status of the Windows services specific to the Hyper-V environment |
| VM Status View | A representation of all the VMs in the Hyper-V environment. Gives the status of the VM whether up, down, trouble or unknown. Also, the CPU, memory usage and the processor count for each VM is listed under Node Details |
| Top VM CPU Usage | A bar chart listing from the highest to the lowest VM in the Hyper-V environment, based on CPU usage |
| Top VM Memory Demand | A bar chart listing from the highest to the lowest VM in the Hyper-V environment, based on memory usage |
| Memory Details: | |
| Root Partition Total 1G GPA Pages | The number of 1G pages present in the GPA space of the partition |
| Root Partition Total 2M GPA Pages | The number of 2M pages present in the GPA space of the partition |
| Root Partition Total Deposited Pages | The number of pages deposited into the partition |
| VM Vid Partition Total Physical Pages Allocated | The number of physical pages allocated |
| VM Vid Partition Total Remote Physical Pages | The number of physical pages not allocated from the preferred NUMA node |
VM Details
(For versions 2012 and above)
| Parameters | Description |
| State | Gives the status of the VM whether UP, DOWN, TROUBLE, or UNKNOWN |
| CPU Usage | The maximum number of threads that it is allowed to operate on physical cores at any given time |
| Replication Mode | Primary, Replica, TestReplica, and None are the different replication modes |
*For Windows versions 2008 and 2008 R2, only the state, health, and CPU usage of the VM will be tabulated.
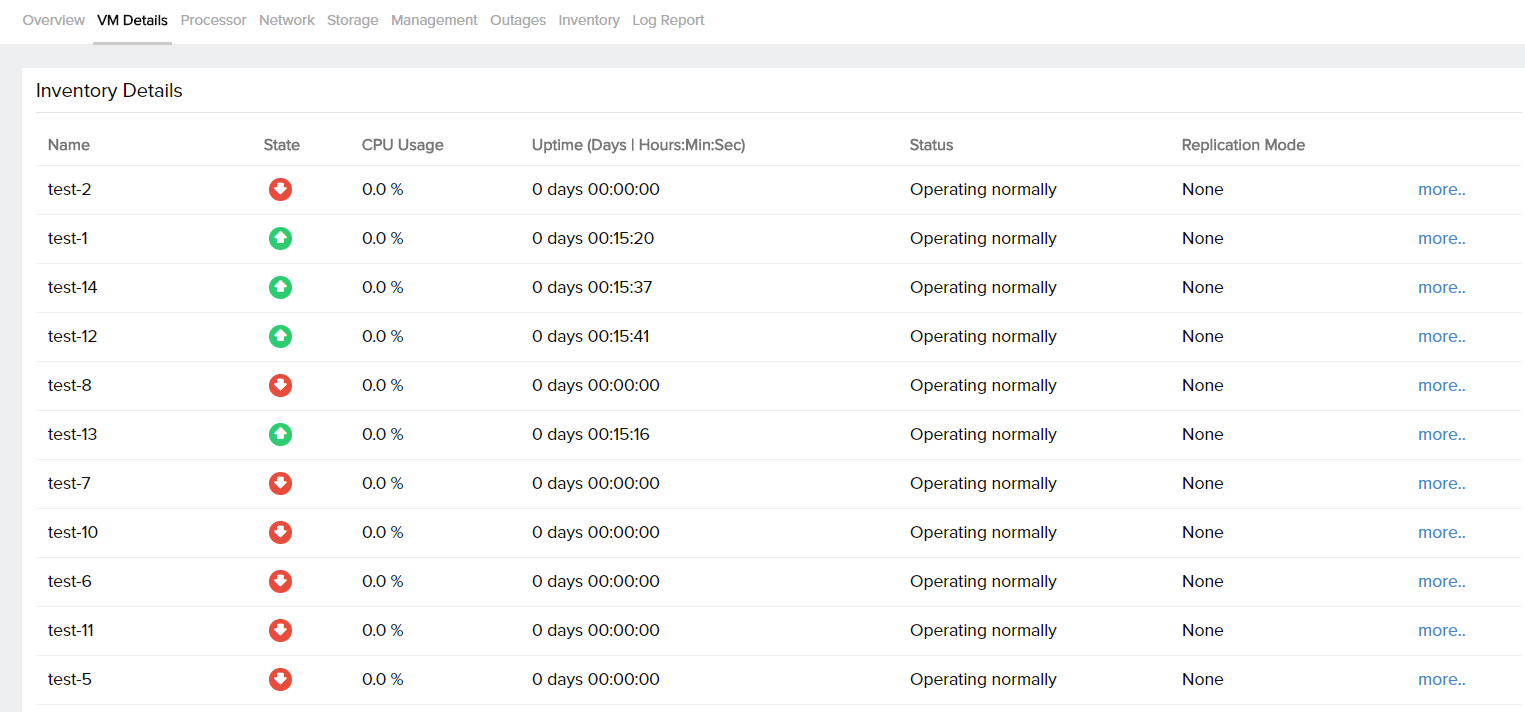
Get details of each individual VM, its replication, and parent checkpoint details by clicking More.
| Parameters | Description |
| Memory Demand/Memory Assigned | Dynamic Memory adjusts the amount of memory available to a VM, based on changes in memory demand and values that you specify. Memory Demand/Assigned represent the current amount of memory in demand and the memory assigned currently for a particular VM respectively |
| Replication Details | Replication is the process of replicating a VM in a primary site to a replica VM in a secondary site. This gives the mode, state (Error, FailOverWaitingCompletion, FailedOver, NotApplicable, ReadyForInitialReplication, Replicating, Resynchronizing, ResynchronizeSuspended, Suspended, SyncedReplicationComplete, WaitingForInitialReplication, Disabled) and health (Normal, Warning, Critical, Not Applicable) of the VM. Also, specifies if the VM is in a clustered state or not |
| Parent Checkpoint Details | Checkpoints provide a faster and easier way to revert the VM to a previous state. The ID, name and type of the parent checkpoint will be shown |
Processor
| Parameters | Description |
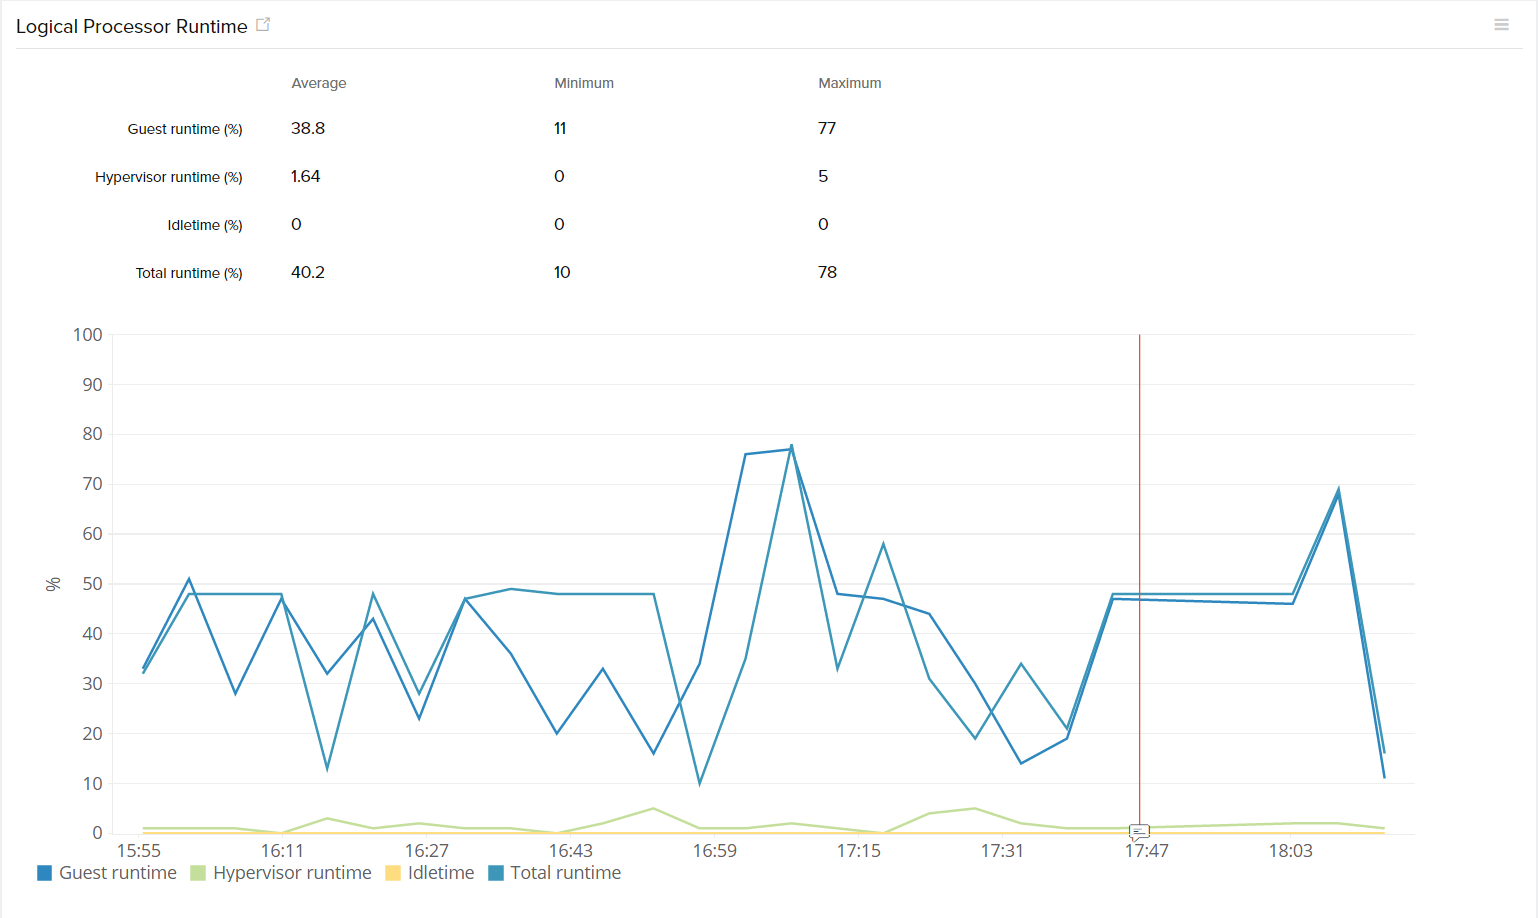
| Logical Processor Runtime | Graphical view of Guest, Hypervisor, Idletime and Total runtime of the logical processor. It represents the percentage of time spent by the processor in guest code, hypervisor code, idle state and the total (guest and hypervisor code) |
| Root Virtual Processor Runtime | Graphical view of Guest, Hypervisor and Total runtime of the root virtual processor. It represents the percentage of time spent by the virtual processor in guest code, hypervisor code and the total (guest and hypervisor code) |
| Root Virtual Processor Intercepts | The rate of hypervisor intercepts messages |
| Root Virtual Processor Hypercalls | The rate of hypercalls made by guest code on the virtual processor |
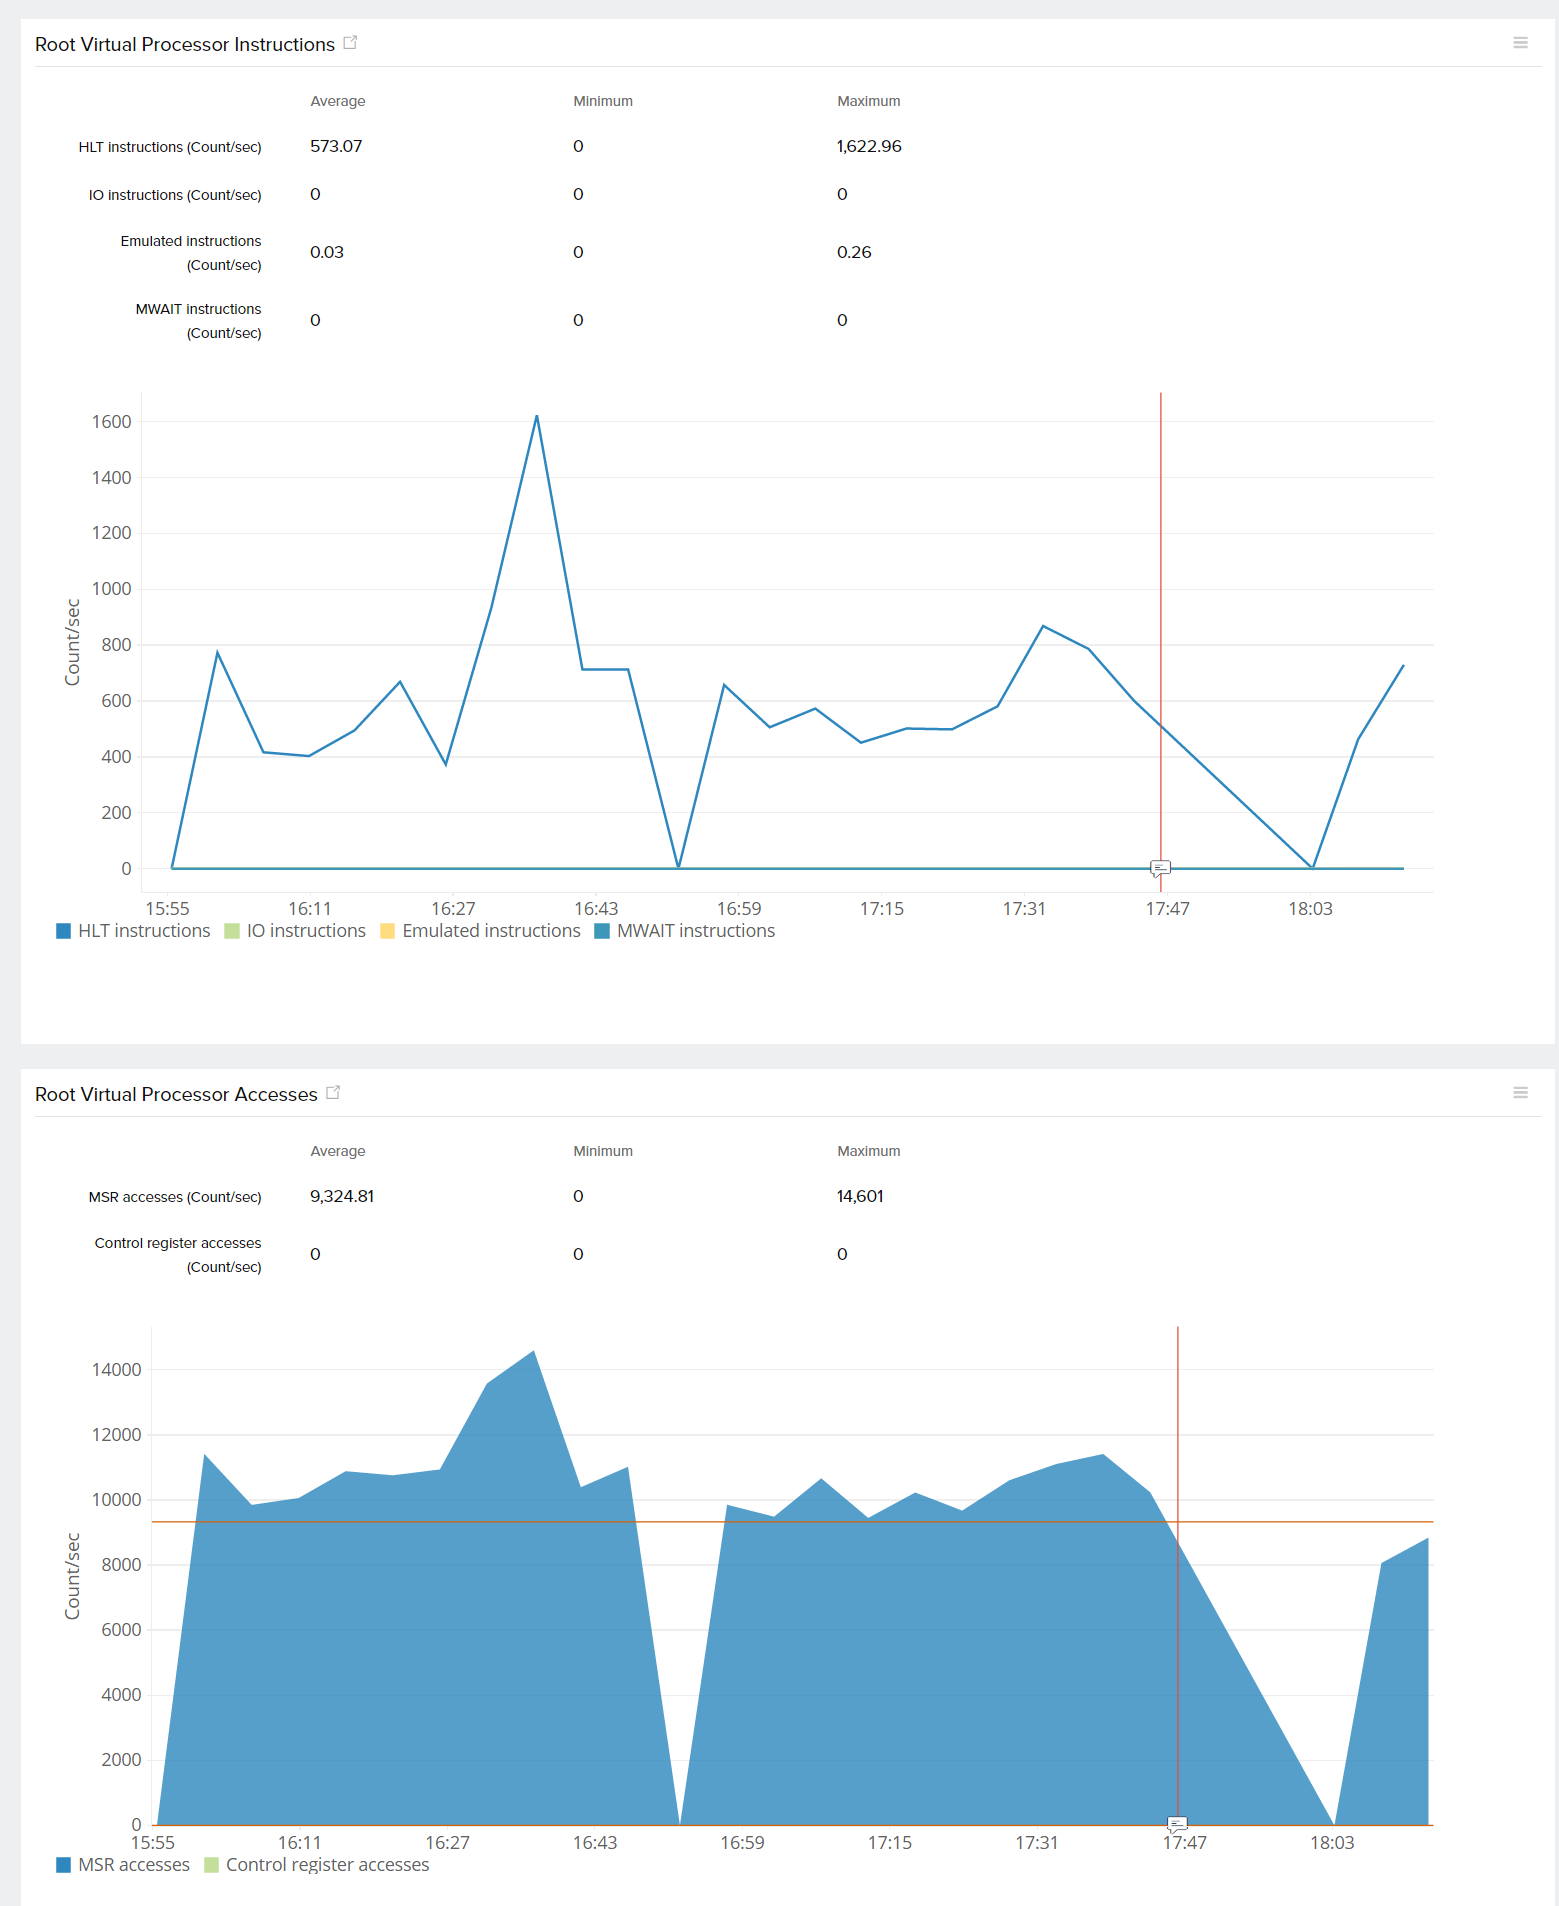
| Root Virtual Processor Instructions | This gives the graphical view of HLT, IO, Emulated, and MWAIT instructions per second. They represent the rate of HLT/IO/emulated/MWAIT instructions per second executed by guest code on the virtual processor |
| Root Virtual Processor Accesses | This is the graphical representation of MSR and Control Register accesses. The rate of MSR/control register accesses executed by guest code on the virtual processor |
Network
| Parameters | Description |
| Virtual Switch Details: | |
| Virtual Switch Bytes Traversal | The total number of bytes per second traversing the virtual switch |
| Virtual Switch Packets Traversal | The total number of packets per second traversing the virtual switch |
| Virtual Network Adapter Details: | |
| Virtual Network Adapter Bytes Traversal | The total number of bytes that have traversed the network adapter |
| Virtual Network Adapter Packets Traversal | The total number of packets received per second by the network adapter |
| Legacy Network Adapter Bytes Sent | The number of bytes sent per second over the network adapter |
| Legacy Network Adapter Bytes Received | The number of bytes received per second on the network adapter |
| Legacy Network Adapter Bytes Dropped | The number of bytes dropped on the network adapter |
Storage
| Parameters | Description |
| Name | Name of the storage device |
| Read Count | The total number of read operations that have occured on this virtual device |
| Write Count | The total number of write operations that have occured on this virtual device |
| Error Count | The total number of errors that have occured on this virtual device |
| Flush Count | The total number of flush operations that have occured on this virtual device |
| Virtual IDE Controller Read/Write Bytes | The number of bytes read/written per second from/to the disks attached to the IDE controller |
| Virtual IDE Controller Read/Write Sectors | The number of sectors read/written per second from/to the disks attached to the IDE controller |
Management
| VM Configuration: | |
| Parameters | Description |
| Name | Name of the virtual machine |
| State | This tells us if the VM is in the Unknown, Running, Turned Off, Paused, Suspended, Starting, Snapshotting, Saving, Stopping, Pausing, or Resuming state |
| Start/Stop/Restart | This enables the user to start, stop or restart the VM. Only an admin or a super admin can perform this action |
| Processor Count | The total number of processors allocated to that particular VM |
| Minimum Memory | The minimum amount of memory that should be allocated to the VM after it has booted. The value can be set as low as 32 MB to a maximum value equal to the Memory Startup value |
| Maximum Memory | The maximum physical memory that this VM is allowed to use |
| Memory Startup | This value reflects the amount of physical memory the VM will initially use when it’s started. The startup RAM represents the minimum amount of physical memory the VM will ever consume. A VM cannot decrease its memory usage below the startup RAM value |
| Settings | This is the place where the minimum, maximum, startup memory and the processor count can be set for that particular VM |
Every time a change is made to the memory configuration or processor count, the VM will be restarted.
Performance Reports for Hyper-V
Log in to Site24x7 and go to Reports > Microsoft Hyper-V Server. The following reports are available for Hyper-V monitoring:
- Availability Summary Report
- Summary Report
- Busy Hours Report
- Health Trend Report
- Performance Report
- VM Details Report
- VM Replica Report
- VM Storage Device Report
- VM Network Adapter Report
In addition to these performance reports, Top N Hyper-V Servers by CPU Usage and Memory Demand reports are also available.
