Azure Log Analytics workspace log forwarding
An Azure Log Analytics workspace gives you a single place to collect, query, and act on log data from every system you execute.
The Site24x7 cloud sends each batch of logs to Azure over the logs ingestion API, authenticating through a data collection rule (DCR) and a data collection endpoint (DCE) that you configure. Everything after that runs on a schedule you define, with no manual export required.
Key capabilities
This integration provides the following capabilities:
- Sends Site24x7 logs to an Azure Log Analytics workspace for centralized storage.
- Lets you query forwarded logs using KQL for deeper analysis.
- Feeds forwarded data into Microsoft Sentinel for security monitoring, threat detection, and incident investigation.
- Supports unified monitoring across multiple systems from a single workspace.
Prerequisites
Before configuring the integration, make sure the following requirements are met:
- You have an active Azure subscription with an Azure Log Analytics workspace.
- You have either an existing Azure cloud monitor in Site24x7, or a Site24x7 credential profile and the corresponding tenant ID for authentication.
- A DCE and DCR are already configured in Azure. You'll need the DCE URI and the DCR immutable ID during configuration.
- The Microsoft Entra ID application's Monitoring Metrics Publisher role is granted on the Data Collection Rule, so Site24x7 can ingest log data.
Configuring the Azure portal
Complete the following steps in the Azure portal to set up the required infrastructure and collect the values you'll need while configuring Site24x7.
Step 1: Create a Log Analytics workspace
- In the Azure portal, search for Log Analytics workspaces and select it from the results.
- Click + Create and fill in the details to create the workspace. Review the details, then click Create.
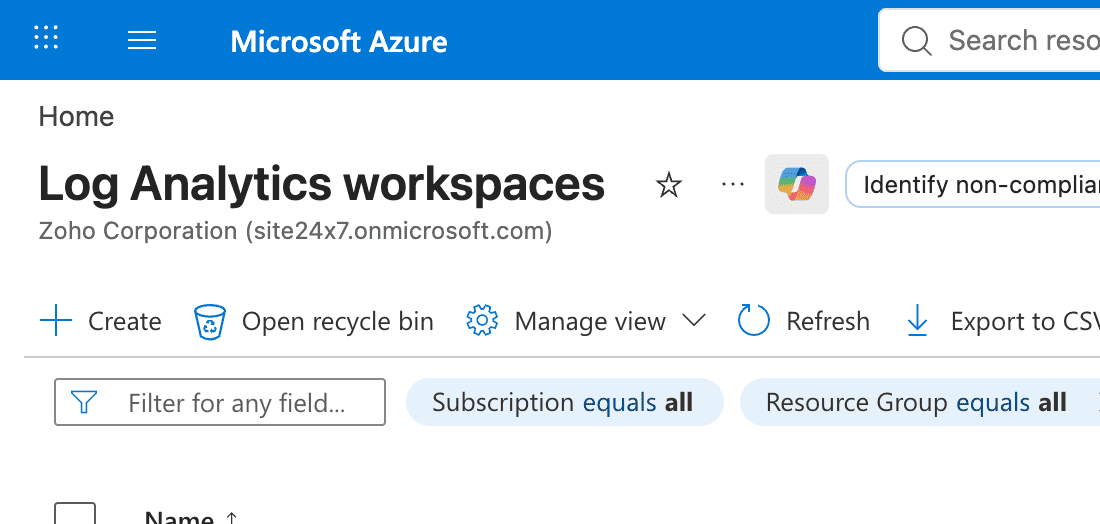
- After creation, open the workspace and navigate to Overview. Copy the Workspace ID. You'll need it when creating the Data Collection Rule in Step 5.
Step 2: Register an app in Microsoft Entra ID
- In the Azure portal, search for Microsoft Entra ID and select App registrations > + New registration.
- Enter a name for the app (for example, LogIngestionApp), leave the other fields at their defaults, and click Register.
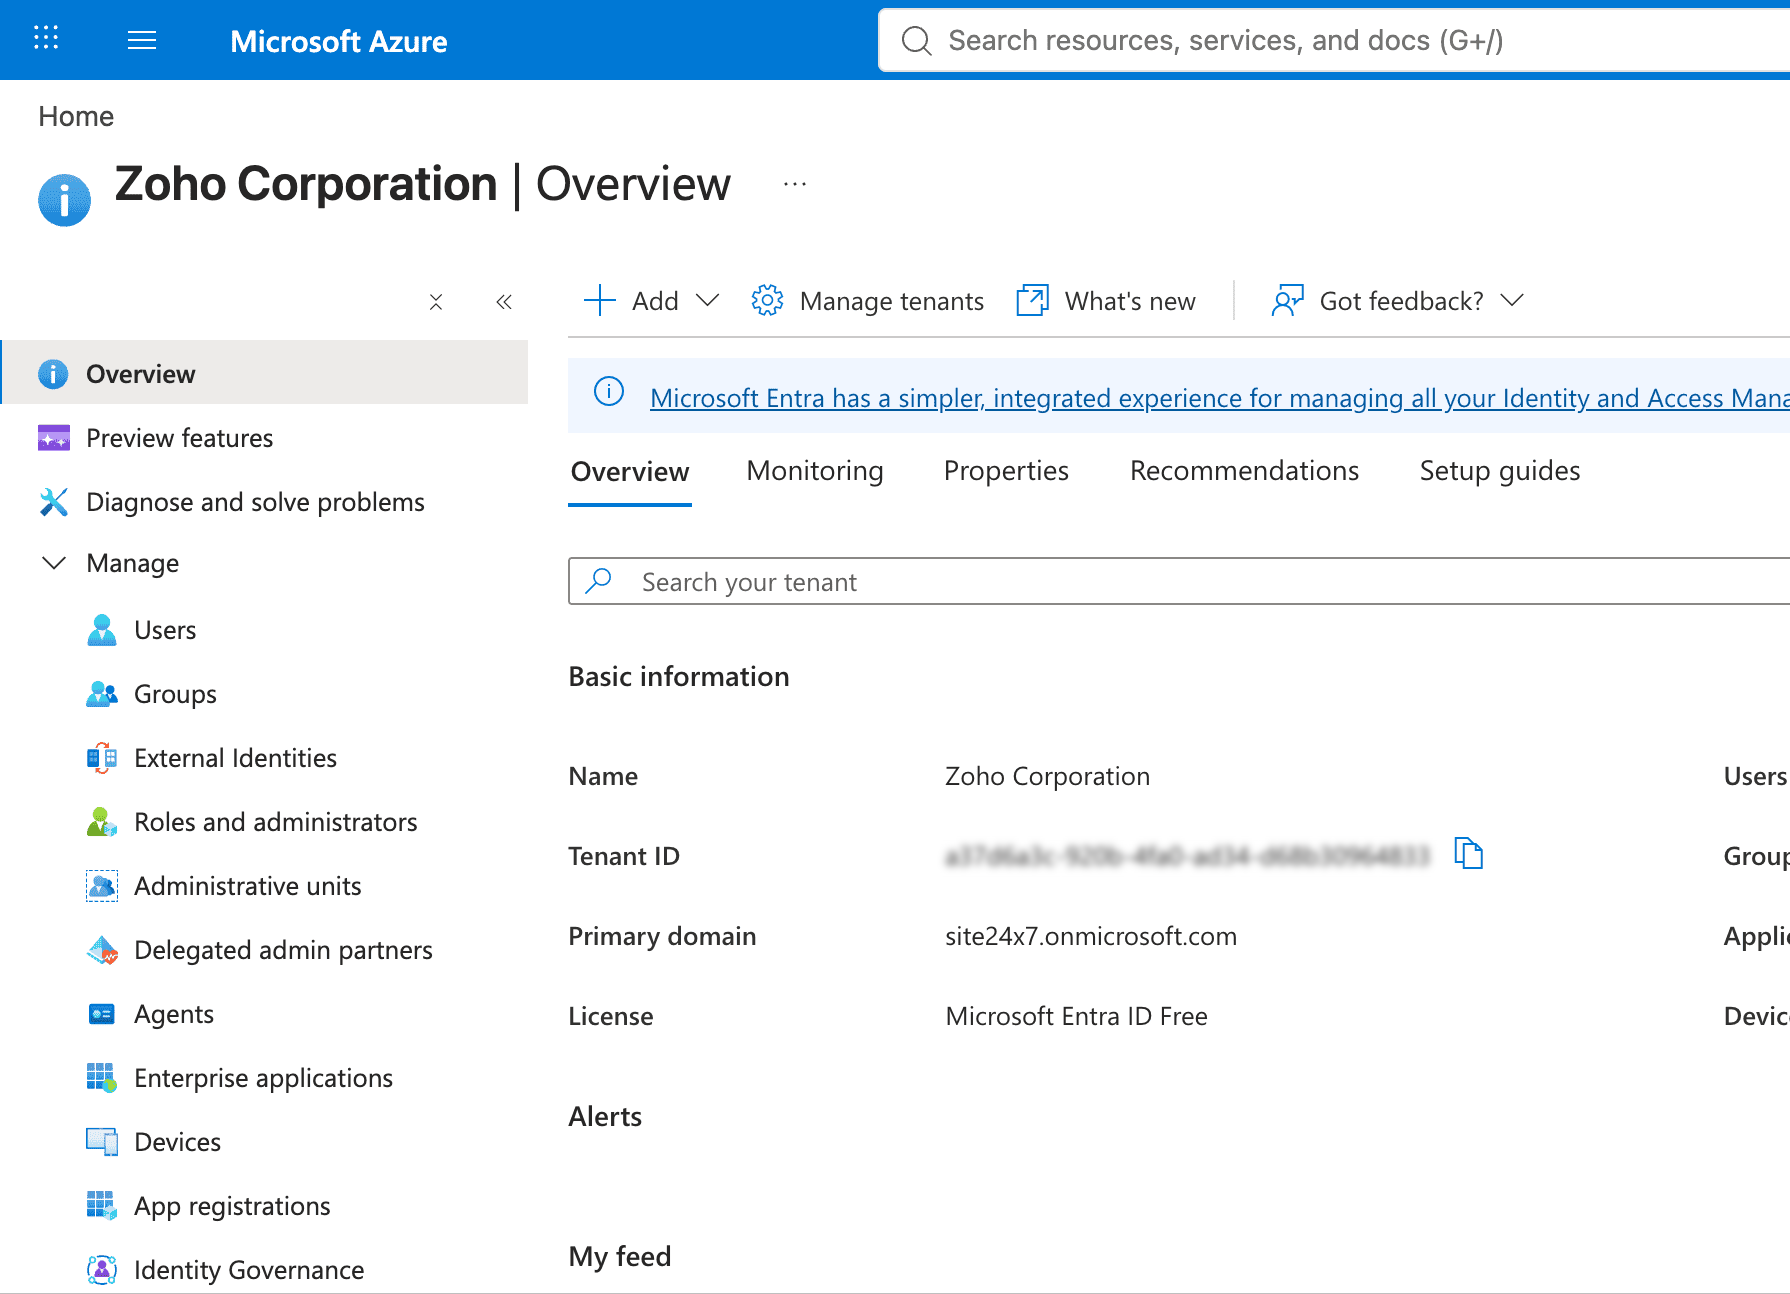
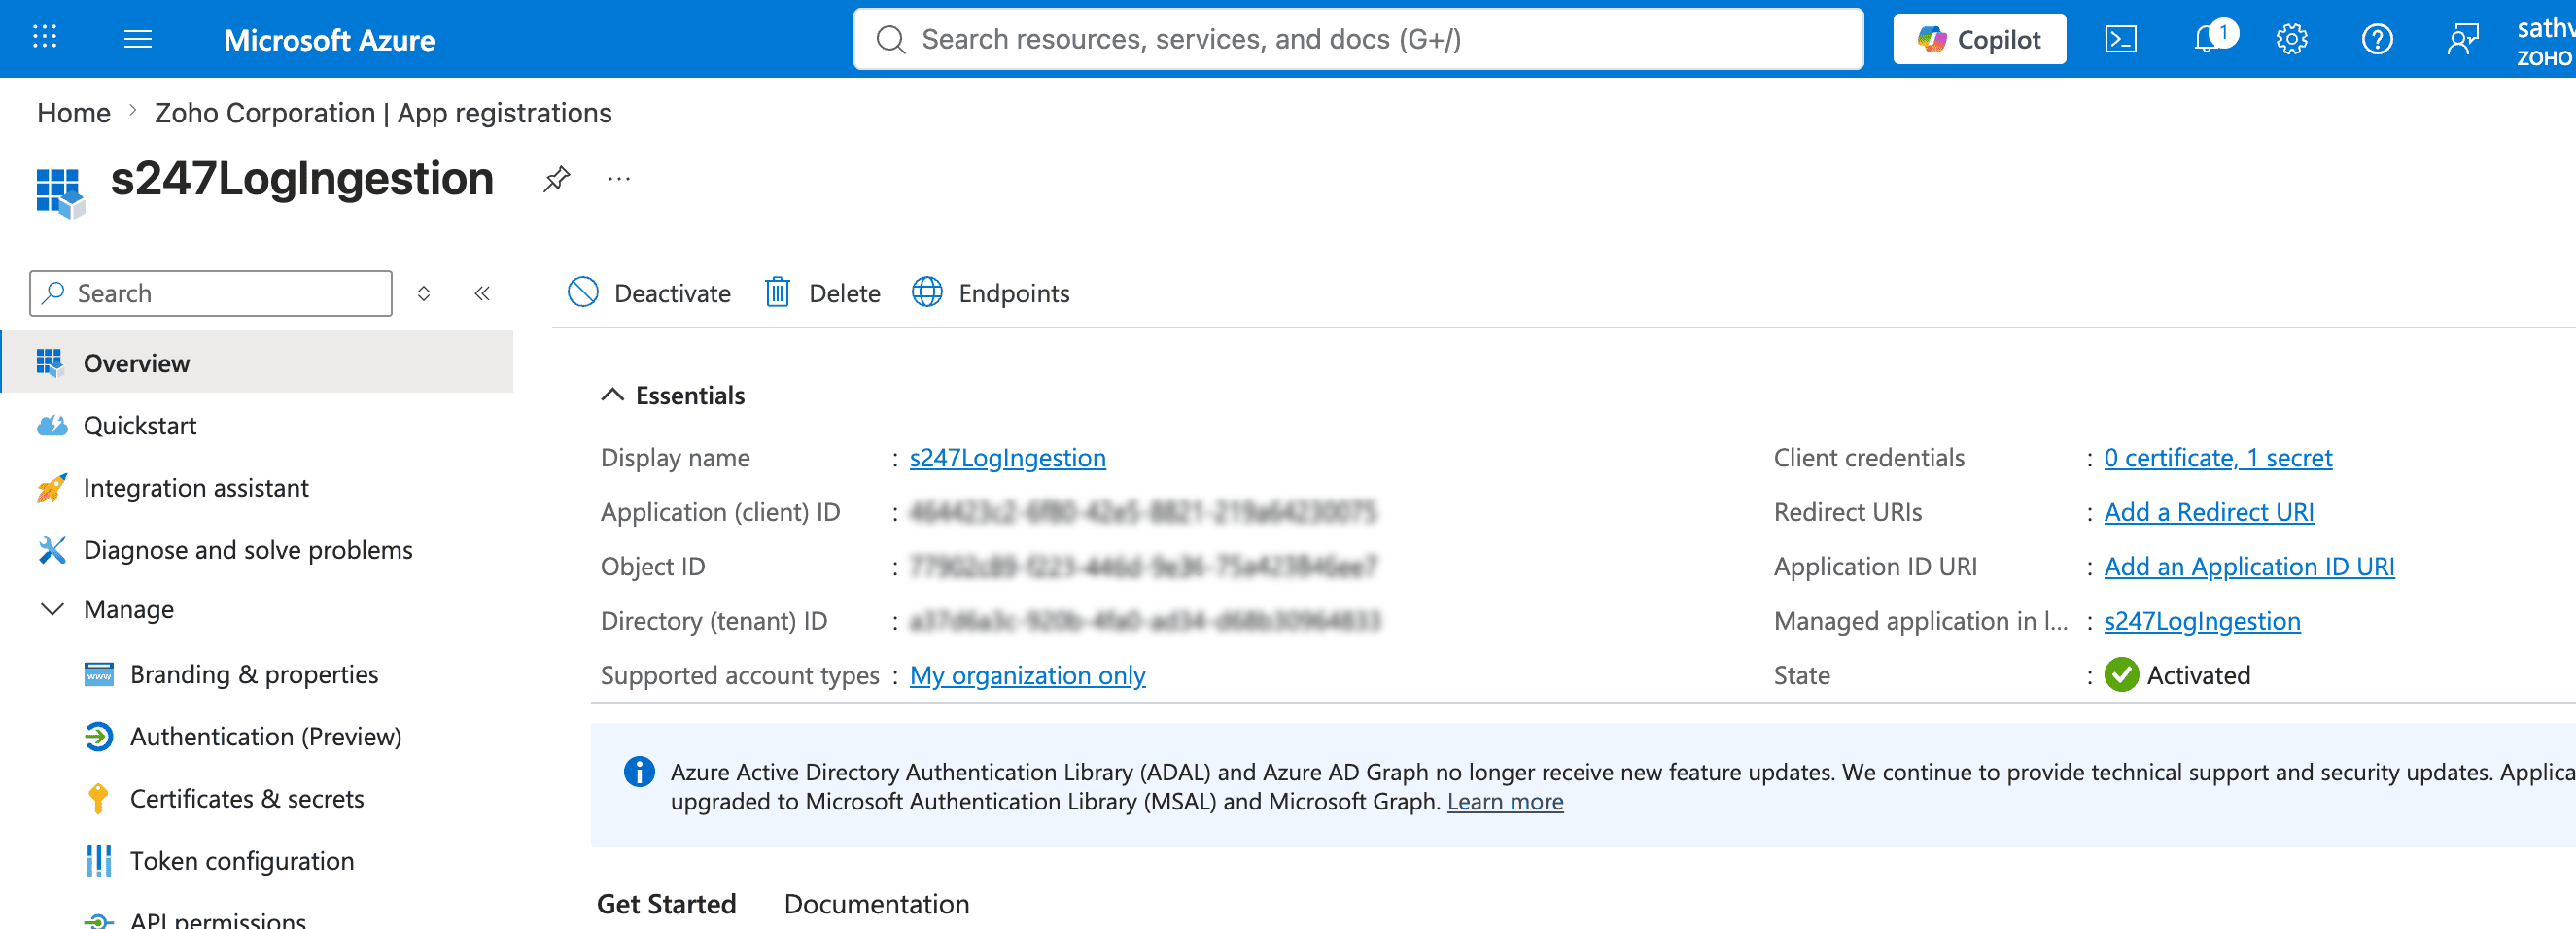
- On the app's Overview page, copy the following values:
- Application (client) ID
- Directory (tenant) ID
- In the left sidebar, navigate to Certificates & secrets > + New client secret. Enter a description and expiry period, then click Add.
- Copy the value shown in the Value column immediately, as this is your client secret. It won't be shown again once you navigate away from the page.
Keep your client secret secure. Don't share it or store it in plaintext.
Step 3: Create a Data Collection Endpoint (DCE)
The DCE is the HTTPS URL that all logs are posted to.
- In the Azure portal, search for Data Collection Endpoints and click + Create.
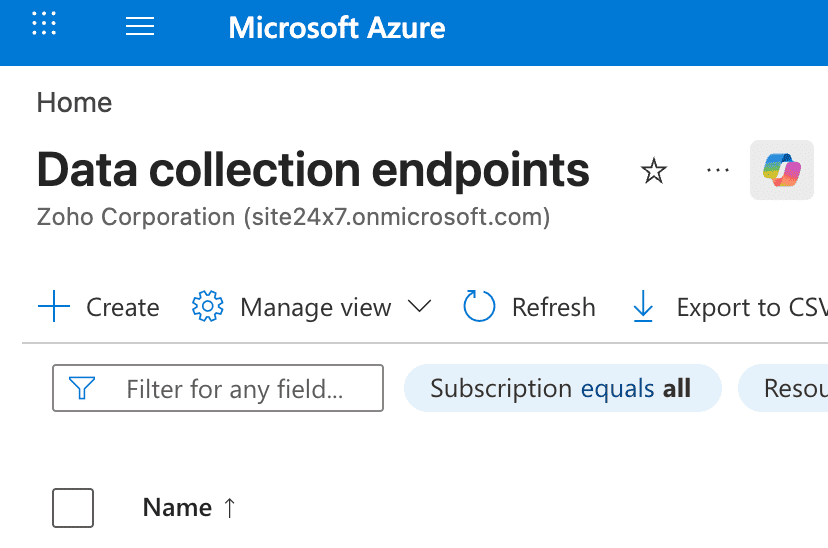
- Fill in the subscription, resource group, name, and region. The region must match the region of your Log Analytics workspace.
- Click Review + Create, confirm the details, and click Create.
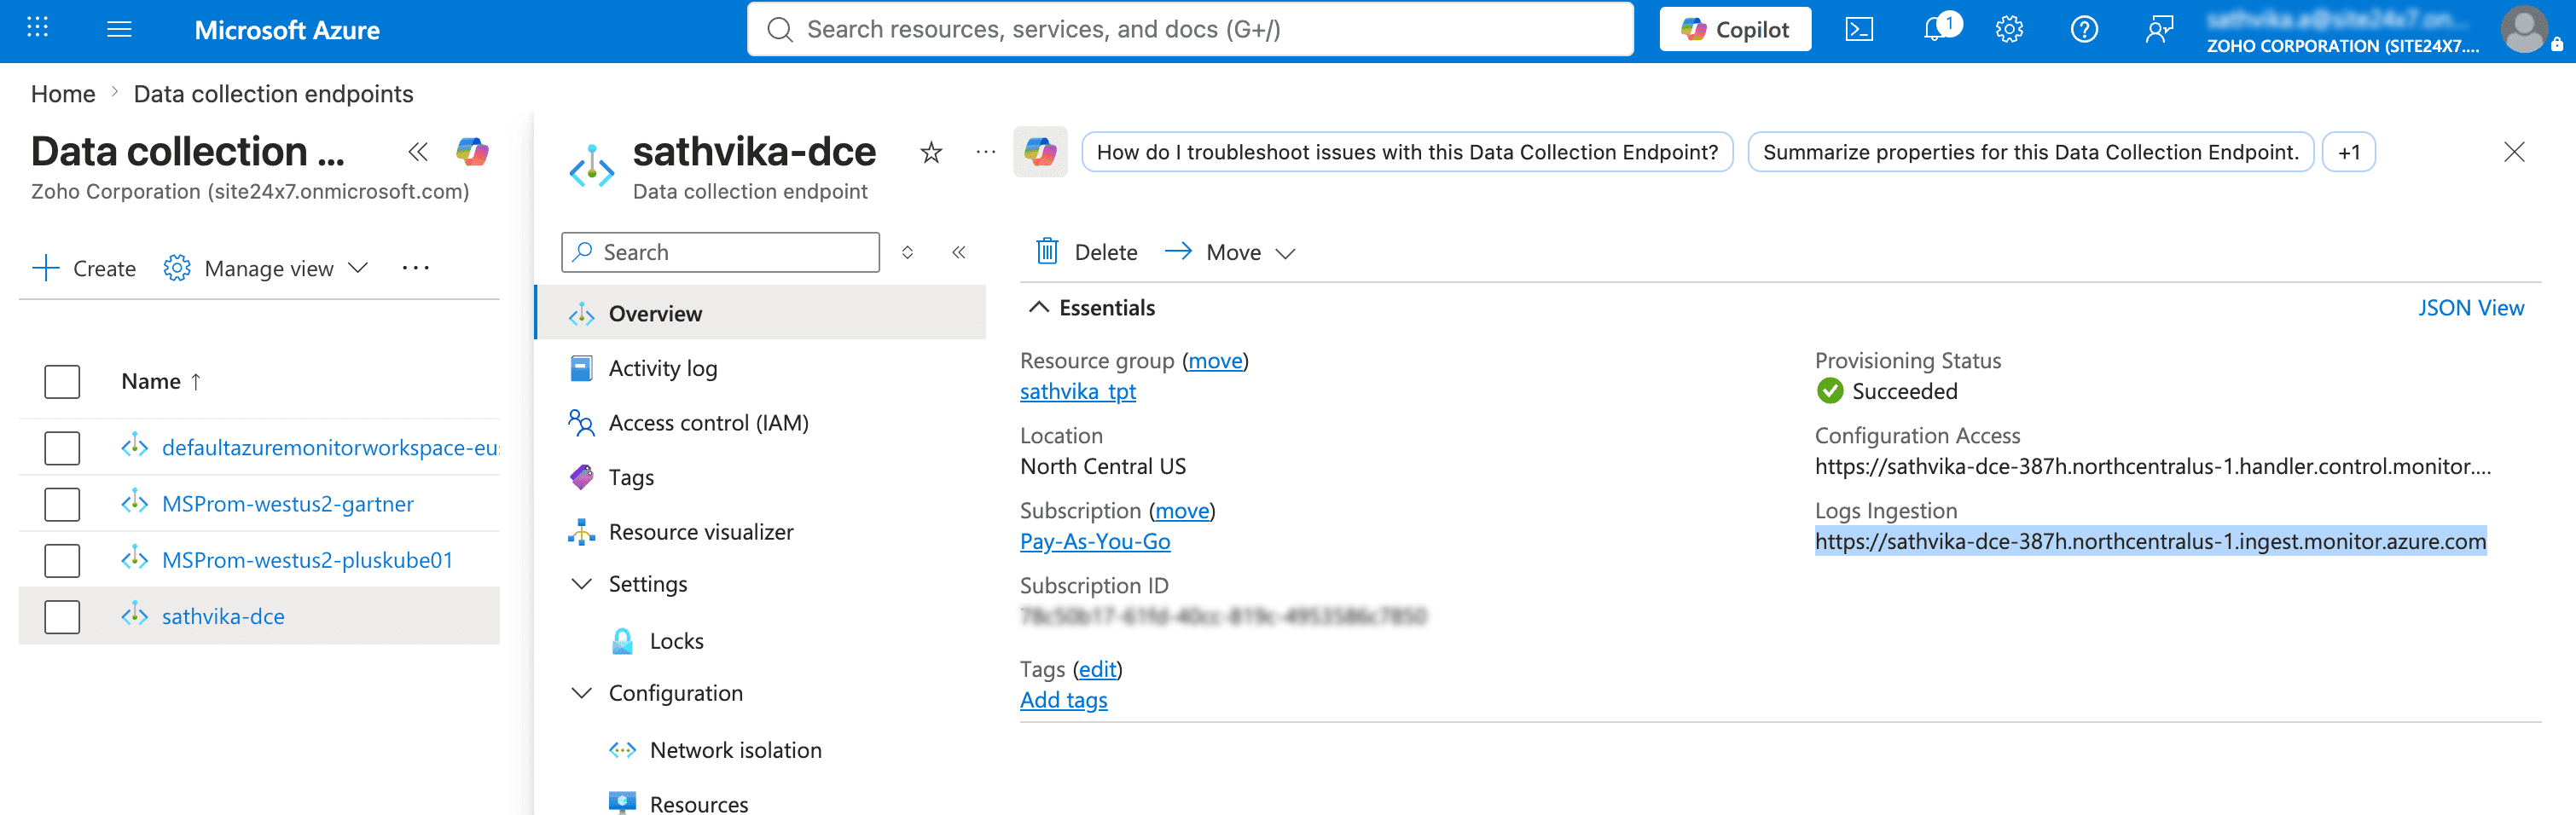
- After creation, open the DCE and go to Overview. Copy the Logs Ingestion URI—this is your Log Ingestion URL in Site24x7. It follows this format: https://
- . .ingest.monitor.azure.com
Step 4: Create custom log tables
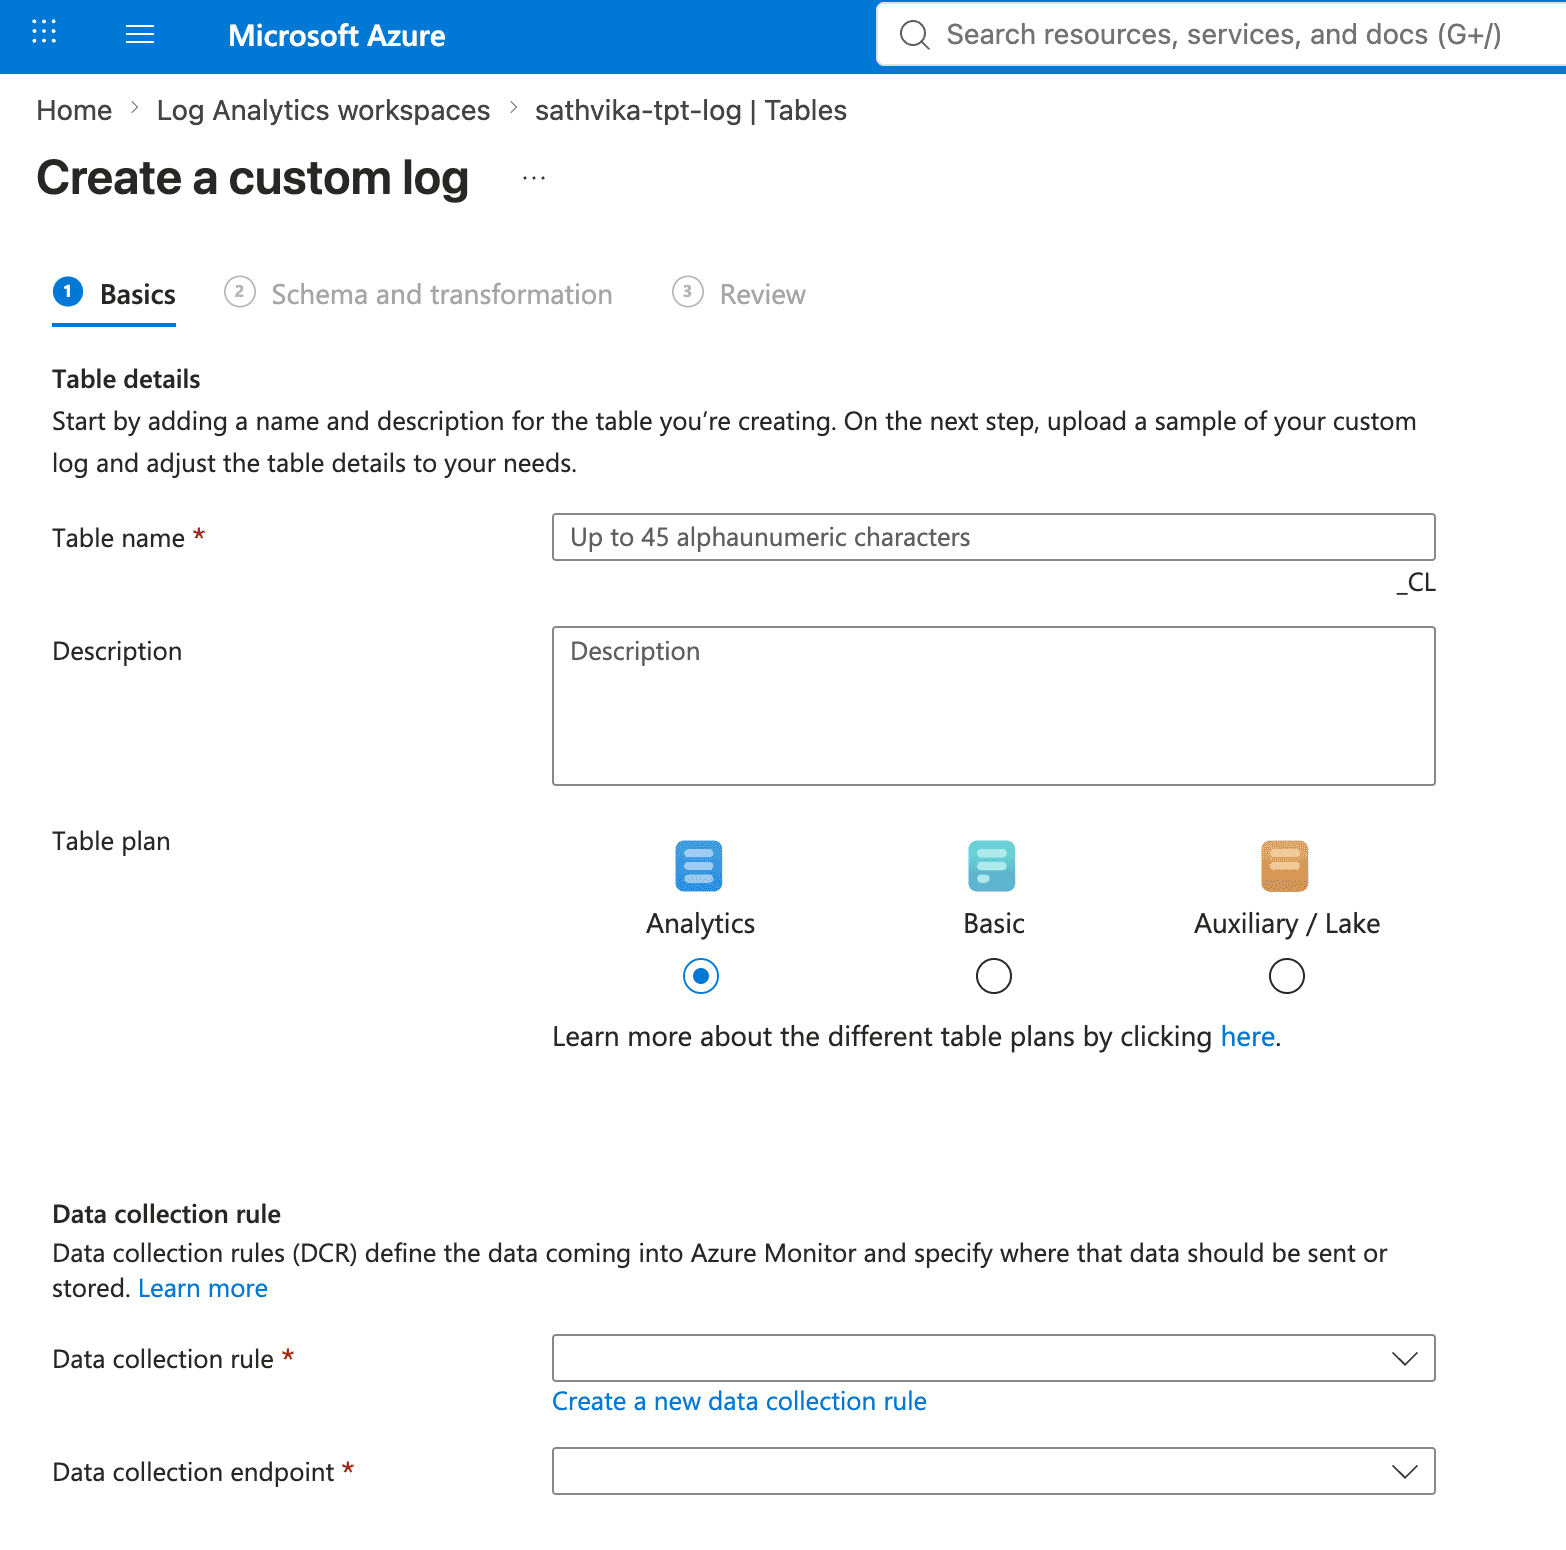
- In the Azure portal, go to your Log Analytics workspace. In the left sidebar, select Settings > Tables > + Create > New custom log (DCR-based).
- Set the table name, for example S247Log.
- Select or create a Data Collection Rule, select the DCE you created in Step 3, and define the schema columns.
- Upload a sample schema JSON file for the table. See Record format schema for the two schema options Site24x7 supports and which one to upload here.
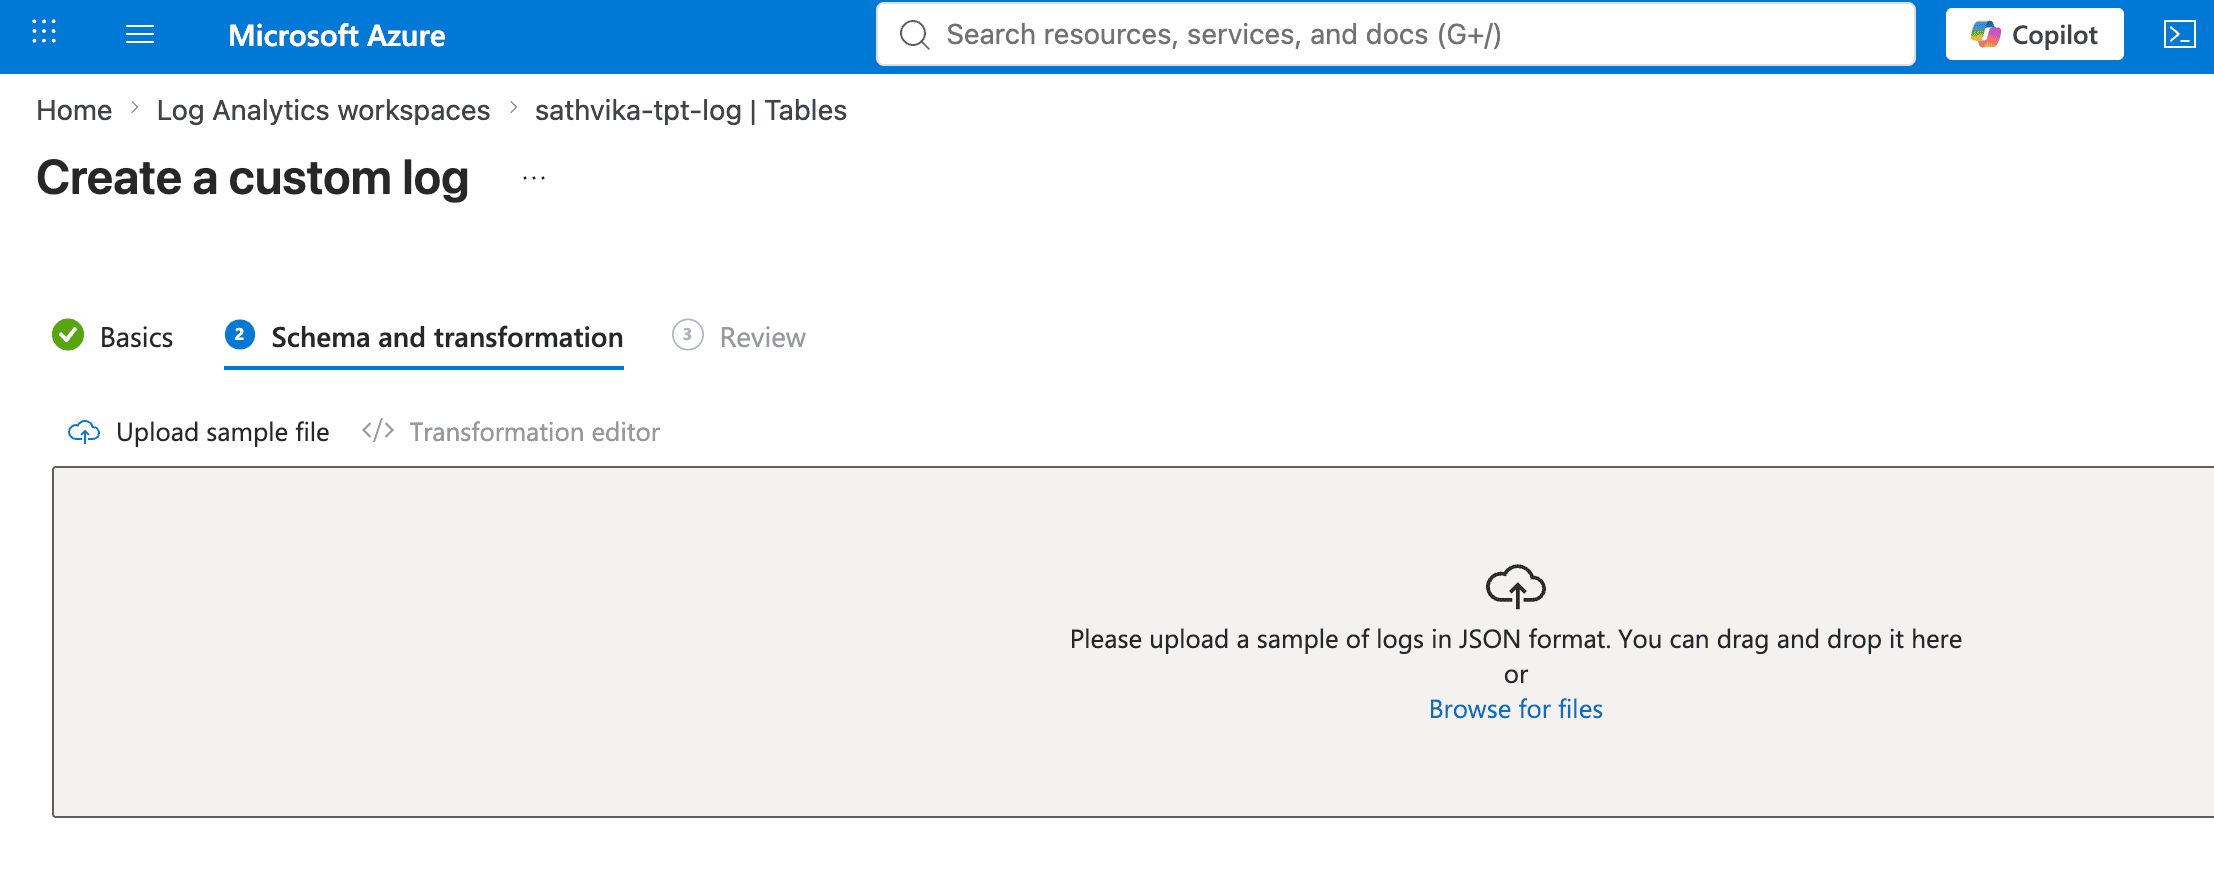
- Click Review + Create > Create.
Repeat this step for each additional custom log table you need.
The custom table must exist before the DCR can reference it as a destination.
Step 5: Get Data Collection Rule (DCR) details
- In the Azure portal, search for Data Collection Rules and click Data collection rules tab.
- Select the DCR rule created in Step 4 during custom table creation.
- Click JSON view on the top-right of the page. Locate the ImmutableId field—this is your Immutable ID. It follows this format: dcr-xxxxxxxxxxxxxxxxxxxxxxxxxxxxxxxx
Step 6: Assign the Monitoring Metrics Publisher role
This step grants the app registration you created in Step 2 permission to write logs to the DCR.
- Open your DCR in the Azure portal and go to Access control (IAM) in the left sidebar.
- Click + Add > Add role assignment.
- On the Role tab, search for and select Monitoring Metrics Publisher, then click Next.
- On the Members tab, click + Select members, search for the app registration you created (for example, LogIngestionApp), select it, and click Next.
- Click Review + assign, then click Review + assign again to confirm.
Role assignments can take two to five minutes to propagate. If you receive a 403 Forbidden error immediately after setup, wait five minutes and retry.
Step 7: Verify the pipeline
From a browser or cURL, verify the DCE endpoint is reachable by running the following command:
curl -I <DCE_LOGS_INGESTION_URI>
An HTTP 400 or 405 response confirms the endpoint is alive. A connection timeout or 000 response indicates the URI is incorrect or unreachable.
Step 8: Check role assignment propagation
Verify that the role assignment was saved correctly before sending log data.
- In the Azure portal, go to Data Collection Rules, and select your DCR. Then, go to Access control (IAM) > Role assignments tab.
- Look for a row where:
- Role is monitoring metrics publisher
- Name is your app registration
- Type is App.
- If the row is present, the assignment was saved correctly. If it's missing, repeat Step 6.
Step 9: Verify role propagation with a test payload
Run the following commands to confirm the role has propagated and the pipeline is ready to ingest data.
# Step 1—Get an access token for your app curl -s -X POST \ "https://login.microsoftonline.com//oauth2/v2.0/token" \ -d "grant_type=client_credentials" \ -d "client_id= " \ -d "client_secret= " \ -d "scope=https://monitor.azure.com/.default" \ | grep -o '"access_token":"[^"]*"' # Step 2—Send a minimal test payload (replace all placeholders) curl -s -o /dev/null -w "%{http_code}" -X POST \ " /dataCollectionRules/ /streams/Custom-S247Log_CL?api-version=2023-01-01" \ -H "Authorization: Bearer " \ -H "Content-Type: application/json" \ -d '[{"TimeGenerated":"2026-01-01T00:00:00Z","Message":"role-check-test"}]'
The following response codes indicate the state of the pipeline.
| Response code | Meaning |
|---|---|
| 204 | Success—role is active, and logs are ingested. |
| 400 or 405 | Alive—role is active, but the payload schema doesn't match the table schema. |
| 401 | Token is invalid—verify your client ID and client secret. |
| 403 | Role not yet propagated—wait five minutes and retry. |
Record format schema
Every custom log table you create in Azure Log Analytics needs a defined schema before the DCR can write to it. Site24x7 supports two ways to shape that schema, selected through the Record Format field when you configure the destination in Site24x7. From the drop-down menu, select the one that matches your query data in Azure, and upload the matching sample JSON when you create the custom log table.
Envelope (TimeGenerated, LogType, Data)
With the envelope format, every forwarded record is wrapped in the same three-column schema, and the actual log fields are serialized as a JSON string inside the Data column.
Example schema JSON for log upload:
{
  "TimeGenerated": "2026-09-27T17:57:03.694Z",
  "LogType": "s247auditlog",
  "Data": "Test alert message"
}
Raw (log fields as columns)
With the raw format, a log record's own fields are mapped directly to named columns in the custom log table, instead of being wrapped inside a single Data column.
Example schema JSON for log upload:
{
    "monitorid": "39130000002251003",
    "s247tagids": ["39130000004650019", "39130000004650017"],
    "outageid": "1783417159812",
    "alert_from": "Site24x7",
    "monitortype": "Server Monitor",
    "notificationprofileid": "39130000000006003",
    "s247agentuid": "384030824313454849",
    "message": "Monitor is CRITICAL",
    "size": "612",
    "received_time": "07-07-2026 15:35:55:420",
    "s247mongroupids": "[39130000004469097]",
    "alerttype": "104",
    "thresholdprofileid": "39130000000047022",
    "alert_to": ["Telegram name"],
    "status": "3",
    "communicationmode": "25",
    "modified_by": "user@domain.com",
    "resource_type": "Users",
    "resource_id": "39130000000013003",
    "site24x7_time": "2026-07-07T11:54:32+0530",
    "params": "None",
    "resource_name": "user@domain.com",
    "remarks": "Login"
}
Add or remove columns in this sample to match the actual fields of the log type you're forwarding before uploading it to Azure.
Configuring Azure log analytics in log forwarding
- Log in to your account.
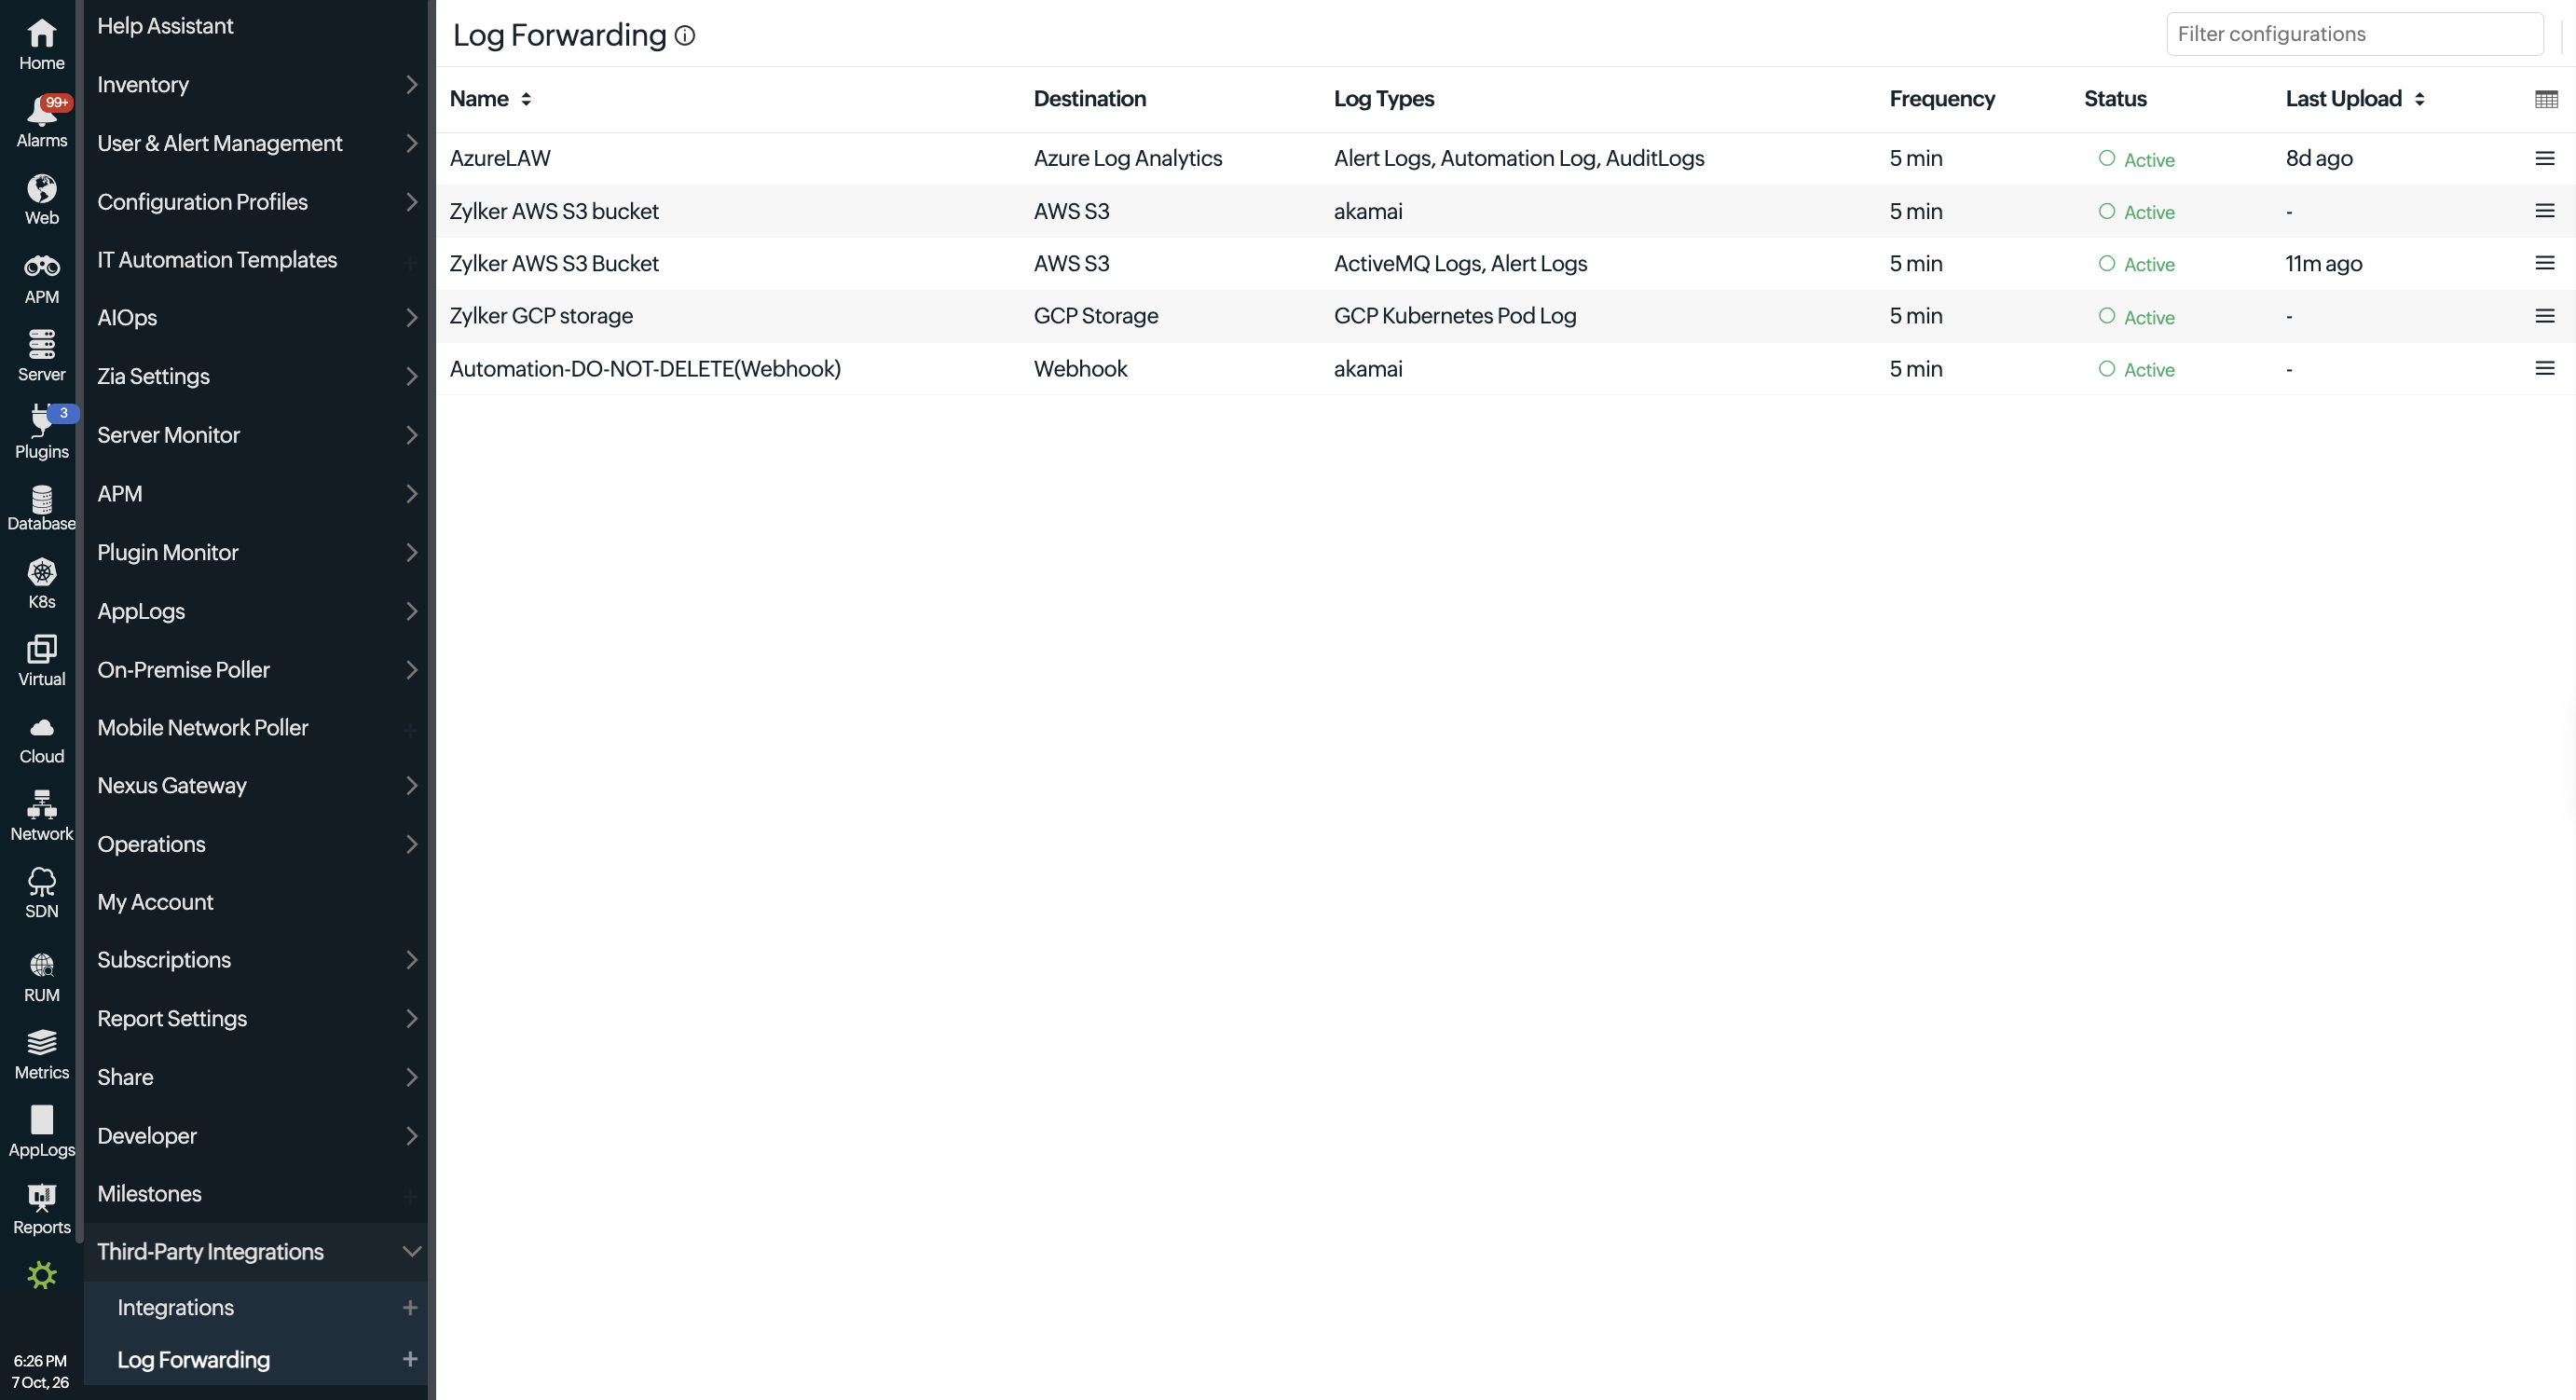
- Navigate to Admin > Third-Party Integrations.
- Click the plus icon + next to Log Forwarding to open the supported destination list.
- Select Azure Log Analytics and click Integrate Now.
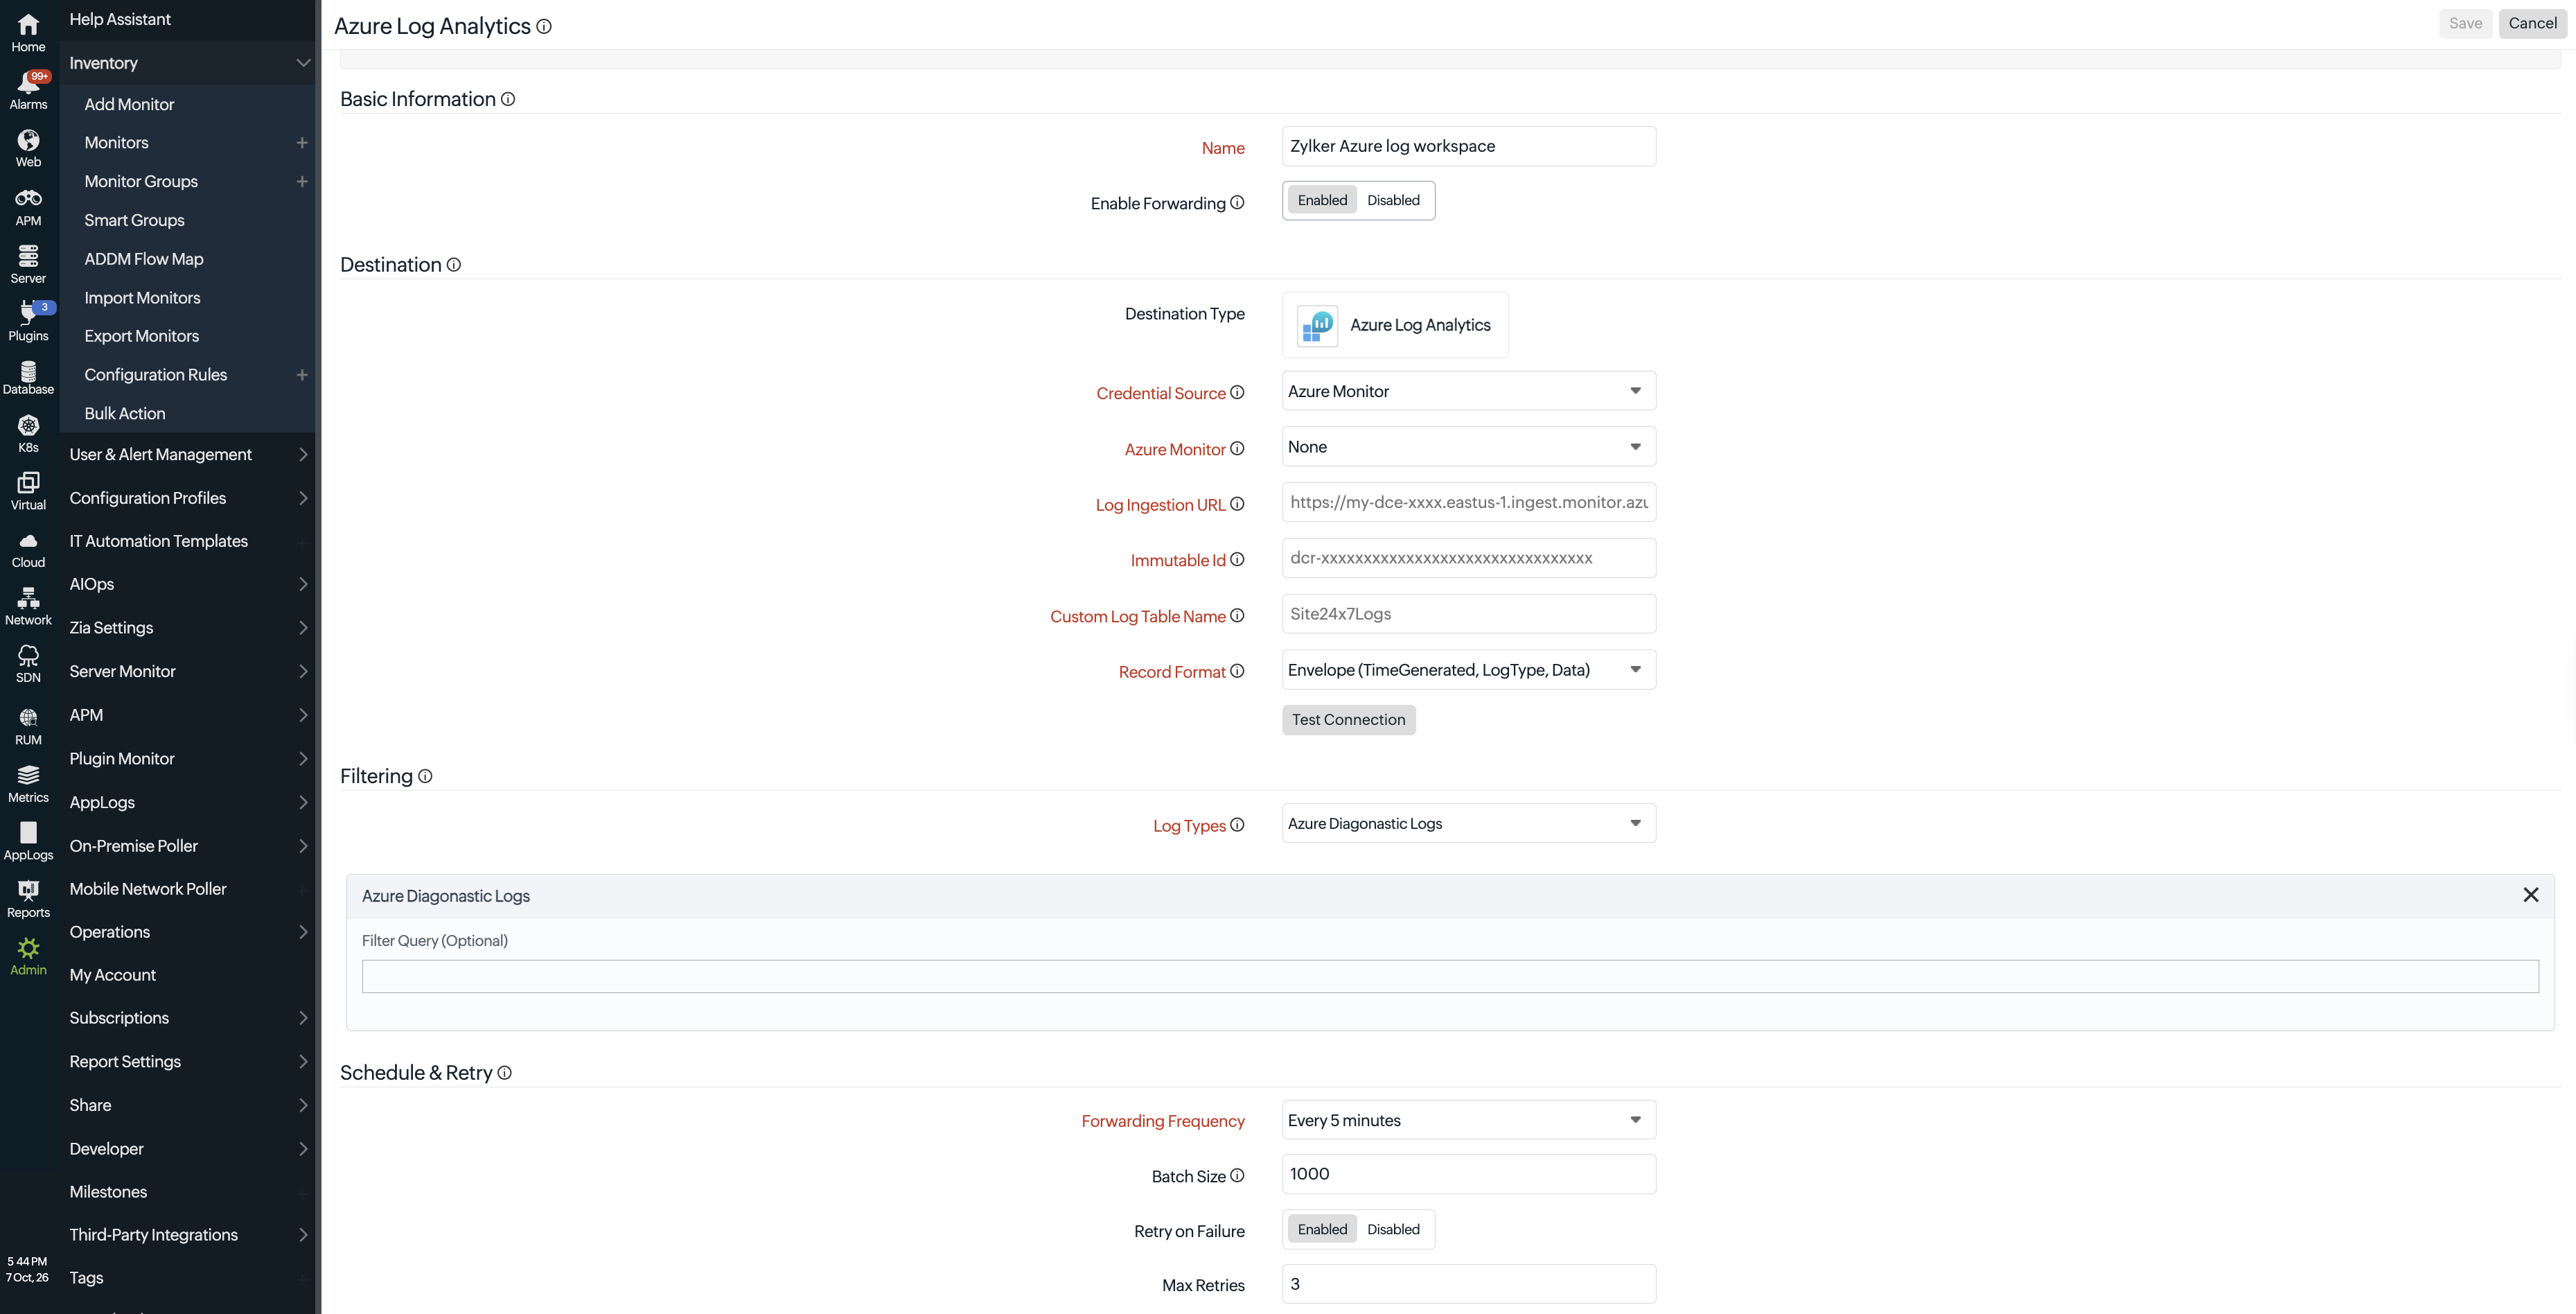
This will open the integration page for the Azure log analytics destination. Enter the following details:
- Basic information: Provide a unique name and enable or disable this configuration.
- Name: Enter a label to identify this configuration.
- Enable Forwarding: Toggle to Enabled to activate the configuration once saved.
- Destination: Choose where logs should be forwarded, and configure the destination credentials.
- Destination Type: Azure Log Analytics is selected by default.
- Credential Source: Choose Azure Monitor to provide connection details directly, or Credential Profile to use a saved credential.
- Azure Monitor: Available when Credential Source is Azure Monitor. Select the Azure monitor you've already configured in Site24x7.
- Credential Profile: Available when Credential Source is Credential Profile. Select the saved credential name, or create a new credential profile if one doesn't already exist.
- Tenant ID: Available when Credential Source is Credential Profile. Specify the Directory (tenant) ID copied from your app registration's Overview page in Microsoft Entra ID.
- Log Ingestion URL: Provide the Logs Ingestion URI copied from the DCE Overview page. Format: https://
- . .ingest.monitor.azure.com - Immutable ID: Specify the DCR immutable ID. Format: dcr-xxxxxxxxxxxxxxxxxxxxxxxxxxxxxxxx
- Custom Log Table Name: Enter the name of the custom log table where the logs should be stored.
- Record Format: From the drop-down menu, select the schema your custom log table uses: Envelope (TimeGenerated, LogType, Data) or Raw (log fields as columns).
- Click Test Connection to test the connection and confirm the integration is reachable and writable.
- Filtering: Restrict which logs are forwarded by log type and query.
- Log Types: Select the log types whose data you want to forward. More than 100 default log types are available.
- Filter Query: Optionally, enter a filter query to forward only matching records. By selecting or deselecting from the log type drop-down menu, you can add more than one query. Click the X icon to remove a query. See Filtering the logs you forward for query syntax and examples.
- Schedule and Retry: Control how often logs are forwarded and the retry behavior upon failure.
- Forwarding Frequency: Select how often batches are written to the destination—every one, five, 15, 30, or 60 minutes.
- Batch Size: Set the maximum number of records per object. Default is 1,000. Learn more about the batching and delivery options.
- Retry on Failure: Toggle to Enable to automatically retry failed deliveries.
- Max Retries: Enter the maximum number of retries on failure.
- Click Save to apply the configuration.
Managing the Azure log analytics configuration
- Navigate to Admin > Third-Party Integrations > Log Forwarding.
- Locate the configuration on the listing page. To make any changes, click the configured forwarding entry to open the Edit Configuration page.
- Click the hamburger icon
 on the right corner of each configured forwarding entry to perform the below actions:
- Click Disable forwarding to temporarily stop forwarding.
- Click Enable forwarding to resume the forwarding.
- Click Delete to remove it permanently.