Application Dependency Maps (Service Maps)
Application Dependency Maps give you a complete overview of your application infrastructure along with its connection to other dependent resources. With application dependency maps, you can view:
- The status of your application, instances, and the associated servers.
- Key metrics like Response time, Throughput and Status of connection.
- Number of failed request count.
This helps you to detect and troubleshoot your application problems before your customers are impacted.
Video
Here's a quick video that shows how Service Maps help simplify the first step of troubleshooting:
To view Application dependency maps
- Log into your Site24x7 Account > Home > APM Insight.
- Choose your application or instance.
- Click on Service Map for topological view of your application infrastructure.
Application dependency maps do not need any configuration.
Metrics and Inference
Application dependency maps can be visualized in the following views.
1. Map View
In Map view,
- Application along with their instances are represented in the central node.
- Enclosing circle represents the application.
- Inner circles represent each of the application instances.
- Green- Indicates application/instance is Up.
- Red- Indicates application/instance is Down.

- Application name is displayed on mouse hover of the central node.
- Hovering over the inner circle displays the instance name.
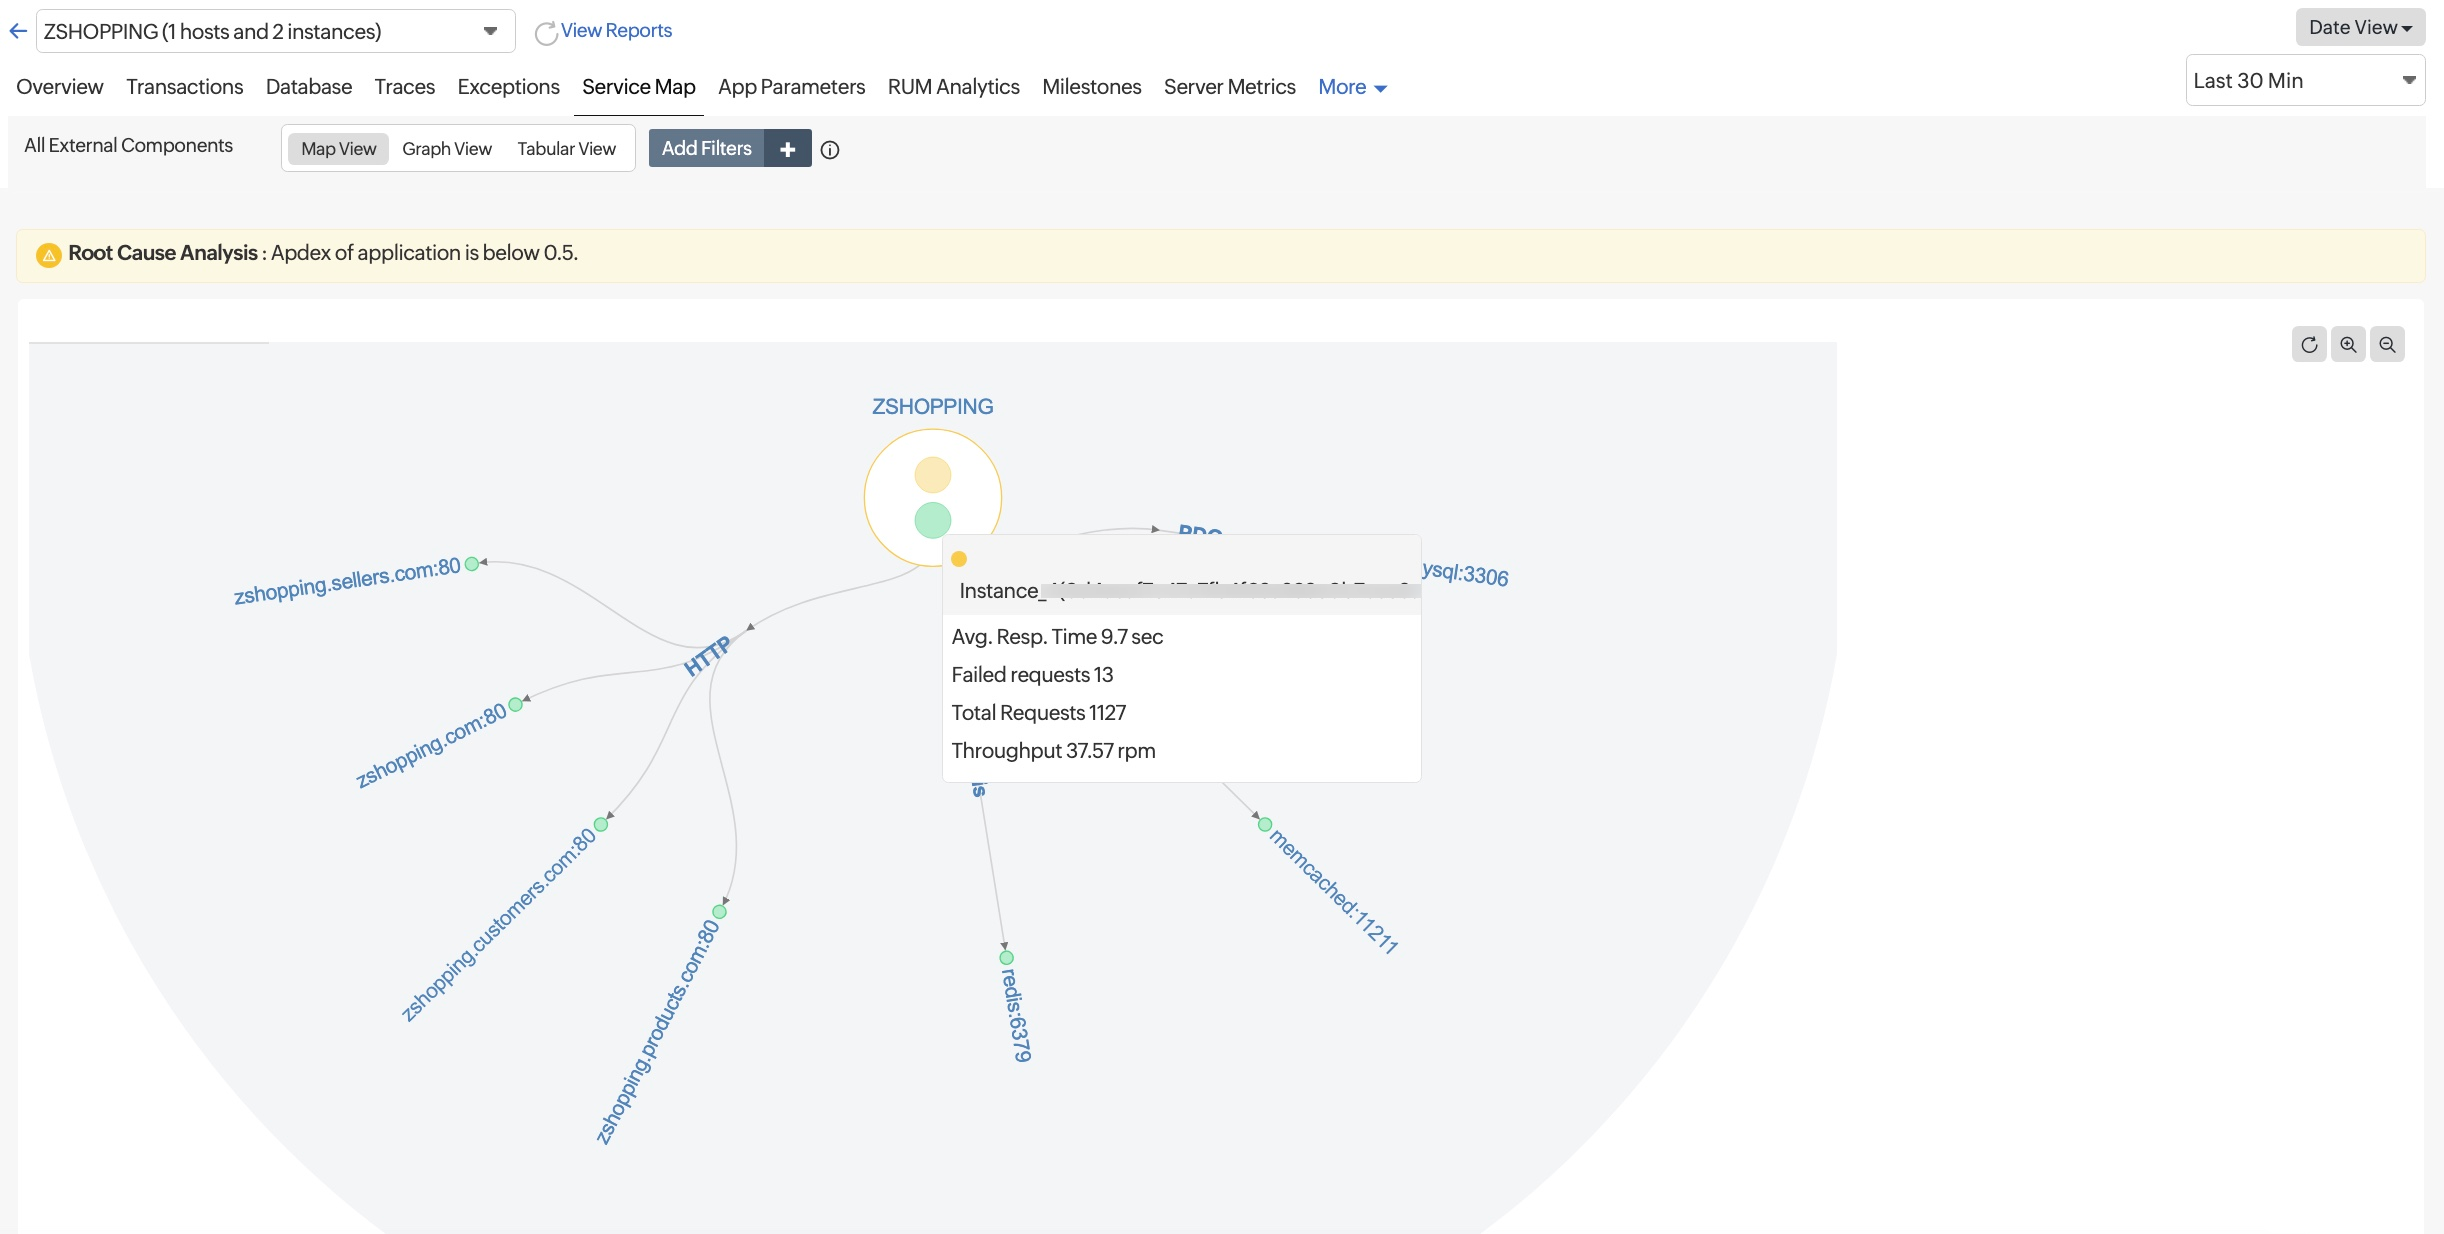
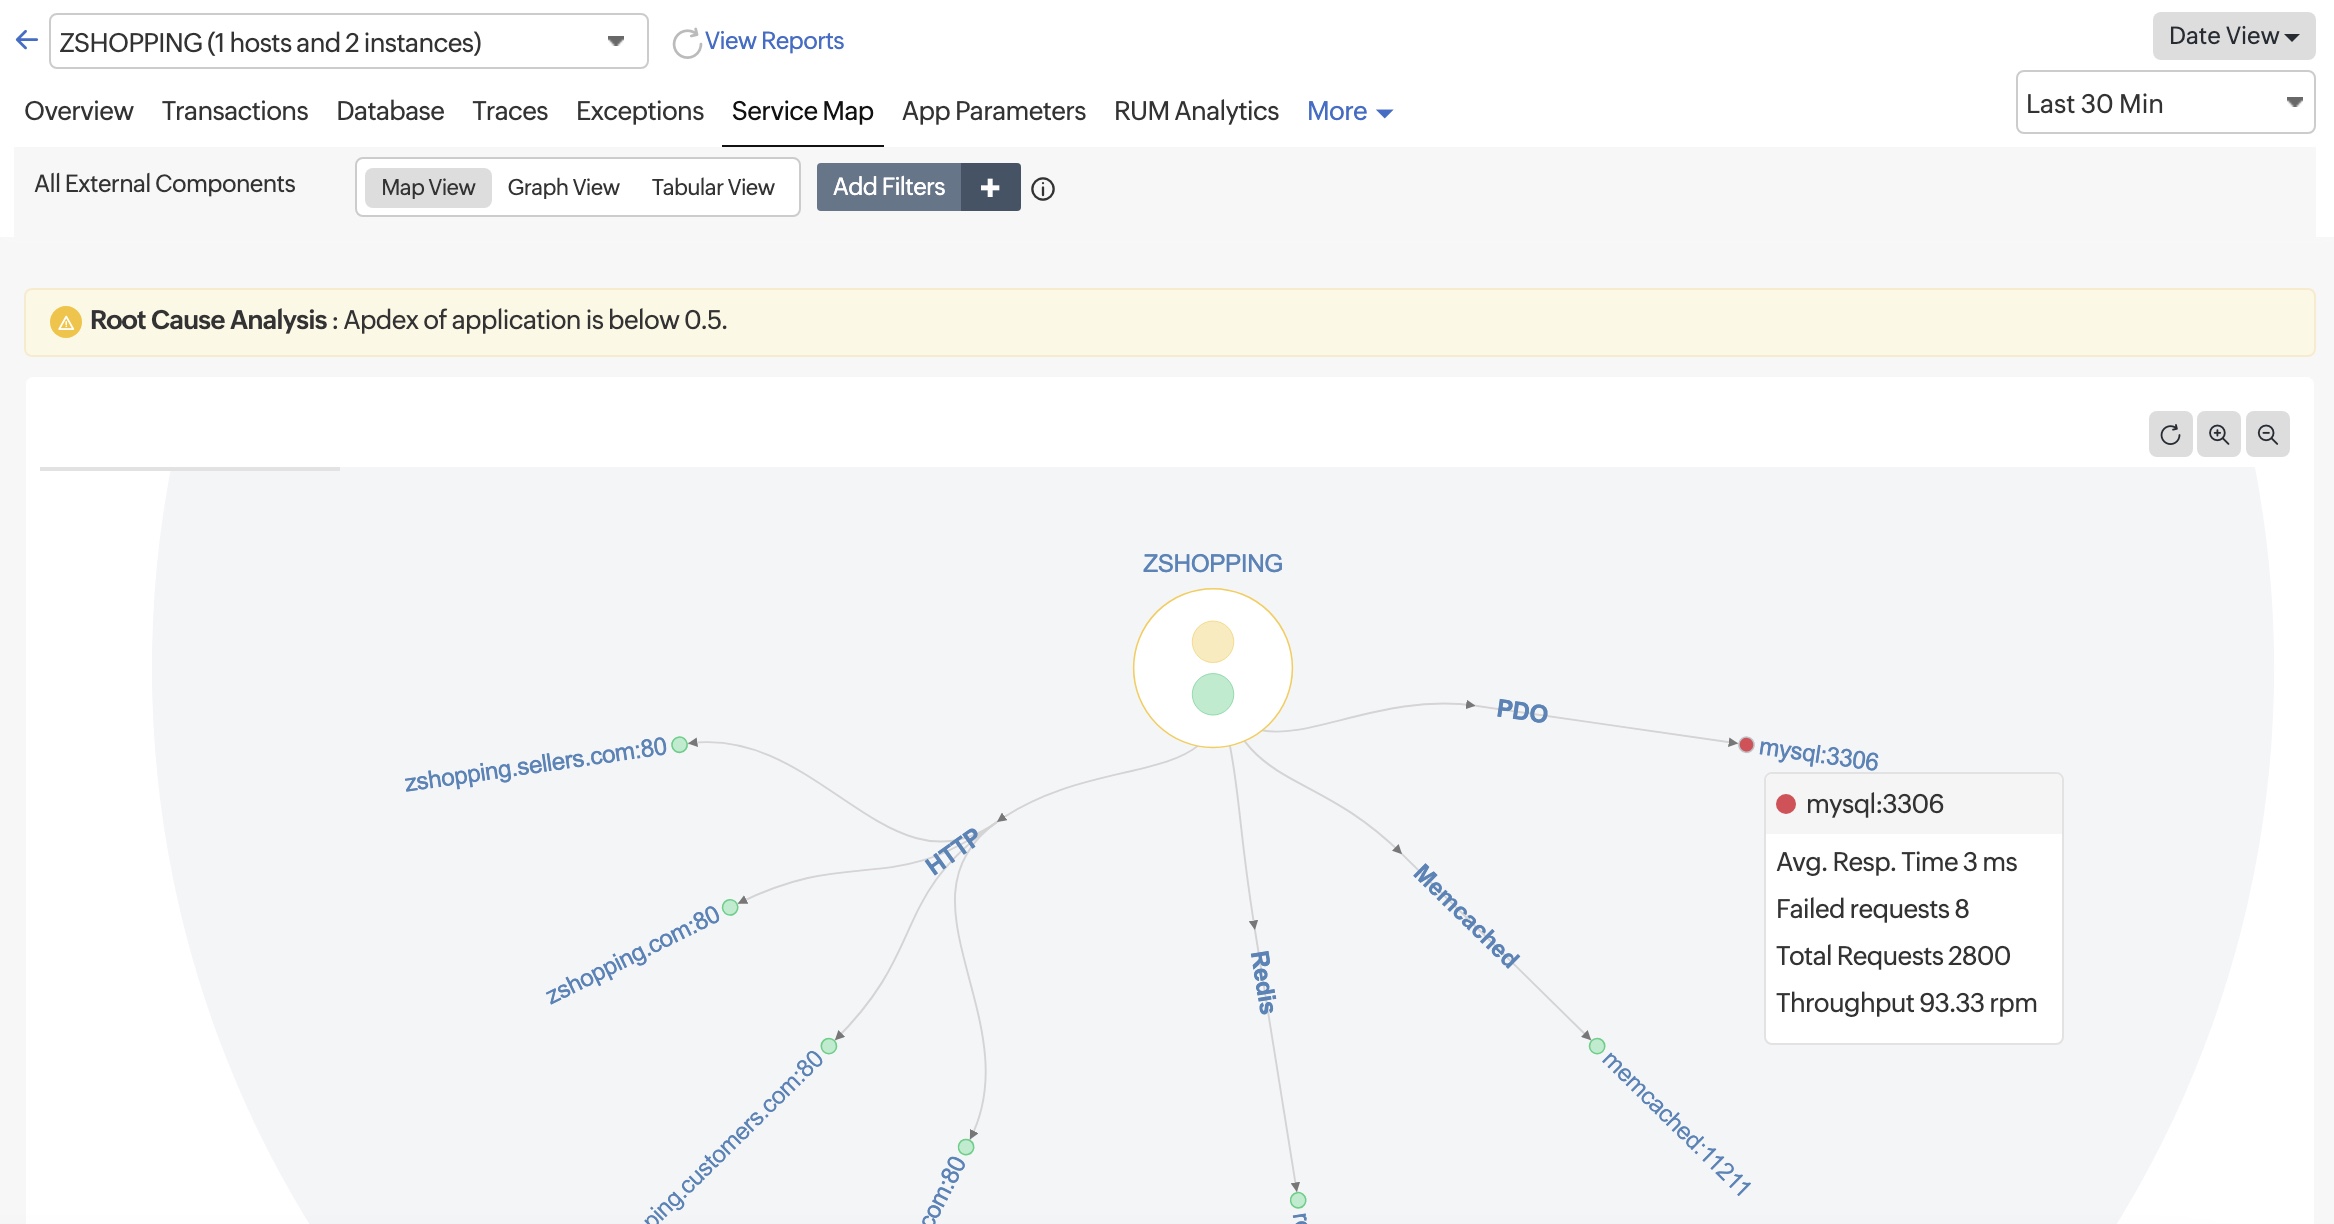
- View the status of the external components along with their key metrics on mouse hover. In case of a failed request, the component is indicated in red along with the failed request count.
- View the key metrics such as Availability, CPU, Memory, and Disk utilization of the server mapped with the corresponding instance by hovering over the instance node. Clicking on the instance node takes you to the Overview tab.

- View the key metrics such as Availability, CPU, Memory, and Disk utilization of the server mapped with the corresponding component by hovering the mouse over the component. The Server Metrics tab of the appropriate node is accessed by clicking on the metrics.

When you click on an individual component node, you will be taken to the corresponding Graph View.
Filter components based on key transactions using the Add Filters option. This allows you to customize the Map View to display only the components directly related to specific, critical transactions. By focusing on these key interactions, you gain a clearer understanding of how core transactions connect with various application components.
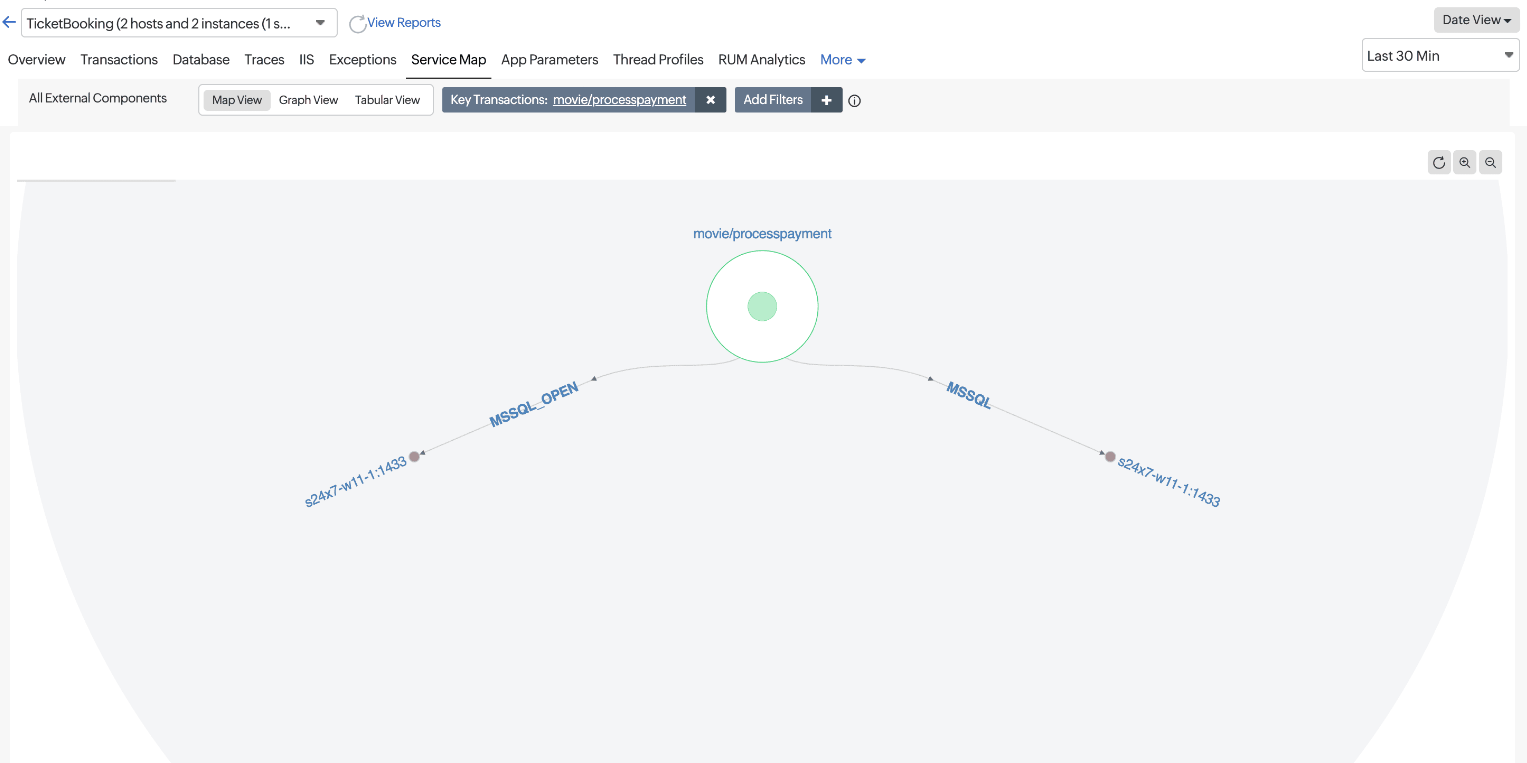
You can also view this map by navigating to the Transactions > Key tab. Click on the desired transaction and scroll down to view the map.
Understanding distributed calls:
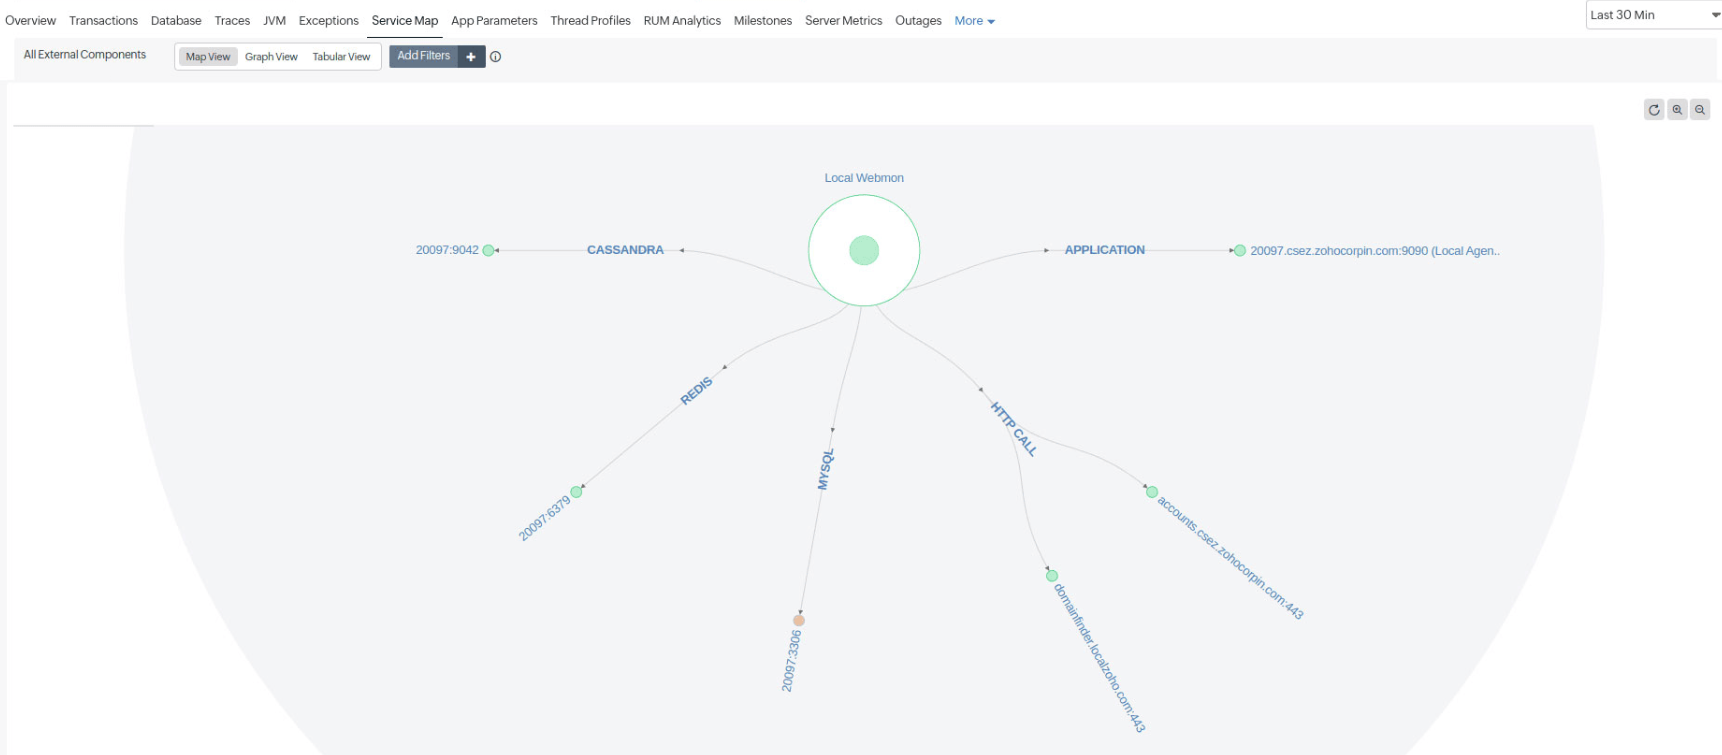
You can also view distributed calls across multiple applications by viewing the APPLICATION entity. This entity correlates transaction data when one service calls another, enabling you to monitor metrics for each connected application in a single, consolidated view.
For example, in the screenshot below, the APPLICATION entity links the main application, Local Webmon to another application labeled 20097.csez.zohocorpin.com:9090 (Local Agent).
2. Graph View
The host name of the selected component is displayed at the top, along with its mapped server name, which is displayed within the braces. In the below screenshot, 198.0.3.3:8000 is the component's host name, and test-app3467:8000 is the server name.
The top band displays the important metrics like Avg.Resp.Time, Throughput, Req.Count, and Errors.

When you click on the Server Monitor link, you will be taken to the corresponding Server Monitor's Summary page.
The graph view also lists out parameters like average response time,total response time, throughput, total request count, error count and error rate. These metrics can be viewed for all components, for all hosts corresponding to individual components and for individual hosts.
- Graph view showing all metrics for all components

- Graph view showing all metrics of all hosts of a particular component

- Graph view showing all metrics of a particular host of a particular component

- Graph view showing the server's important metrics connected with a certain component, like MySQL, Cassandra, or Redis.

3. Tabular View
The Tabular view lists down all components along with their respective hosts and the associated servers.
- Clicking on individual component or host takes you to the corresponding Graph View.

- Clicking on the component drop-down shows you the mapped server, and clicking on an individual server takes you to the corresponding Graph View.
