Amazon Elastic Beanstalk Monitoring Integration
Amazon Elastic Beanstalk lets you provision and scale web applications with ease by removing the administrative overhead involved in capacity provisioning, load balancing and scaling. With Site24x7's AWS integration, you collect data for visibility, configure thresholds and get alerted whenever a problem arises in your beanstalk environment.
Support
By default, Site24x7 collects information from the basic health reporting system to determine the health of your environment. Additionally you can also enable enhanced reporting for your environment or update your health reporting preferences to publish system level and application level metrics to CloudWatch to track them using Site24x7.
Setup and configuration
- If you haven't done it already, enable access to your AWS resource and services by creating Site24x7 as an IAM user or an IAM role. Learn more.
- Next, in the Integrate your AWS account section, please make sure the ElasticBeanstalk checkbox is selected in the Services to be discovered field. Learn more.
Policies and permissions
Please make sure the following read level actions are present in the IAM policy assigned to Site24x7 entity. Learn more.
- "elasticbeanstalk:DescribeEnvironmentResources",
- "elasticbeanstalk:DescribeAccountAttributes",
- "elasticbeanstalk:DescribeEnvironments",
- "elasticbeanstalk:DescribeEvents",
- "elasticbeanstalk:DescribeInstancesHealth",
- "elasticbeanstalk:DescribeEnvironmentHealth",
- "elasticbeanstalk:DescribeConfigurationSettings",
- "elasticbeanstalk:ListTagsForResource",
- "cloudformation:ListStackResources",
- "autoscaling:DescribeAutoScalingGroups",
- "autoscaling:DescribeAccountLimits",
- "autoscaling:DescribeLaunchConfigurations",
- "s3:ListAllMyBuckets",
- "s3:GetObject",
- "s3:GetObjectAcl",
- "s3:GetObjectVersion",
- "s3:GetObjectVersionAcl",
- "s3:GetBucketLocation",
- "s3:GetBucketPolicy",
- "s3:ListBucket"
Update the health preference for your environment
If you've created an environment with the latest platform versions, then enhanced heath would be enabled by default. However, to record and track environment and system level metrics using Site24x7, you need to publish the data collected by the Elastic Beanstalk service to CloudWatch as custom metrics:
To select which metrics you want to monitor for your environment, follow the below mentioned steps:
- Sign into the Elastic Beanstalk console and navigate to the Management page for your environment
- Select Configuration and choose Modify on the Monitoring configuration card
- Under health reporting, the Enhanced option would already be selected.
- Use Ctrl/Command key to select multiple metrics
- Choose Apply.
By default no metrics would be selected, you need to select them to generate preconfigured time series graph in the Site24x7 console. Also CloudWatch charges for custom metrics applies to all the metrics other except Environment Health.
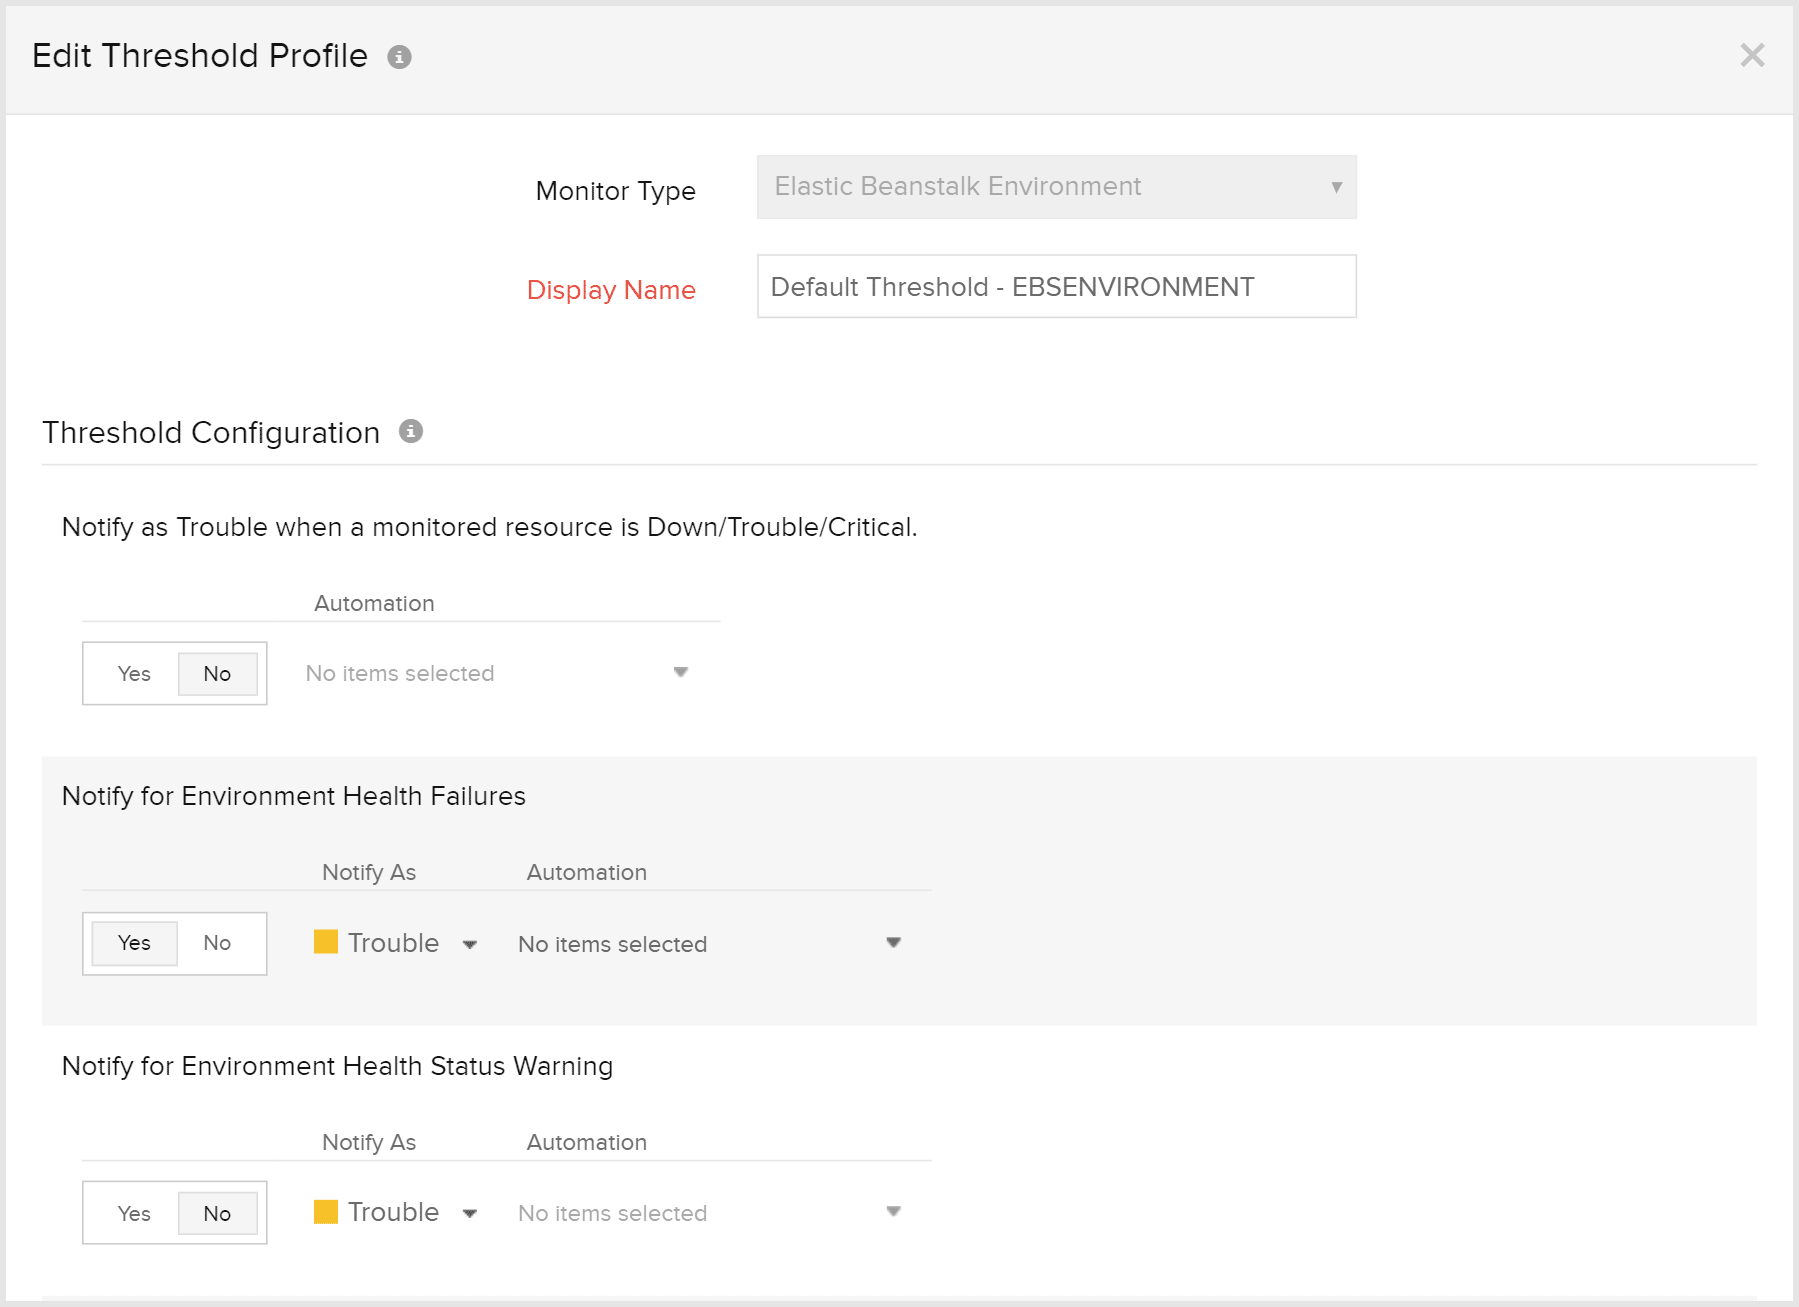
Alerts on Threshold Breach
On the Edit Threshold Profile page, toggle to Yes to receive notifications for the following threshold values when:
- The monitored resource is Down/Critical/Trouble
- Environment health failure occurs
- Environment health status warning occurs
- The platform branch status is deprecated or retired
Polling interval
Site24x7 collects performance statistics, health status and inventory data as per the poll frequency set (1 minute to a day). Learn more.
IT Automations
You can add automations for the AWS services supported by Site24x7. Log in to Site24x7 and go to Admin > IT Automation Templates (+) > Add Automation Templates. Once automations are added, you can schedule them to be executed one after the other.
You can now restart the web servers running in your Beanstalk environment using Amazon Elastic Beanstalk service automations.
Licensing
- Each Amazon Elastic Beanstalk monitor is considered a basic monitor.
Supported Metrics
Environment level data
| Attribute | Description | Data type | Statistics |
|---|---|---|---|
| Environment Health | Shows the health status of the environment – 0(OK), 1(Info), 5(Unknown), 10(No data), 15(Warning), 20(Degraded), and 25(Severe) | Count | Sum |
| Instances OK | Measures the number of instances in OK health status | Count | Sum |
| Instances Pending | Measures the number of instances with Pending health status | Count | Sum |
| Instances Info | Measures the number of instances with Info health status | Count | Sum |
| Instances Unknown | Measures the number of instances with Unknown health status | Count | Sum |
| Instances Nodata | Measures the number of instances with No data health status data | Count | Sum |
| Instances Warning | Measures the number of instances with Warning health status | Count | Sum |
| Instances degraded | Measures the number of instances with Degraded health status | Count | Sum |
| Instances Severe | Measures the number of instances with Severe health status. | Count | Sum |
Instance level data
| Attribute | Description | Data type | Statistic |
|---|---|---|---|
| Load average 1min | Measures the average CPU load over the last one minute | Count | Average |
| Instance health | Measures the health status of the instance | Count | Maximum |
| Root file system Util | Measures the percentage of disk space in use. | Percentage | Average |
| CPU Irq | Measures the percentage of time spent by the CPU to service hardware interrupts. | Percentage | Average |
| CPU User | Measure the percentage of time spent by the CPU while executing at user level. | Percentage | Average |
| CPU Idle | Measures the percentage of time the CPU was idle | Percentage | Average |
| CPU system | Measures the percentage of time spent by the CPU while executing at system (kernel) level. | Percentage | Average |
| CPU Soft Irq | Measures the percentage of time spent by the CPU to service software interrupts. | Percentage | Average |
| CPU IO wait | Measures the percentage of time the CPU was idle, when there was an outstanding disk I/O request. | Percentage | Average |
| CPU Nice | Measures the percentage of time the CPU was running processes with a positive NICE value. | percentage | Average |
| Attribute | Description | Datatype | Statistics |
|---|---|---|---|
| Application Requests total | Measures the number of requests completed by the instance or environment | Count | Sum |
| Application requests 2xx | Measures the number of requests completed with a 2xx code | Count | Sum |
| Application requests 3xx | Measures the number of requests completed with a 3xx code | Count | Sum |
| Application requests 4xx | Measures the number of requests completed with a 4xx code | Count | Sum |
| Application requests 5xx | Measures the number of requests completed with a 5xx code | Count | Sum |
| Application latency P10 | Measures the average time taken to complete the fastest 10% of requests | Second | Average |
| Application latency P50 | Measures the average time taken to complete the fastest 50% of requests | Second | Average |
| Application latency P75 | Measures the average time taken to complete the fastest 75% of requests | Second | Average |
| Application latency P85 | Measures the average time taken to complete the fastest 85% of requests | Second | Average |
| Application latency P90 | Measures the average time taken to complete the fastest 90% of requests | Second | Average |
| Application latency P95 | Measures the average time taken to complete the fastest 95% of requests | Second | Average |
| Application latency P99 | Measures the average time taken to complete the fastest 99% of requests | Second | Average |
| Application latency P99.9 | Measures the average time taken to complete the fastest X% of requests | Second | Average |
To view data
- Log in to the Site24x7 console, click on AWS > Monitored AWS account and select Elastic Beanstalk from the drop down.
- From the list of monitored environments, choose the environment for which you want to access metrics for.
- The various graphs on application health are displayed in the Summary tab.
Elastic Beanstalk monitoring UI pages
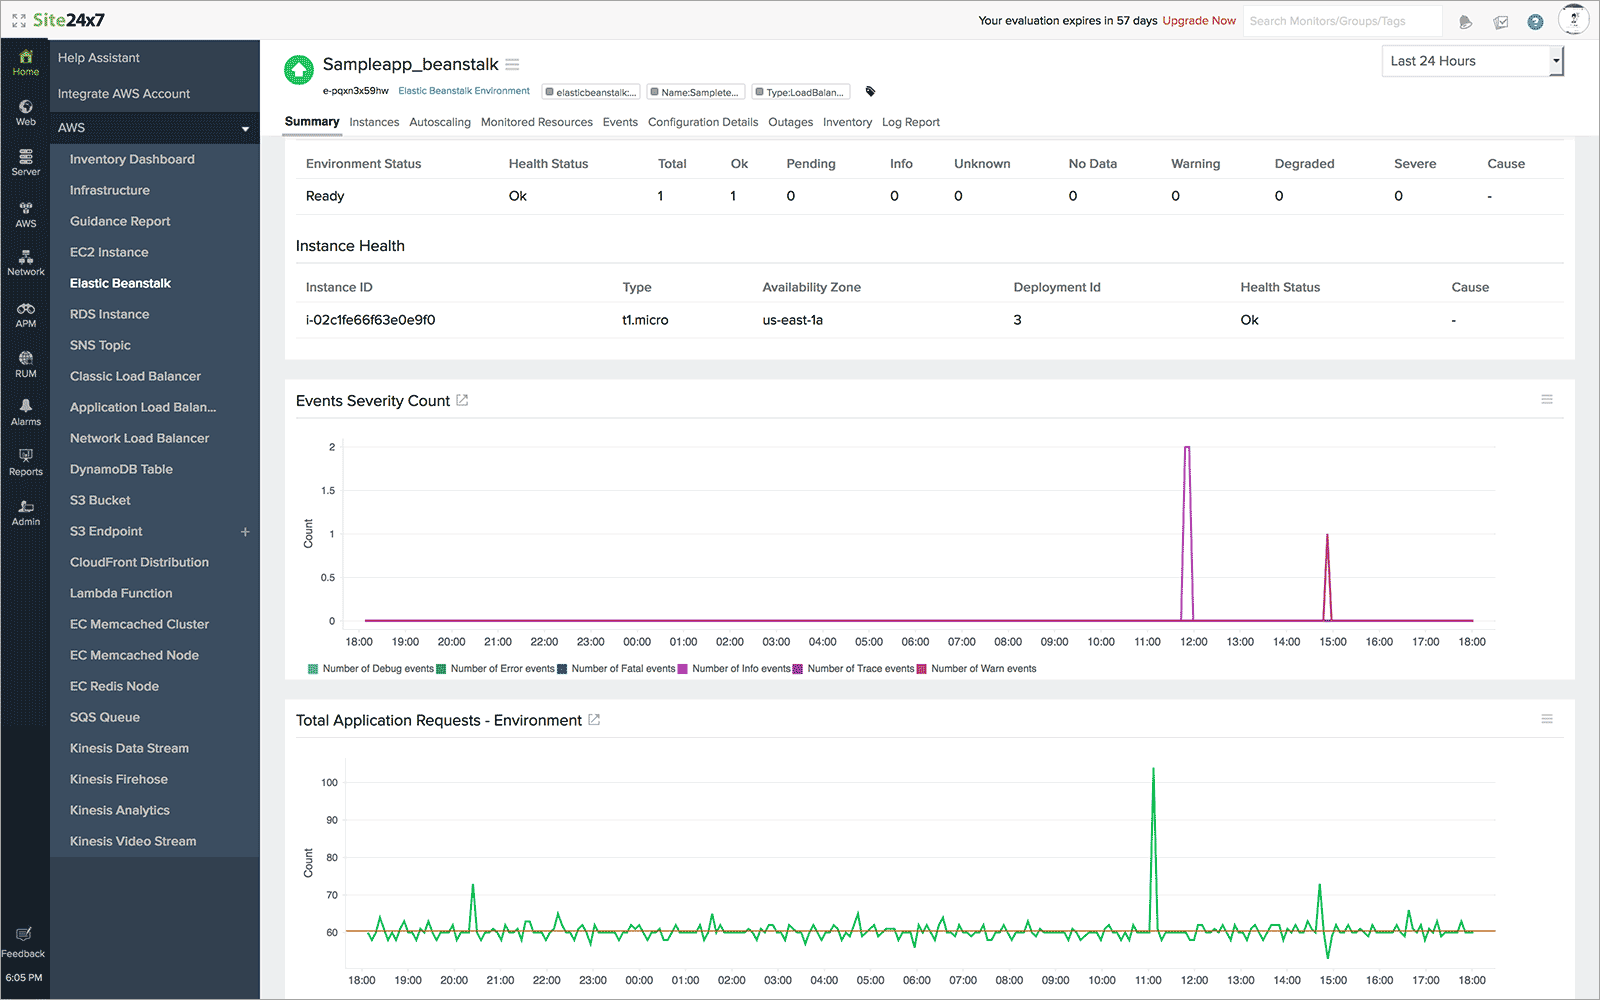
Summary
Use Site24x7's Elastic Beanstalk Summary tab to better understand application health. By default, the Environment Health Overview and Instance Health widgets are shown along with the charting for Events Severity count.
Instances
Site24x7's Instance tab, is equipped to provide your near real time visibility into the health of the Amazon EC2 instances powering your web application. By default, no charting is visible. Update you Elastic Beanstalk setting, select the metrics you want to monitor for your instance, to generate metrics in the Site24x7 UI.
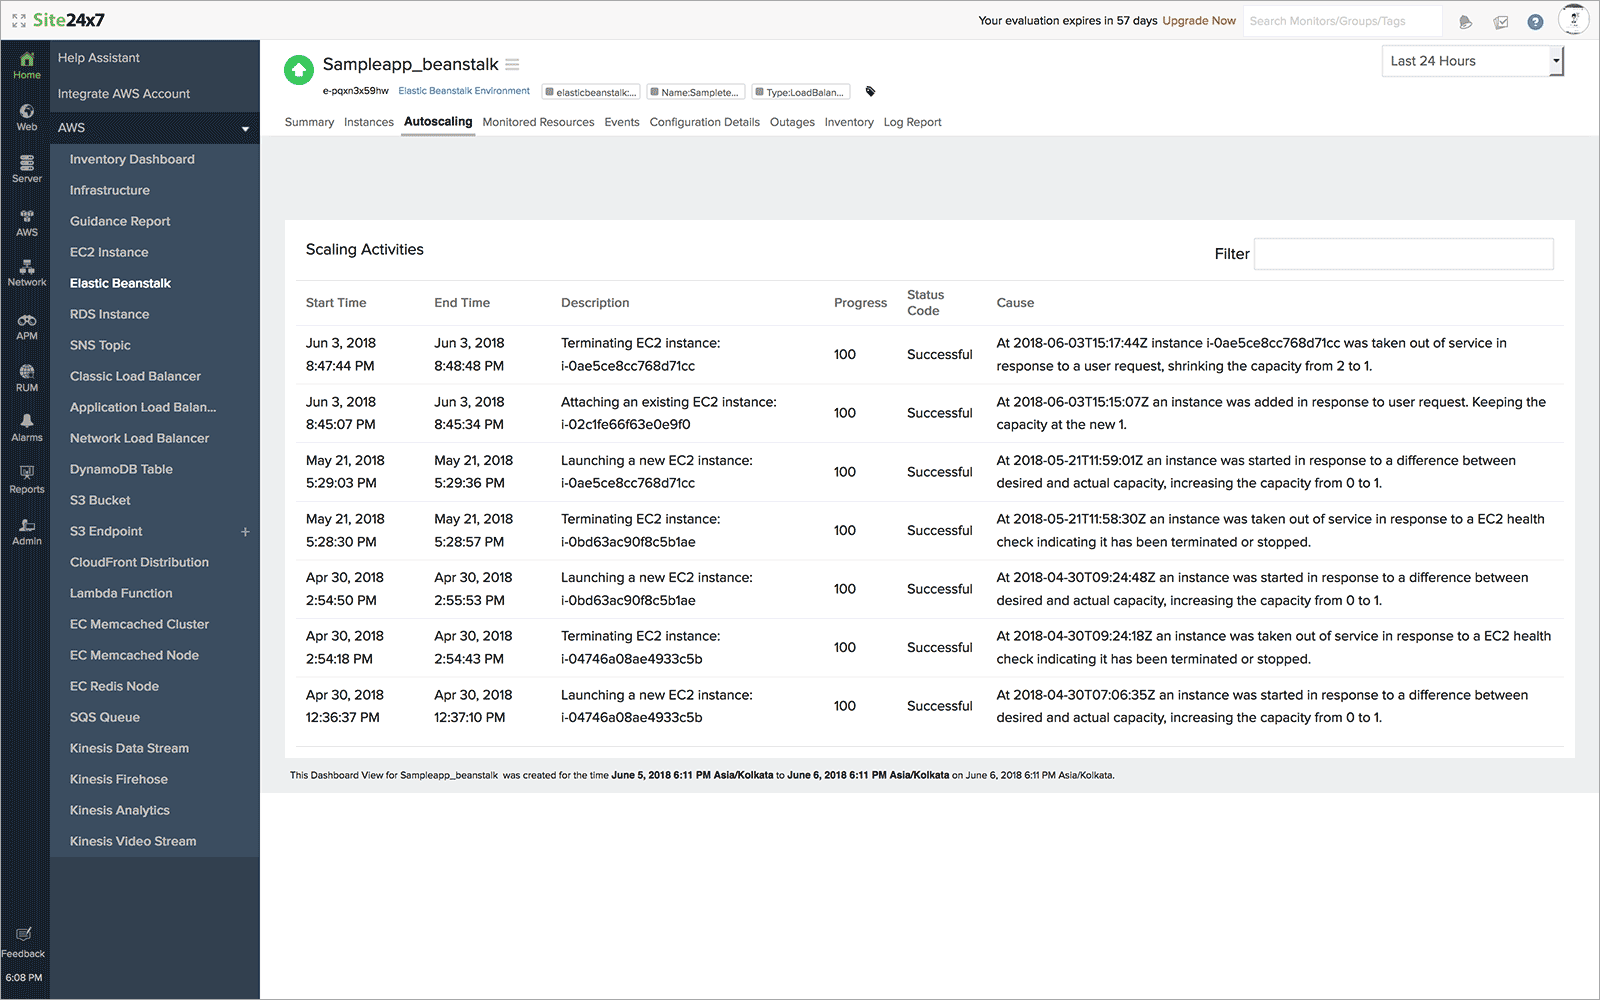
AutoScaling
Know when you AutoScaling is launching or terminating EC2 instances from your AutoScaling group. View launch configuration details along with scaling events and description, compare environment health with changes to determine root cause.
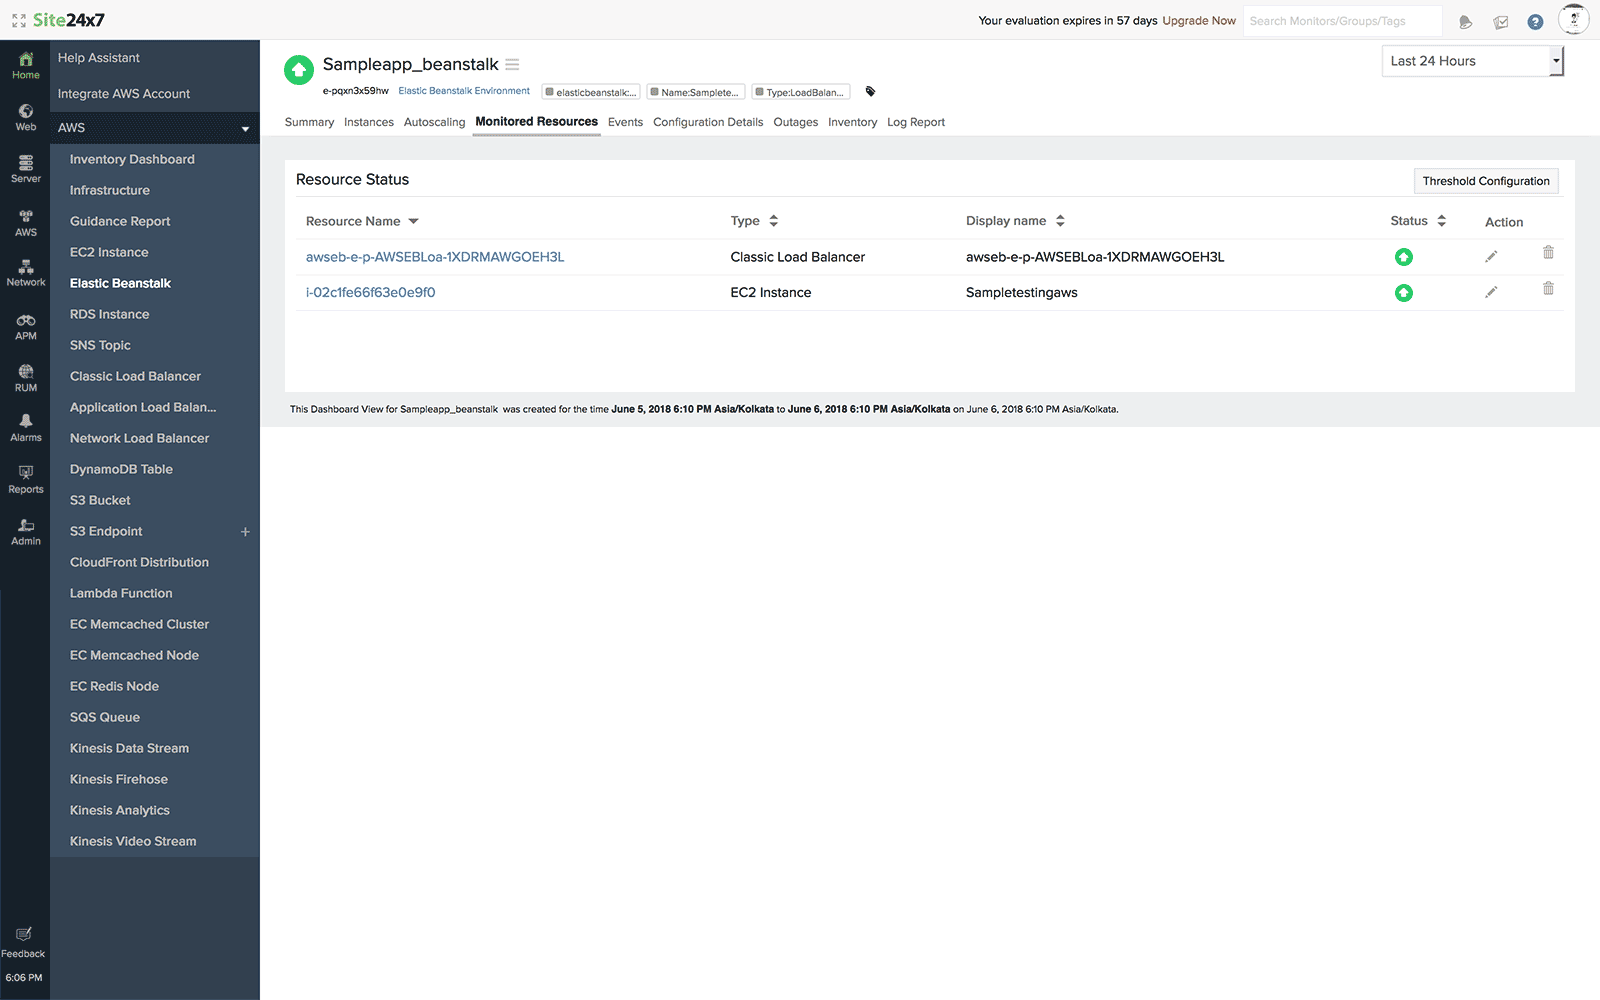
Monitored Resources
Here you can view a list of monitored EC2 instances, Elastic Load balancing nodes, and SQS queue's associated with your Elastic Beanstalk environment. Click on an individual listing to see performance and resource usage stats associated with that resource. You can also set thresholds and be notified when any of these services fail by clicking the pencil icon under Action.
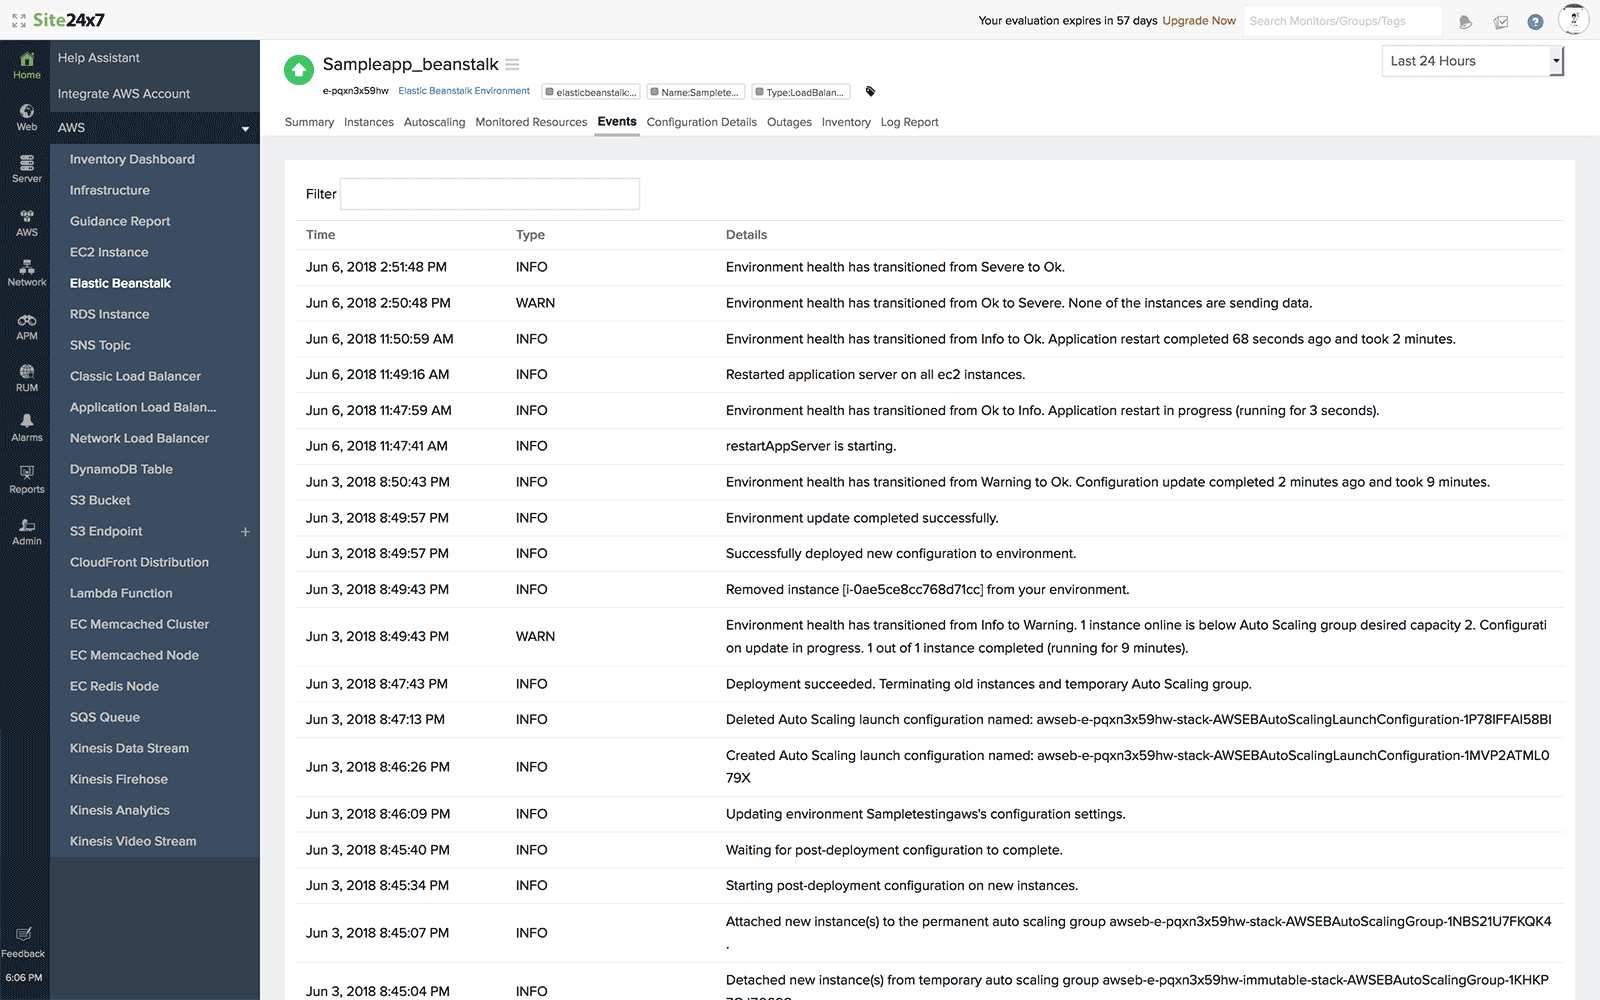
Events
Our Elastic Beanstalk monitoring Events page, shows a list of all events and notifications generated by the platform or emitted by your application environment. At any point in time you can view the last 100 events generated.
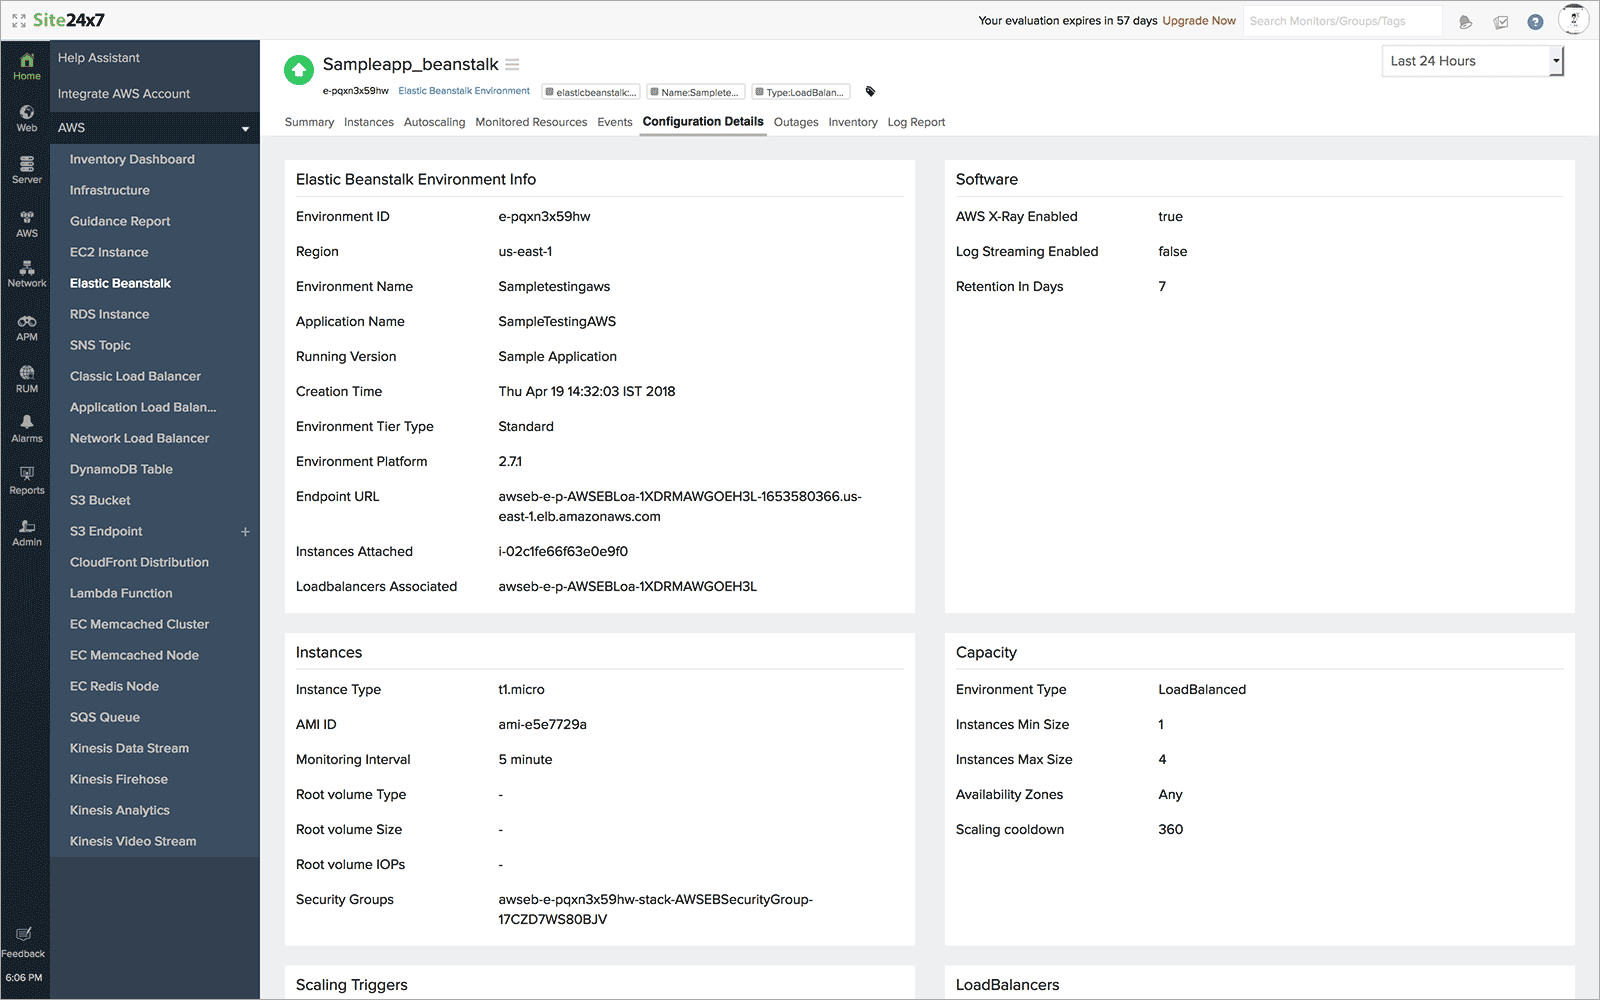
Configuration Details
Get a complete configuration overview of of your Elastic Beanstalk environment. View configuration information for every resource – EC2 instances, AutoScaling group, instance security group, load balancer, load balancer security group and more.
Topology View
The Topology View tab delivers a live, resource-centric dependency map. It dynamically traces how your Elastic Beanstalk resource is connected to its surrounding AWS infrastructure in real time, enabling faster root cause isolation when alerts fire. If any connected component is in a Critical state, it is marked accordingly within the topology view, along with the outage reason, so you can pinpoint the exact failure point without needing to navigate away from the monitor page. Unlike account-wide topology views, this tab scopes visualization to a single resource, answering the precise question: What does this Elastic Beanstalk resource connect to, and what breaks if it does?You can trace the full dependency chain from the individual resource up through its primary parent entities to the Service type, Region, and AWS account levels.