Amazon RDS Monitoring Integration
Amazon's Relational Database Service (RDS) is a managed web service that lets you deploy and scale SQL data stores in the cloud with ease. With Site24x7's RDS integration you can monitor metrics like CPU utilization, CPU credit usage, burst balance, read/write IOPS, database connections, network throughput and more for each active relational database instance. All RDS engine types are supported.
Setup and configuration
- If you have't done already, enable Site24x7 access to your AWS account (IAM user or IAM role). Learn more.
- In the Integrate AWS Account page, select RDS from the Services to be discovered field. Learn more.
Performance Insights for RDS monitoring
Performance Insights is an advanced tool provided by AWS that allows users to gain deep visibility into the performance of their RDS database instances, helping to diagnose performance issues and optimize database operations. Site24x7's RDS Performance Insights monitor helps you monitor and analyze the performance of RDS instances in real-time.
To fully leverage Site24x7's RDS monitoring, ensuret that you enable Performance Insights in the AWS Management Console.
To enable Performance Insights for an RDS instance in AWS Console, follow the steps below:
- Open the AWS Management Console.
- Navigate to RDS and select Databases.
- Choose the instance for which you want to enable Performance Insights.
- Click Modify.
- Under the Monitoring section, enable the Turn on Performance Insights option and set the retention period.
- Review the changes and click Continue.
- Select the applicable Schedule modifications option and click Modify cluster.
Site24x7 offers the Performance Insights monitor as an advanced monitor. When you integrate an RDS instance with Performance Insights configured in AWS, Site24x7 automatically creates a Performance Insights monitor for that RDS instance.
- When you set the Enable RDS Performance Insights option in the Advanced Configuration section to No, Performance Insights configured for all RDS instances will be suspended for the applicable AWS account, and Site24x7 will disable Performance Insights monitoring.
- When you define the criteria for an RDS instance and set the Enable RDS Performance Insights action to False in the Admin > Configuration Rules section, Performance Insights configured for all RDS instances will be suspended across all integrated AWS accounts in Site24x7.
To disable Performance Insights monitor for your RDS instance in Site24x7,
- Navigate to the Edit Monitor Details page of your monitored RDS instance.
- Toggle the Turn on Performance Insights option to No.
- Click Save.
Policies and permissions
Please make sure the following read level API actions are present in the policy assigned to the Site24x7 IAM entity. Learn more.
- "rds:ListTagsForResource",
- "rds:DescribeDBInstances",
- "rds:DescribeDBLogFiles",
- "rds:DescribeAccountAttributes",
- "rds:DescribeDBClusters",
- "rds:DescribeEvents"
- "rds:DescribeDBClusterParameters",
- "rds:DescribePendingMaintenanceActions",
- "rds:DescribeDBClusterEndpoints"
Polling frequency
Site24x7 queries the CloudWatch API as per the poll frequency set (1 minute to a day), to collect performance metrics for your RDS resource. Learn more.
IT Automations
You can add automations for the AWS services supported by Site24x7. Log in to Site24x7 and go to Admin > IT Automation Templates (+) > Add Automation Templates. Once automations are added, you can schedule them to be executed one after the other.
Refer the below topics to learm more about the RDS actions:
- Start, stop, and reboot with failover the DB instances with Amazon RDS automations.
- Start, stop, and reboot Amazon RDS Cluster actions.
Supported metrics
Amazon RDS performance metrics
| Attribute | Description | Statistics | Data type |
|---|---|---|---|
| Bin log disk usage | Measures the amount of disk space occupied by binary logs. Applicable only for MySQL read replicas. | Average | Bytes |
| Buffer cache hit ratio | Measures the percentage of requests served by buffer cache. | Average | Percentage |
| Burst balance | Measures the percentage of available GP2 burst-bucket I/O credits. | Average | Percentage |
| CPU utilization | Measures the percentage of CPU used. | Average | Percentage |
| CPU credit usage | Measures the number of credits spent by the DB instance. | Average | Count |
| CPU credit balance | Measures the number of earned CPU credits that have been accrued. | Average | Count |
| CPU surplus credit balance | Measures the number of surplus credits that have been spent. Only applicable for T2 unlimited instance. | Average | Count |
| Database connections | Measures the number of database connections in use. | Average, sum, maximum | Count |
| Database connections real count | Measures the number of active/open connections. | Average | Count |
| CPU surplus credits charged | Measures the number of spent surplus credits that are not paid down by earned CPU credits. Only applicable for T2 unlimited instance. | Average | Count |
| Disk queue depth | Measures the number of outstanding I/O requests (read/write). | Average | Count |
| Freeable memory | Measures the amount of available RAM. | Average | Bytes |
| Free storage space | Measures the amount of available storage space. | Average | Bytes |
| Maximum used transaction IDs | The maximum transaction ID that has been used. Applicable to only PostgreSQL. | Average | Count |
| Network receive throughput | Measures the incoming (Receive) network traffic on the DB instance, includes both customer and Amazon RDS traffic. | Average | MB/sec |
| Network transmit throughput | Measures the outgoing(transmit) network traffic on the DB instance, includes both customer and Amazon RDS traffic. | Average | MB/sec |
| Oldest replication slot lag | Measures the size of the replica lagging the most in terms of WAL data received. | Average | Count |
| Read IOPS | Measures the number of disk I/O operations per second . | Average | Count/sec |
| Read latency | Measures the amount of time taken per disk I/O operation. | Average | Seconds |
| Read throughput | Measures the number of bytes read from disk per second. | Average | Bytes/sec |
| Replica lag | Measures the amount of time a Read Replica DB instance lags behind the source DB instance. | Average | Seconds |
| Swap usage | Measures the amount of swap space used. | Average | Bytes |
| Transaction logs disk usage | Measures the disk space used by transaction logs. Applicable to only PostgreSQL. | Average | MB |
| Transaction logs generation | Measures the size of transaction logs generated per second. Applicable to only PostgreSQL. | Average | Count |
| Write IOPS | Measures the average number of disk I/O operations. | Average | Count/sec |
| Write latency | Measures the average amount of time taken per disk I/O operation. | Average | Seconds |
| Write throughput | Measures the average number of bytes written to disk per second. | Average | Bytes/sec |
| EBS IO balance percentage | The percentage of I/O credits remaining in the burst bucket of your RDS database. | Average | Percentage |
| EBS byte balance percentage | The percentage of throughput credits remaining in the burst bucket of your RDS database. | Average | Percentage |
| Maximum used storage percentage | The percentage of maximum storage used out of the total allocated storage. | Average | Percentage |
| Memory Utilization | The percentage of total memory utilized in the RDS Instance. | Average | Percentage |
Amazon Aurora metrics
| Attribute | Description | Statistics | Data type |
|---|---|---|---|
| Active transactions | Measures the number of current transactions executing on an Aurora database instance. | Sum | Count |
| Aurora Binlog replica lag | Measures the amount of time a replica DB cluster running on Aurora with MySQL lags behind the source DB cluster. | Average | Milliseonds |
| Aurora replica lag | Measures the amount of lag when replicating updates. | Average | Millisecond |
| Aurora replica lag maximum | Measures the maximum amount of lag between the primary instance and each Aurora DB instance. | Average | Milliseconds |
| Aurora replica lag minimum | Measures the minimum amount of lag between the primary instance and each Aurora DB instance. | Average | Milliseconds |
| Blocked transactions | Measures the number of blocked transactions. | Sum | Count |
| Commit latency | Measures the latency for commit operations. | Average | Milliseconds |
| Commit throughput | Measures the number of commit operations per second. | Average | Count per second |
| DDL latency | Measures the latency for data definition language (DDL) requests. | Sum | Milliseconds |
| DDL throughput | Measures the number of DDL requests. | Sum | Count per second |
| Deadlocks | Measures the number of deadlocks in the database. | Sum | Count |
| Delete latency | Measures the of latency for delete queries. | Average | Milliseconds |
| Delete throughput | Measures the number of delete queries per second. | Average | Count per second |
| DML latency | Measures the amount of latency for inserts, updates, and deletes. | Average | Milliseconds |
| DML throughput | Measures the average number of inserts, updates, and deletes. | Average | Count per second |
| Engine uptime | Measures the amount of time that the instance has been running. | Average | Seconds |
| Free local storage | Measures the amount of storage available for temporary tables and logs. | Average | MB |
| Insert latency | Measures the amount of latency for insert queries. | Average | Milliseconds |
| Insert throughput | Measures the average number of insert queries. | Average | Count per second |
| Login failures | Measures the number of failed login attempts. | Sum | Count |
| Network throughput | Measures the amount of bytes both received from and transmitted to clients by each instance. | Average | Count per second |
| Queries | Measures the number of queries executed. | Average | Count per second |
| Result set cache hit ratio | Measures the number of requests that are served by the Resultset cache. | Average | Percentage |
| Select latency | Measures the amount of latency for select queries. | Average | Milliseconds |
| Select throughput | Measures the average number of select queries. | Average | Count per second |
| Update latency | Measures the amount of latency for update queries. | Average | Milliseconds |
| Update throughput | Measures the average number of update queries. | Average | Count per second |
| Volume bytes used | Measures the amount of storage used by your Aurora DB instance. | Average | MB |
| Volume read IOPs | Measures the number of billed read I/O operations from a cluster volume. | Sum | Count |
| Volume write IOPs | Measures the number of billed write I/O operations to a cluster volume. | Sum | Count |
| Serverless database capacity | Measures the Serverless Aurora database instance capacity. | Average | Count |
| Total backup storage billed | The total amount of billed backup storage. | Maximum | GB, Bytes |
| Snapshot storage used | Measures the amount of billed backup storage consumed snapshots. | Maximum | GB, Bytes |
| Backup retention period storage used | Measures the amount of billed backup storage used to support the point-in-time restore feature within backup retention window. | Maximum | GB, Bytes |
| Backtrack change records creation rate | Measures the number of backtrack change records created over time. | Average | Count |
| Backtrack change records stored | Measures the actual number of backtrack change records. | Average | Count |
| Backtrack window actual | Measures the difference between the target backtrack window and the actual backtrack window. | Average | Minutes |
| Backtrack window alert | Measures the number of times that the actual backtrack window is smaller than the target backtrack window. | Average | Count |
| Rollback segment history list length | The undo logs that record committed transactions with delete-marked records. These records are scheduled to be processed by the InnoDB purge operation. | Maximum | Count |
| Row lock time | The total time spent acquiring row locks for InnoDB tables. | Average | Milliseconds |
| Aurora DML Rejected Writer Full | The number of data manipulation language (DML) requests that were rejected because the writer instance was full. | Average | Count |
| Aurora Estimated Shared Memory Bytes | The estimated amount of shared memory in bytes used by the Aurora database instance. | Average | Bytes |
| Aurora Slow Connection Handle Count | The number of slow connection handles, which are connections that took a long time to be established. | Average | Count |
| Aurora Slow Handshake Count | The number of slow handshakes, which are initial connection attempts that took a long time to complete. | Average | Count |
| Aurora Volume Bytes Left Total | The total number of bytes left on the volume for storage. | Average | Bytes |
| Connection Attempts | The number of attempts to establish a connection to the Aurora database instance. | Average | Count |
| NumBinary Log Files | The number of binary log files currently in use by the Aurora database instance. | Average | Count |
| Storage Network Receive Throughput | The network throughput for data received by the storage layer. | Average | Bytes/Second |
| Storage Network Throughput | The overall network throughput of the storage layer. | Average | Bytes/Second |
| Storage Network Transmit Throughput | The network throughput for data transmitted by the storage layer. | Average | Bytes/Second |
| SumBinary Log Size | The total size of all binary log files currently in use. | Average | Bytes |
| Total IOPS | The total number of input/output operations per second (IOPS) for the Aurora database instance. | Average | Count |
| Aborted Clients | The number of aborted client connections to the Aurora database instance. | Average | Count |
| ACU Utilization | The utilization of Aurora capacity units (ACUs), which represent the amount of computational and memory resources used. | Average | Percentage |
| Temp Storage IOPS | The number of IOPS for temporary storage used by the Aurora database instance. | Average | Count |
| Temp Storage Throughput | The throughput for temporary storage used by the Aurora database instance. | Average | Bytes/Second |
Amazon Aurora Parallel Query metrics
| Attribute | Description | Statistics | Data type |
|---|---|---|---|
| Aurora Pq Request Attempted | The total number of attempts made to execute Aurora Parallel Query (PQ) requests. | Average | Count |
| Aurora Pq Request Failed | The total number of Aurora PQ requests that failed to execute successfully. | Average | Count |
| Aurora Pq Request In Progress | The current count of Aurora PQ requests that are actively being processed or are awaiting completion. | Average | Count |
| Aurora Pq Request Executed | The total number of Aurora PQ requests that have been successfully executed. | Average | Count |
| Aurora Pq Request Not Chosen | The number of Aurora PQ requests that were not selected for execution due to various reasons such as query complexity or system constraints. | Average | Count |
| Aurora Pq Request Not Chosen Below Min Rows | The count of Aurora PQ requests not chosen because they involve rows below a specified minimum threshold. | Average | Count |
| Aurora Pq Request Not Chosen Column Bit | The Aurora PQ requests not chosen due to columns with the BIT data type. | Average | Count |
| Aurora Pq Request Not Chosen Column Geometry | The Aurora PQ requests not chosen due to columns with the GEOMETRY data type. | Average | Count |
| Aurora Pq Request Not Chosen Column Lob | The Aurora PQ requests not chosen because they involve Large Object (LOB) columns. | Average | Count |
| Aurora Pq Request Not Chosen Column Virtual | The Aurora PQ requests not chosen due to columns with virtual attributes. | Average | Count |
| Aurora Pq Request Not Chosen Few Pages Outside Buffer Pool | The Aurora PQ requests not chosen because they access only a few pages outside the buffer pool. | Average | Count |
| Aurora Pq Request Not Chosen Full Text Index | The Aurora PQ requests not chosen due to their reliance on full text indexes. | Average | Count |
| Aurora Pq Request Not Chosen High Buffer Pool Pct | The Aurora PQ requests not chosen because they involve a high percentage of the buffer pool. | Average | Count |
| Aurora Pq Request Not Chosen Index Hint | The Aurora PQ requests not chosen due to the use of index hints. | Average | Count |
| Aurora Pq Request Not Chosen Innodb Table Format | The Aurora PQ requests not chosen due to InnoDB table format constraints. | Average | Count |
| Aurora Pq Request Not Chosen Instant Ddl | TheAurora PQ requests not chosen due to instant data definition language (DDL) operations. | Average | Count |
| Aurora Pq Request Not Chosen Long Trx | The Aurora PQ requests not chosen due to long running transactions. | Average | Count |
| Aurora Pq Request Not Chosen NoWhere Clause | The Aurora PQ requests not chosen due to the absence of a WHERE clause. | Average | Count |
| AuroraPq RequestNotChosenRangeScan | The Aurora PQ requests not chosen due to range scan constraints. | Average | Count |
| Aurora Pq Request Not Chosen Row Length Too Long | The Aurora PQ requests not chosen due to row length exceeding system defined limits. | Average | Count |
| Aurora Pq Request Not Chosen Small Table | The Aurora PQ requests not chosen because they involve small tables. | Average | Count |
| Aurora Pq Request Not Chosen Temporary Table | The Aurora PQ requests not chosen due to the use of temporary tables. | Average | Count |
| Aurora Pq Request Not Chosen Tx Isolation | The Aurora PQ requests not chosen due to transaction isolation level constraints. | Average | Count |
| Aurora Pq Request Not Chosen Unsupported Access | The Aurora PQ requests not chosen due to unsupported access methods. | Average | Count |
| Aurora Pq Request Not Chosen Unsupported Storage Type | The Aurora PQ requests not chosen due to unsupported storage types. | Average | Count |
| Aurora Pq Request Not Chosen Update Delete Stmts | The Aurora PQ requests not chosen due to the use of update or delete statements. | Average | Count |
| Aurora Pq Request Throttled Supported Amazon Aurora Forwarding Replica metrics | The Aurora PQ requests that were throttled due to system resource limitations or configured limits. | Average | Count |
Amazon Aurora Forwarding Replica metrics
| Attribute | Description | Statistics | Data type |
|---|---|---|---|
| Forwarding Replica DML Latency | The latency (response time) for data manipulation language (DML) operations (e.g., INSERT, UPDATE, DELETE) on forwarding replicas in Aurora. | Average | Milliseconds (ms) |
| Forwarding Replica DML Throughput | The rate of data manipulation language (DML) operations (e.g., INSERT, UPDATE, DELETE) processed by forwarding replicas in Aurora. | Average | Milliseconds (ms) |
| Forwarding Replica Open Sessions | The current count of open sessions (connections) to forwarding replicas in Aurora. | Average | Count |
| Forwarding Replica Read Wait Latency | The latency (response time) for read operations that are waiting for data from forwarding replicas in Aurora. | Average | Milliseconds (ms) |
| Forwarding Replica Read Wait Throughput | The rate of read operations that are waiting for data from forwarding replicas in Aurora. | Average | Count/second |
| Forwarding Replica Select Latency | The latency (response time) for SELECT queries executed on forwarding replicas in Aurora. | Average | Milliseconds (ms) |
| Forwarding Replica Select Throughput | The rate of SELECT queries executed on forwarding replicas in Aurora. | Average | Count/second |
| Forwarding Writer DML Latency | The latency (response time) for data manipulation language (DML) operations (e.g., INSERT, UPDATE, DELETE) on the forwarding writer node in Aurora. | Average | Milliseconds (ms) |
| Forwarding Writer DML Throughput | The rate of data manipulation language (DML) operations (e.g., INSERT, UPDATE, DELETE) processed by the forwarding writer node in Aurora. | Average | Count/second |
| Forwarding Writer Open Sessions |
The current number of active database connections (sessions) that are open on the forwarding writer instance. The forwarding writer handles write operations and forwards them to the primary instance, helping to offload some of the write load. |
Average | Count |
RDS Cluster
Site24x7's integration with Amazon RDS Cluster supports these metrics:
- Amazon RDS performance
- Amazon Aurora metrics
- Amazon Aurora Parallel Query metrics
- Amazon Aurora Forwarding Replica metrics
| Metric Name | Description | Statistics | Unit |
|---|---|---|---|
| Aurora Global DB DataTransfer Bytes | Amount of data moved between the primary and secondary AWS Regions. | Sum | Bytes |
| Aurora Global DB Progress Lag | Time taken for updates on the primary to be applied on the secondary. | Maximum | Milliseconds |
| Aurora Global DB Replicated Write IO | Number of write operations replicated from the primary to the secondary cluster. | Sum | Count |
| Aurora Global DB Replication Lag | Delay between a write on the primary cluster and its replication to the secondary cluster. | Maximum | Milliseconds |
| Aurora Global DB RPO Lag | Time gap between the latest transaction on the primary and what is safely replicated. | Maximum | Milliseconds |
| Aurora Memory Health State | Current memory health status reported by the cluster. | Maximum | Gauge |
| Aurora DML Rejected Master Full | Number of DML statements rejected because the master instance reached its limits. | Average | Count |
| Aurora Memory Number of Declined Sql Queries Total | Total number of SQL queries declined due to insufficient memory. | Sum | Count |
| Aurora Memory Number of Killed Connection Total | Total number of connections terminated because of low memory. | Sum | Count |
| Aurora Memory Number of Killed Queries Total | Total number of queries stopped because they could not run with the available memory. | Sum | Count |
| Aurora Milliseconds Spent in OOM Recovery | Time spent recovering from an out of memory state. | Maximum | Milliseconds |
| Aurora Number of Successful OOM Recovery | Count of successful recoveries from out of memory (OOM) conditions. | Average | Count |
| Aurora Number of Triggered OOM Recovery | Count of times the system entered out of memory recovery. | Average | Count |
| Aurora Optimized Reads Cache Hit Ratio | Percentage of reads served from the optimized read cache. | Average | Percentage |
| Write Throughput Ephemeral Storage | Rate at which data is written to ephemeral storage. | Average | Bytes per second |
| Purge Boundary | Current value that marks the purge boundary for stored data. | Average | Count |
| Purge Finished Point | Point up to which data purge has been completed. | Average | Count |
| Read IOPS Ephemeral Storage | Number of read operations on ephemeral storage each second. | Average | Count per second |
| Read Latency Ephemeral Storage | Time taken to complete read operations on ephemeral storage. | Average | Seconds |
| Read Throughput Ephemeral Storage | Rate at which data is read from ephemeral storage. | Average | Bytes per second |
| Transaction Age Maximum | Age of the oldest active transaction. | Maximum | Seconds |
| Truncate Finished Point | Highest point up to which truncation is completed. | Maximum | Count |
| Write IOPS Ephemeral Storage | Number of write operations on ephemeral storage each second. | Average | Count per second |
| Write Latency Ephemeral Storage | Time taken to complete write operations on ephemeral storage. | Average | Seconds |
| Free Ephemeral Storage | Amount of unused ephemeral storage available. | Average | Bytes |
| RDS to Aurora Postgre SQL Replica Lag | Delay between updates on the RDS primary and their replication to Aurora PostgreSQL. | Average | Seconds |
| CPU Utilization | Measures the percentage of CPU used. | Minimum, Maximum, and Average | Percentage |
| Database Connections | Measures the number of database connections in use. | Minimum, Maximum, and Average | Count |
| Freeable Memory | Measures the amount of available RAM. | Minimum, Maximum, and Average | Bytes |
| Serverless Database Capacity | Measures the Serverless Aurora database instance capacity. | Minimum, Maximum, and Average | Count |
Supported RDS Performance Insights metrics
OS General
| Metric Name | Description | Statistics | Unit |
|---|---|---|---|
| OS General Num VCPUs | The number of virtual CPUs configured for the DB instance. | Average | Count |
| OS General ACU Utilization | The average Aurora Capacity Units (ACU) utilization for the DB instance. | Average | Percentage |
| OS General Max Configured ACU | The maximum Aurora Capacity Units (ACU) configured for the DB instance. | Average | Percentage |
| OS General Min Configured ACU | The minimum Aurora Capacity Units (ACU) configured for the DB instance. | Average | Percentage |
| OS General Serverless Database Capacity | The capacity utilized by the serverless database instance. | Average | Percentage |
OS CPU Utilization
| Metric Name | Description | Statistics | Unit |
|---|---|---|---|
| CPU Utilization Guest Time | The amount of CPU time spent running a virtual processor under the hypervisor. | Average | Percentage |
| CPU Utilization Idle Time | The amount of CPU time when the CPU is not actively processing any tasks. | Average | Percentage |
| CPU Utilization IRQ Time | The amount of CPU time spent handling interrupts. | Average | Percentage |
| CPU Utilization Nice Time | The amount of CPU time spent on user processes with lower priority (nice). | Average | Percentage |
| CPU Utilization Steal Time | The amount of CPU time stolen from the instance by the hypervisor for other virtual machines. | Average | Percentage |
| CPU Utilization System Time | The amount of CPU time spent on system (kernel) processes. | Average | Percentage |
| CPU Utilization Total | The total CPU utilization across all CPUs. | Average | Percentage |
| CPU Utilization User Time | The amount of CPU time spent on user-level processes. | Average | Percentage |
| CPU Utilization I/O Wait Time | The amount of CPU time spent waiting for I/O operations to complete. | Average | Percentage |
| CPU Utilization Kernel Time | The percentage of time the CPU spends running the kernel. | Average | Percentage |
OS Disk IO
| Metric Name | Description | Statistics | Unit |
|---|---|---|---|
| Aurora Storage Bytes Received | Bytes received by Aurora storage from the instance. | Average | Bytes |
| Aurora Storage Bytes Transmitted | Bytes transmitted by Aurora storage to the instance. | Average | Bytes |
| Aurora Storage Disk Queue Depth | The length of aurora storage disk queue. | Average | Count |
| Aurora Storage Read IOPS | The number of read I/O operations seconds on Aurora storage. | Average | Seconds |
| Aurora Storage Read Latency | The latency of read operations on Aurora storage. | Average | Milliseconds |
| Aurora Storage Read Throughput | The throughput of read operations on Aurora storage. | Average | Bytes |
| Aurora Storage Write IOPS | The number of write I/O operations seconds on Aurora storage. | Average | Seconds |
| Aurora Storage Write Latency | The latency of write operations on Aurora storage. | Average | Milliseconds |
| Aurora Storage Write Throughput | The throughput of write operations on Aurora storage. | Average | Bytes |
| RDS Temp Disk I/O Average Queue Length | The average queue length for temporary storage in RDS. | Average | Count |
| RDS Temp Disk I/O Average Request Size | The average request size for temporary storage in RDS. | Average | KB |
| RDS Temp Disk I/O Average Wait Time | The average wait time for I/O operations on temporary storage in RDS. | Average | Milliseconds |
| RDS Temp Disk Read IOPS | The number of read I/O operations seconds on temporary storage in RDS. | Average | Seconds |
| RDS Temp Disk I/O Read KB | Kilobytes read from temporary storage in RDS. | Average | KB |
| RDS Temp Disk I/O Read KBps | Kilobytes read seconds from temporary storage in RDS. | Average | KB |
| RDS Temp Disk I/O Read Requests Merged Seconds | The number of read requests merged seconds in temporary storage in RDS. | Average | Seconds |
| RDS Temp Disk Transactions Seconds | Transactions seconds in temporary storage in RDS. | Average | Seconds |
| RDS Temp Disk Utilization | The percentage of utilization of temporary storage in RDS. | Average | Percentage |
| rdstemp.writeIOsPS | The number of write I/O operations seconds on temporary storage in RDS. | Average | Seconds |
| RDS Temp Disk Write IOPS | Kilobytes written to temporary storage in RDS. | Average | Seconds |
| RDS Temp Disk I/O Write KB | Kilobytes written seconds to temporary storage in RDS. | Average | Seconds |
| RDS Temp Disk I/O Write KBps | The number of write requests merged seconds in temporary storage in RDS. | Average | Seconds |
| Filesystem Disk I/O Average Queue Length | The average queue length for filesystem storage. | Average | Count |
| Filesystem Disk I/O Average Request Size | The average request size for filesystem storage. | Average | KB |
| Filesystem Disk I/O Average Wait Time | The average wait time for I/O operations on filesystem storage. | Average | Milliseconds |
| Filesystem Disk Read IOPS | The number of read I/O operations seconds on filesystem storage. | Average | Seconds |
| Filesystem Disk I/O Read KB | Kilobytes read from filesystem storage. | Average | KB |
| Filesystem Disk I/O Read KBps | Kilobytes read seconds from filesystem storage. | Average | KB |
| Filesystem Disk I/O Read Requests Merged Seconds | The number of read requests merged seconds in filesystem storage. | Average | Seconds |
| Filesystem Disk Transactions Seconds | The transactions seconds in filesystem storage. | Average | Seconds |
| Filesystem Utilization | The percentage of utilization of filesystem storage. | Average | Percentage |
| Filesystem Disk Write IOPS | The number of write I/O operations seconds on filesystem storage. | Average | Seconds |
| Filesystem Disk I/O Write KB | Kilobytes written to filesystem storage. | Average | Seconds |
| Filesystem Disk I/O Write KBps | Kilobytes written seconds to filesystem storage. | Average | Seconds |
| Filesystem Disk I/O Write Requests Merged Seconds | The number of write requests merged seconds in filesystem storage. | Average | Seconds |
| OS Diskio Nvme Avgqueue len (2N1) | The average queue length for NVMe (Non-Volatile Memory Express) device nvme2n1. | Average | Count |
| NVMe Disk I/O Average Request Size (2N1) | The average request size for NVMe device nvme2n1. | Average | KB |
| OS Diskio Nvme Await (2N1) | The average wait time for I/O operations on NVMe device nvme2n1. | Average | Milliseocnds |
| OS Diskio Nvme Readi osps (2N1) | The number of read I/O operations seconds on NVMe device nvme2n1. | Average | Seconds |
| NVMe Disk I/O Read KB (2N1) | Kilobytes read from NVMe device nvme2n1. | Average | KB |
| NVMe Disk I/O Read KBps (2N1) | Kilobytes read seconds from NVMe device nvme2n1. | Average | KB |
| NVMe Disk I/O Read Requests Merged Seconds (2N1) | The number of read requests merged seconds on NVMe device nvme2n1. | Average | Seconds |
| NVMe Disk Transactions Seconds (2N1) | Transactions seconds on NVMe device nvme2n1. | Average | Seconds |
| NVMe Disk Utilization (2N1) | The percentage of utilization of NVMe device nvme2n1. | Average | Percentage |
| NVMe Disk Write IOPS (2N1) | The number of write I/O operations seconds on NVMe device nvme2n1. | Average | Seconds |
| NVMe Disk I/O Write KB (2N1) | Kilobytes written to NVMe device nvme2n1. | Average | Seconds |
| NVMe Disk I/O Write KBps (2N1) | Kilobytes written seconds to NVMe device nvme2n1. | Average | Seconds |
| NVMe Disk I/O Write Requests Merged Seconds (2N1) | The number of write requests merged seconds on NVMe device nvme2n1. | Average | Seconds |
| rdsdev.avgQueueLen | The average queue length for RDS device storage. | Average | Count |
| RDS Device Disk I/O Average Queue Length | The average request size for RDS device storage. | Average | KB |
| RDS Device Disk I/O Average Request Size | The average wait time for I/O operations on RDS device storage. | Average | Milliseocnds |
| RDS Device Disk I/O Average Wait Time | The number of read I/O operations seconds on RDS device storage. | Average | Seconds |
| RDS Device Read IOPS | Kilobytes read from RDS device storage. | Average | KB |
| RDS Device Disk I/O Read KB | Kilobytes read seconds from RDS device storage. | Average | KB |
| RDS Device Disk I/O Read KBps | The number of read requests merged seconds on RDS device storage. | Average | Seconds |
| RDS Device Transactions Seconds | Transactions seconds on RDS device storage. | Average | Seconds |
| RDS Device Disk Utilization | The percentage of utilization of RDS device storage. | Average | Percentage |
| RDS Device Write IOPS | The number of write I/O operations seconds on RDS device storage. | Average | Seconds |
| RDS Device Disk I/O Write KB | Kilobytes written to RDS device storage. | Average | Seconds |
| RDS Device Disk I/O Write KBps | Kilobytes written seconds to RDS device storage. | Average | Seconds |
| RDS Device Disk I/O Write Requests Merged Seconds | The number of write requests merged seconds on RDS device storage. | Average | Seconds |
| OS Diskio Nvme Avgqueue len (1N1) | The average queue length for NVMe device nvme1n1. | Average | Count |
| NVMe Disk I/O Average Request Size (1N1) | The average request size for NVMe device nvme1n1. | Average | KB |
| NVMe 1N1 Disk I/O Average Wait Time (1N1) | The average wait time for I/O operations on NVMe device nvme1n1. | Average | Milliseocnds |
| OS Diskio Nvme Read iosps (1N1) | The number of read I/O operations seconds on NVMe device nvme1n1. | Average | Seconds |
| Os Diskio Nvme Readkb (1N1) | Kilobytes read from NVMe device nvme1n1. | Average | KB |
| NVMe Disk I/O Read KBps (1N1) | Kilobytes read seconds from NVMe device nvme1n1. | Average | KB |
| NVMe Disk I/O Read Requests Merged Seconds (1N1) | The number of read requests merged seconds on NVMe device nvme1n1. | Average | Seconds |
| NVMe Disk Transactions Seconds (1N1) | Transactions seconds on NVMe device nvme1n1. | Average | Seconds |
| NVMe Disk Utilization (1N1) | The percentage of utilization of NVMe device nvme1n1. | Average | Percentage |
| NVMe Disk Write IOPS (1N1) | The number of write I/O operations seconds on NVMe device nvme1n1. | Average | Seconds |
| NVMe Disk I/O Write KB (1N1) | Kilobytes written to NVMe device nvme1n1. | Average | Seconds |
| NVMe Disk I/O Write KBps (1N1) | Kilobytes written seconds to NVMe device nvme1n1. | Average | Seconds |
| NVMe Disk I/O Write Requests Merged Seconds (1N1) | The number of write requests merged seconds on NVMe device nvme1n1. | Average | Seconds |
| Average Queue Length (4N1)) | The average queue length for NVMe device nvme4n1. | Average | Count |
| NVMe Disk I/O Average Request Size (4N1) | The average request size for NVMe device nvme4n1. | Average | KB |
| OS Diskio Nvme Await (4N1) | The average wait time for I/O operations on NVMe device nvme4n1. | Average | Milliseconds |
| NVMe Disk I/O Read IOPS (4N1) | The number of read I/O operations seconds on NVMe device nvme4n1. | Average | Seconds |
| NVMe Disk I/O Read KB (4N1) | Kilobytes read from NVMe device nvme4n1. | Average | KB |
| NVMe Disk I/O Read KBps (4N1) | Kilobytes read seconds from NVMe device nvme4n1. | Average | KB |
| NVMe Disk I/O Read Requests Merged Seconds (4N1) | The number of read requests merged seconds on NVMe device nvme4n1. | Average | Seconds |
| NVMe Disk Transactions Seconds (4N1) | Transactions seconds on NVMe device nvme4n1. | Average | Seconds |
| NVMe Disk Utilization (4N1) | The percentage of utilization of NVMe device nvme4n1. | Average | Percentage |
| NVMe Disk Write IOPS(4N1) | The number of write I/O operations seconds on NVMe device nvme4n1. | Average | Seconds |
| NVMe Disk I/O Write KB (4N1) | Kilobytes written to NVMe device nvme4n1. | Average | Seconds |
| NVMe Disk I/O Write KBps (4N1) | Kilobytes written seconds to NVMe device nvme4n1. | Average | Seconds |
| NVMe Disk I/O Write Requests Merged Seconds (4N1) | The number of write requests merged seconds on NVMe device nvme4n1. | Average | Seconds |
| NVMe Disk I/O Average Queue Length (5N1) | The average queue length for NVMe device nvme5n1. | Average | Count |
| NVMe Disk I/O Average Request Size (5N1) | The average request size for NVMe device nvme5n1. | Average | KB |
| OS Diskio Nvme Await (5N1) | The average wait time for I/O operations on NVMe device nvme5n1. | Average | Milliseconds |
| NVMe Disk I/O Read IOPS (5N1) | The number of read I/O operations seconds on NVMe device nvme5n1. | Average | Seconds |
| NVMe Disk I/O Read KB (5N1) | Kilobytes read from NVMe device nvme5n1. | Average | KB |
| NVMe Disk I/O Read KBps (5N1) | Kilobytes read seconds from NVMe device nvme5n1. | Average | KB |
| NVMe Disk I/O Read Requests Merged Seconds(5N1) | The number of read requests merged seconds on NVMe device nvme5n1. | Average | Seconds |
| NVMe Disk Transactions Seconds(5N1) | Transactions seconds on NVMe device nvme5n1. | Average | Seconds |
| NVMe Disk Utilization(5N1) | The percentage of utilization of NVMe device nvme5n1. | Average | Percentage |
| NVMe Disk Write IOPS (5N1) | The number of write I/O operations seconds on NVMe device nvme5n1. | Average | Seconds |
| NVMe Disk I/O Write KB (5N1) | Kilobytes written to NVMe device nvme5n1. | Average | Seconds |
| NVMe Disk I/O Write KBps (5N1) | Kilobytes written seconds to NVMe device nvme5n1. | Average | Seconds |
| NVMe Disk I/O Write Requests Merged Seconds (5N1) | The number of write requests merged seconds on NVMe device nvme5n1. | Average | Seconds |
OS Filesys
| Metric Name | Description | Statistics | Unit |
|---|---|---|---|
| Filesystem Maximum Files | The maximum number of files that can be stored in the filesystem. | Average | Count |
| Filesystem Total Space | The total storage capacity of the filesystem. | Average | KB |
| Filesystem Used Space | The amount of storage used in the filesystem. | Average | KB |
| Filesystem Used File Percent | The percentage of file storage used in the filesystem. | Average | Percentage |
| Filesystem Used Files | The number of files currently in use in the filesystem. | Average | Count |
| Filesystem Used Percent | The percentage of total filesystem storage used. | Average | Percentage |
OS Load Average Minute
| Metric Name | Description | Statistics | Unit |
|---|---|---|---|
| Load Average (15 Minutes) | The system load average over the last 15 minutes. | Average | Count |
| Load Average (5 Minutes) | The system load average over the last five minutes. | Average | Count |
| Load Average (1 Minute) | The system load average over the last one minute. | Average | Count |
OS Memory
| Metric Name | Description | Statistics | Unit |
|---|---|---|---|
| Active Memory | The amount of active memory in use. | Average | KB |
| Memory Buffers | The memory used by buffers. | Average | KB |
| Cached Memory | The amount of cached memory. | Average | KB |
| Database Cache Memory | The amount of memory used by the database cache. | Average | Bytes |
| Database Resident Set Size | The amount of memory in the database resident set size. | Average | Bytes |
| Database Swap Memory | The amount of memory swapped by the database. | Average | Bytes |
| Dirty Memory | The amount of dirty memory. | Average | KB |
| Free Memory | The amount of free memory available. | Average | KB |
| Free Huge Pages | The number of free huge pages. | Average | Count |
| Reserved Huge Pages | The number of reserved huge pages. | Average | Count |
| Huge Pages Size | The size of huge pages. | Average | KB |
| Huge Pages Surplus | The number of surplus huge pages. | Average | Count |
| Total Huge Pages | The total number of huge pages. | Average | Count |
| Inactive Memory | The amount of inactive memory. | Average | KB |
| Mapped Memory | The amount of mapped memory. | Average | KB |
| Out of Memory Kill Count | The count of out-of-memory kill events. | Average | Count |
| Page Tables Memory | The memory used by page tables. | Average | KB |
| Slab Memory | The amount of memory used by the slab allocator. | Average | KB |
| Total Memory | The total memory available. | Average | KB |
| Writeback Memory | The amount of memory in writeback mode. | Average | KB |
| Memory Commit Limit (KB) | The memory commit limit in kilobytes. | Average | KB |
| Memory Commit Peak (KB) | The peak memory commit in kilobytes. | Average | KB |
| Memory Commit Total (KB) | The total memory commit in kilobytes. | Average | KB |
| Kernel Non-Paged Memory (KB) | The non-paged kernel memory in kilobytes. | Average | KB |
| Kernel Paged Memory (KB) | The paged kernel memory in kilobytes. | Average | KB |
| Kernel Total Memory (KB) | The total kernel memory in kilobytes. | Average | KB |
| Memory Page Size | The memory page size. | Average | Bytes |
| Physical Available Memory (KB) | The available physical memory in kilobytes. | Average | KB |
| Physical Total Memory (KB) | The total physical memory in kilobytes. | Average | KB |
| SQL Server Total Memory (KB) | The total memory used by SQL Server in kilobytes. | Average | KB |
| System Cache Memory (KB) | The system cache memory in kilobytes. | Average | KB |
OS Network
| Metric Name | Description | Statistics | Unit |
|---|---|---|---|
| Network Receive | The network receive data in packets per second. | Average | Bytes |
| Network Transmit | The network transmit data in packets per second. | Average | Bytes |
| Network Read Bytes Per Second | The network read bytes per second. | Average | Bytes |
| Network Write Bytes Per Second | The network write bytes per second. | Average | Bytes |
OS Swap
| Metric Name | Description | Statistics | Unit |
|---|---|---|---|
| Cached Swap | The amount of swap space that is cached. | Average | KB |
| Free Swap | The amount of free swap space. | Average | KB |
| Swap In | The number of swap-in operations per second. | Average | KB |
| Swap Out | The number of swap-out operations per second. | Average | KB |
| Total Swap | The total amount of swap space. | Average | KB |
OS Tasks
| Metric Name | Description | Statistics | Unit |
|---|---|---|---|
| Blocked Tasks | The number of tasks that are blocked. | Average | Count |
| Running Tasks | The number of tasks currently running. | Average | Count |
| Sleeping Tasks | The number of tasks that are sleeping. | Average | Count |
| Stopped Tasks | The number of tasks that are stopped. | Average | Count |
| Total Tasks | The total number of tasks. | Average | Count |
| Zombie Tasks | The number of zombie tasks. | Average | Count |
OS DB SQL Tokenized
| Metric Name | Description | Statistics | Unit |
|---|---|---|---|
| Calls Per Second | The number of SQL calls executed per second. | Average | Count per second |
| Rows Per Second | The number of rows processed per second. | Average | Count per second |
| Total Time Per Second | The total time spent per second in executing SQL calls. | Average | Count per second |
| Shared Blocks Hit Per Second | The number of shared blocks hit per second. | Average | Count per second |
| Shared Blocks Read Per Second | The number of shared blocks read per second. | Average | Count per second |
| Shared Blocks Dirtied Per Second | The number of shared blocks dirtied per second. | Average | Count per second |
| Shared Blocks Written Per Second | The number of shared blocks written per second. | Average | Count per second |
| Local Blocks Hit Per Second | The number of local blocks hit per second. | Average | Count per second |
| Local Blocks Read Per Second | The number of local blocks read per second. | Average | Count per second |
| Local Blocks Dirtied Per Second | The number of local blocks dirtied per second. | Average | Count per second |
| Local Blocks Written Per Second | The number of local blocks written per second. | Average | Count per second |
| Local Block Read Time Per Second | The time spent reading local blocks per second. | Average | Read per second |
| Temporary Blocks Written Per Second | The number of temporary blocks written per second. | Average | Count per second |
| Temporary Blocks Read Per Second | The number of temporary blocks read per second. | Average | Count per second |
| Oracle Cache Blocks Hit Per Second | The number of Oracle cache blocks hit per second. | Average | Count per second |
| Oracle Cache Block Read Time Per Second | The time spent reading Oracle cache blocks per second. | Average | Count per second |
| Storage Blocks Read Per Second | The time number of storage blocks read per second. | Average | Count per second |
| Storage Block Read Time Per Second | The time spent reading storage blocks per second. | Average | Count per second |
| Block Read Time Per Second | The time spent reading blocks per second. | Average | Count per second |
| Block Write Time Per Second | The time spent writing blocks per second. | Average | Count per second |
| Rows Per Call | The number of rows processed per call. | Average | Count |
| Average Latency Per Call | The average latency per SQL call. | Average | Millisecond |
| Shared Blocks Hit Per Call | The number of shared blocks hit per SQL call. | Average | Count |
| Shared Blocks Read Per Call | The number of shared blocks read per SQL call. | Average | Count |
| Shared Blocks Written Per Call | The number of shared blocks written per SQL call. | Average | Count |
| Shared Blocks Dirtied Per Call | The number of shared blocks dirtied per SQL call. | Average | Count |
| Local Blocks Hit Per Call | The number of local blocks hit per SQL call. | Average | Count |
| Local Blocks Read Per Call | The number of local blocks read per SQL call. | Average | Count |
| Local Blocks Dirtied Per Call | The number of local blocks dirtied per SQL call. | Average | Count |
| Local Blocks Written Per Call | The number of local blocks written per SQL call. | Average | Count |
| Local Block Read Time Per Call | Time spent reading local blocks per SQL call. | Average | Count |
| Temporary Blocks Written Per Call | The number of temporary blocks written per SQL call. | Average | Count |
| Temporary Blocks Read Per Call | The number of temporary blocks read per SQL call. | Average | Count |
| Oracle Cache Blocks Hit Per Call | The number of Oracle cache blocks hit per SQL call. | Average | Count |
| Oracle Cache Block Read Time Per Call | Time spent reading Oracle cache blocks per SQL call. | Average | Count |
| Storage Blocks Read Per Call | The number of storage blocks read per SQL call. | Average | Count |
| Storage Block Read Time Per Call | Time spent reading storage blocks per SQL call. | Average | Count |
| Block Read Time Per Call | Time spent reading blocks per SQL call. | Average | Count |
| Block Write Time Per Call | Time spent writing blocks per SQL call. | Average | Count |
| Count Star Per Second | The count of start * queries per second. | Average | Count per second |
| Sum of Timer Wait Per Second | The sum of wait time per second for queries. | Average | Count per second |
| Sum of Select Full Join Per Second | The sum of full join operations per second. | Average | Count per second |
| Sum of Select Range Check Per Second | The sum of range checks per second. | Average | Count per second |
| Sum of Select Scan Per Second | The sum of select scan operations per second. | Average | Count per second |
| Sum of Sort Merge Passes Per Second | The sum of sort merge passes per second. | Average | Count per second |
| Sum of Sort Scan Per Second | The sum of sort scans per second. | Average | Count per second |
| Sum of Sort Range Per Second | The sum of sort range operations per second. | Average | Count per second |
| Sum of Sort Rows Per Second | The sum of rows sorted per second. | Average | Count per second |
| Sum of Rows Affected Per Second | The sum of rows affected per second. | Average | Count per second |
| Sum of Rows Examined Per Second | The sum of rows examined per second. | Average | Count per second |
| Sum of Rows Sent Per Second | The sum of rows sent per second. | Average | Count per second |
| Sum of Created Temporary Disk Tables Per Second | The sum of temporary disk tables created per second. | Average | Count per second |
| Sum of Created Temporary Tables Per Second | The sum of temporary tables created per second. | Average | Count per second |
| Sum of Lock Time Per Second | The sum of lock time per second. | Average | Count per second |
| Sum of Timer Wait Per Call | The sum of wait time per SQL call. | Average | Millisecond |
| Sum of Select Full Join Per Call | The sum of full join operations per SQL call. | Average | Count |
| Sum of Select Range Check Per Call | The sum of range checks per SQL call. | Average | Count |
| Sum of Select Scan Per Call | The sum of select scan operations per SQL call. | Average | Count |
| Sum of Sort Merge Passes Per Call | The sum of sort merge passes per SQL call. | Average | Count |
| Sum of Sort Scan Per Call | The sum of sort scans per SQL call. | Average | Count |
| Sum of Sort Range Per Call | The sum of sort range operations per SQL call. | Average | Count |
| Sum of Sort Rows Per Call | The sum of rows sorted per SQL call. | Average | Count |
| Sum of Rows Affected Per Call | The sum of rows affected per SQL call. | Average | Count |
| Sum of Rows Examined Per Call | The sum of rows examined per SQL call. | Average | Count |
| Sum of Rows Sent Per Call | The sum of rows sent per SQL call. | Average | Count |
| Sum of Created Temporary Disk Tables Per Call | The sum of temporary disk tables created per SQL call. | Average | Count |
| Sum of Created Temporary Tables Per Call | The sum of temporary tables created per SQL call. | Average | Count |
| Sum of Lock Time Per Call | The sum of lock time per SQL call. | Average | Count |
| Execution Count Per Second | The number of executions per second. | Average | Count per second |
| Total Elapsed Time Per Second | The total elapsed time per second for SQL executions. | Average | Count per second |
| Total Rows Per Second_sec | The total number of rows processed per second. | Average | Count per second |
| Total Logical Reads Per Second | The total logical reads per second. | Average | Count per second |
| Total Logical Writes Per Second | The total logical writes per second. | Average | Count per second |
| Total Physical Reads Per Second | The total physical reads per second. | Average | Count per second |
| Total Worker Time Per Second | The total worker time per second for SQL executions. | Average | Count per second |
| Total Elapsed Time Per Call | The total elapsed time per SQL call. | Average | Count |
| Total Rows Per Call | The total number of rows processed per SQL call. | Average | Count |
| Total Logical Reads Per Call | The total logical reads per SQL call. | Average | Count |
| Total Logical Writes Per Call | The total logical writes per SQL call. | Average | Count |
| Total Physical Reads Per Call | The total physical reads per SQL call. | Average | Count |
| Total Worker Time Per Call | The total worker time per SQL call. | Average | Count |
| Execution Plan Count | The number of execution plans generated. | Average | Count |
| Executions Per Second | The number of SQL executions per second. | Average | Count per second |
| Elapsed Time Per Second | The elapsed time per second for SQL executions. | Average | Elapsed time per second |
| Rows Processed Per Second | The number of rows processed per second in SQL executions. | Average | Count per second |
| Buffer Gets Per Second | The number of buffer gets per second during SQL executions. | Average | Count per second |
| Physical Read Requests Per Second | The number of physical read requests per second during SQL executions. | Average | Count per second |
| Physical Write Requests Per Second | The number of physical write requests per second during SQL executions. | Average | Count per second |
| Total Sharable Memory Per Second | The total shareable memory used per second during SQL executions. | Average | Count per second |
| CPU Time Per Second | The total CPU time used per second during SQL executions. | Average | Count per second |
| Elapsed Time Per Execution | The elapsed time per SQL execution. | Average | Count |
| Rows Processed Per Execution | The number of rows processed per SQL execution. | Average | Count |
| Buffer Gets Per Execution | The number of buffer gets per SQL execution. | Average | Count |
| Physical Read Requests Per Execution | The number of physical read requests per SQL execution. | Average | Count |
| Physical Write Requests Per Execution | The number of physical write requests per SQL execution. | Average | Count |
| Total Sharable Memory Per Execution | The total shareable memory used per SQL execution. | Average | Count |
| CPU Time Per Execution | The total CPU time used per SQL execution. | Average | Count |
DB Cache
| Metric Name | Description | Statistics | Unit |
|---|---|---|---|
| Blocks Hit | The number of blocks hit in the cache. | Average | Blocks per second |
| Buffers Allocated | The number of buffers allocated in the cache. | Average | Blocks per second |
| InnoDB Buffer Pool Reads | The number of reads from the InnoDB buffer pool. | Average | Pages per second |
| InnoDB Buffer Pool Read Requests | The number of read requests from the InnoDB buffer pool. | Average | Pages per second |
| InnoDB Buffer Pool Pages Data | The number of data pages in the InnoDB buffer pool. | Average | Count |
| InnoDB Buffer Pool Pages Total | The total number of pages in the InnoDB buffer pool. | Average | Count |
| Opened Tables | The number of tables opened in the cache. | Average | Count |
| Opened Table Definitions | The number of table definitions opened in the cache. | Average | Count |
| InnoDB Buffer Pool Hit Rate | The number of hits in the InnoDB buffer pool. | Average | Pages per second |
| InnoDB Buffer Pool Hits | The hit rate percentage of the InnoDB buffer pool. | Average | Percentage |
| InnoDB Buffer Pool Usage | The usage percentage of the InnoDB buffer pool. | Average | Percentage |
| Query Cache Hits | The number of query cache hits. | Average | Count |
| Query Cache Hit Rate | The hit rate percentage of the query cache. | Average | Percentage |
| Physical Read Bytes | The number of physical bytes read. | Average | Bytes |
| Database Block Gets | The number of database block gets. | Average | Count |
| Database Writer Checkpoints | The number of database writer (DBWR) checkpoints. | Average | Count |
| Physical Reads | The number of physical reads. | Average | Count |
| Consistent Gets From Cache | The number of consistent gets from the cache. | Average | Count |
| Database Block Gets From Cache | The number of database block gets from the cache. | Average | Count |
| Consistent Gets | The number of consistent gets. | Average | Count |
DB Checkpoint
| Metric Name | Description | Statistics | Unit |
|---|---|---|---|
| Buffers Checkpoint | The number of buffers written to disk during a checkpoint. | Average | Blocks per second |
| Checkpoint Sync Time | The time taken to synchronize during a checkpoint. | Average | Milliseconds per checkpoint |
| Checkpoint Write Time | The time taken to write data during a checkpoint. | Average | Milliseconds per checkpoint |
| Requested Checkpoints | The number of requested checkpoints. | Average | Checkpoints per minute |
| Timed Checkpoints | The number of timed checkpoints. | Average | Checkpoints per minute |
| Max Written Clean | The number of buffers written by the clean writer during a checkpoint. | Average | Bgwriter clean stops per minute |
| Checkpoint Sync Latency | The latency of synchronization during a checkpoint. | Average | Milliseconds per checkpoint |
| Checkpoint Write Latency | The latency of writing during a checkpoint. | Average | Milliseconds per checkpoint |
DB Concurrency
| Metric Name | Description | Statistics | Unit |
|---|---|---|---|
| Deadlocks | The number of deadlocks detected. | Average | Deadlocks per minute |
DB IO
| Metric Name | Description | Statistics | Unit |
|---|---|---|---|
| Block Read Time | Time spent reading blocks from the database. | Average | Milliseconds |
| Blocks Read | Number of blocks read from the database. | Average | Blocks per second |
| Buffers Backend | Number of buffers allocated by the backend. | Average | Blocks per second |
| Buffers Backend Fsync | Number of fsync operations by the backend. | Average | Blocks per second |
| Storage Blocks Read | Number of buffers cleaned by the background writer. | Average | Blocks per second |
| Storage Block Read Time | Number of storage blocks read. | Average | Blocks per second |
| Oracle Cache Blocks Hit | Number of blocks hit in the Oracle cache. | Average | Blocks per second |
| Oracle Cache Block Read Time | Time spent reading blocks from Oracle cache. | Average | Milliseconds |
| Local Blocks Read | Number of local blocks read. | Average | Blocks per second |
| Local Block Read Time | Time spent reading local blocks. | Average | Milliseconds |
| InnoDB Pages Written | Number of InnoDB pages written to disk. | Average | Pages per second |
| InnoDB Data Writes | Number of data writes in InnoDB. | Average | Operations per second |
| InnoDB Log Writes | Number of log writes in InnoDB. | Average | Operations per second |
| InnoDB Log Write Requests | Number of log write requests in InnoDB. | Average | Operations per second |
| InnoDB Double Writes | Number of double write operations in InnoDB. | Average | Operations per second |
| InnoDB Datafile Writes to Disk | Number of datafile write operations to disk in InnoDB. | Average | Operations per second |
DB SQL
| Metric Name | Description | Statistics | Unit |
|---|---|---|---|
| Tuples Deleted | Number of tuples (rows) deleted. | Average | Tuples per second |
| Tuples Fetched | Number of tuples (rows) fetched. | Average | Tuples per second |
| Tuples Inserted | Number of tuples (rows) inserted. | Average | Tuples per second |
| Tuples Returned | Number of tuples (rows) returned. | Average | Tuples per second |
| Tuples Updated | Number of tuples (rows) updated. | Average | Tuples per second |
| Queries Started | Number of queries started. | Average | Queries per second |
| Queries Finished | Number of queries finished. | Average | Queries per second |
| Total Query Time | Total time spent executing queries. | Average | Milliseconds |
| Logical Reads | Number of logical reads from the database. | Average | Blocks per second |
| COM Analyze | Number of analyze commands executed. | Average | Queries per second |
| COM Optimize | Number of optimize commands executed. | Average | Queries per second |
| InnoDB Rows Inserted | Number of select queries executed. | Average | Queries per second |
| InnoDB Rows Deleted | Number of rows inserted in InnoDB. | Average | Rows per second |
| db.sql.Innodb_rows_deleted | Number of rows deleted in InnoDB. | Average | Rows per second |
| InnoDB Rows Updated | Number of rows updated in InnoDB. | Average | Rows per second |
| db.sql.Innodb_rows_read | Number of rows read in InnoDB. | Average | Rows per second |
| InnoDB Rows Read | Number of questions (queries) sent to the server. | Average | Queries per second |
| Queries | Number of queries executed. | Average | Queries per second |
| Select Full Join | Number of full joins in select queries. | Average | Queries per second |
| Select Full Range Join | Number of full range joins in select queries. | Average | Queries per second |
| Select Range | Number of range select queries. | Average | Queries per second |
| Select Range Check | Number of range check queries in select. | Average | Queries per second |
| Select Scan | Number of table scans in select queries. | Average | Queries per second |
| Slow Queries | Number of slow queries executed. | Average | Queries per second |
| Sort Merge Passes | Number of merge passes in sorting. | Average | Queries per second |
| Sort Range | Number of range sorts. | Average | Queries per second |
| Sort Rows | Number of rows sorted. | Average | Queries per second |
| Sort Scan | Number of scan sorts. | Average | Queries per second |
| Total Query Time | Total time spent on queries. | Average | Milliseconds |
| InnoDB Rows Changed | Number of rows changed in InnoDB. | Average | Rows per second |
| Parse Count Total | Total number of parses executed. | Average | Count |
| Parse Count Hard | Number of hard parses executed. | Average | Count |
| Table Scan Rows Gotten | Number of rows obtained from table scans. | Average | Count |
| Sorts in Memory | Number of sorts performed in memory. | Average | Count |
| Sorts on Disk | Number of sorts performed on disk. | Average | Count |
| Sorts Rows | Number of rows sorted. | Average | Count |
DB Temp
| Metric Name | Description | Statistics | Unit |
|---|---|---|---|
| Temporary Bytes | Total bytes used by temporary files. | Average | Bytes |
| Temporary Files | Number of temporary files created. | Average | Files per minute |
| Created Temporary Disk Tables | Number of temporary disk tables created. | Average | Tables per second |
| Created Temporary Tables | Number of temporary tables created. | Average | Tables per second |
| Temporary Disk Tables Percent | Percentage of temporary tables created on disk. | Average | Percentage |
DB Transactions
| Metric Name | Description | Statistics | Unit |
|---|---|---|---|
| Blocked Transactions | Number of transactions currently blocked. | Average | Count |
| Maximum Used Transaction IDs | Maximum used transaction IDs. | Average | Count |
| Transaction Commits | Total number of transaction commits. | Average | Commits per second |
| dTransaction Rollbacks | Total number of transaction rollbacks. | Average | Rollbacks per second |
| Duration of Commits | Duration of transaction commits. | Average | Milliseconds |
| Commit Latency | Latency of transaction commits. | Average | Milliseconds per Transaction |
| Active Transactions | Number of currently active transactions. | Average | Count |
| Transaction Rollback Segment History Length | Length of the transaction rollback segment history. | Average | Count |
DB User
| Metric Name | Description | Statistics | Unit |
|---|---|---|---|
| Number of Backends | Number of active backends for the user. | Average | Count |
| Total Authentication Attempts | Total number of authentication attempts by the user. | Average | Count |
| Maximum Connections | Maximum number of connections allowed for the user. | Average | Count |
| CPU Used by This Session | CPU usage by the current user session. | Average | Count |
| SQL Net Roundtrips to/from Client | Number of SQL*Net round trips to/from the client. | Average | Count |
| Bytes Received via SQL Net from Client | Bytes received from the client via SQL*Net. | Average | Bytes |
| User Commits | Number of commits made by the user. | Average | Count |
| Cumulative Logons | Total cumulative logons by the user. | Average | Count |
| User Calls | Total number of calls made by the user. | Average | Count |
| Bytes Sent via SQL Net to Client | Bytes sent to the client via SQL*Net. | Average | Bytes |
| User Rollbacks | Number of rollbacks made by the user. | Average | Count |
DB Wal
| Metric Name | Description | Statistics | Unit |
|---|---|---|---|
| WAL Archived Count | Total number of Write-Ahead Logs archived. | Average | Files per minute |
| WAL Archive Failed Count | Total number of failed Write-Ahead Log archive attempts. | Average | Files per minute |
DB State
| Metric Name | Description | Statistics | Unit |
|---|---|---|---|
| Active Count | Number of active database connections. | Average | Count |
| Idle Count | Number of idle database connections. | Average | Count |
| Idle in Transaction Count | Number of idle connections in a transaction. | Average | Count |
| Idle in Transaction Aborted Counton_aborted_count | Number of idle connections in an aborted transaction. | Average | Count |
| Idle in Transaction Max Time | Maximum time a connection has been idle in a transaction. | Average | Count |
DB Locks
| Metric Name | Description | Statistics | Unit |
|---|---|---|---|
| InnoDB Row Lock Time | Time spent waiting for InnoDB row locks. | Average | Milliseconds |
| InnoDB Row Lock Waits | Number of waits for InnoDB row locks. | Average | Count |
| InnoDB Deadlocks | Number of InnoDB deadlocks. | Average | Deadlocks per minute |
| InnoDB Lock Timeouts | Number of InnoDB lock timeouts. | Average | Count |
| Table Locks Immediate | Number of immediate table locks. | Average | Requests per Second |
| Table Locks Waited | Number of table locks that had to wait. | Average | Requests per Second |
| Total Number of Deadlocks | Total number of deadlocks across the database. | Average | Count |
DB Users
| Metric Name | Description | Statistics | Unit |
|---|---|---|---|
| User Connections | Total number of user connections. | Average | Count |
| Maximum Connections | Maximum number of allowed user connections. | Average | Count |
| Aborted Clients | Number of connections aborted by clients. | Average | Count |
| Aborted Connects | Number of failed connection attempts. | Average | Count |
| Threads Running | Number of currently running threads. | Average | Count |
| Threads Created | Total number of created threads. | Average | Count |
| Threads Connected | Number of currently connected threads. | Average | Count |
OS System
| Metric Name | Description | Statistics | Unit |
|---|---|---|---|
| System Handles | Number of system handles in use. | Average | Count |
| System Processes | Number of running system processes. | Average | Count |
| System Threads | Number of active system threads. | Average | Count |
DB Access Methods
| Metric Name | Description | Statistics | Unit |
|---|---|---|---|
| Access Methods Page Splits | Number of page splits occurring in the database. | Average | Count |
| Access Methods Forwarded Records | Number of forwarded records in the database. | Average | Count |
OS Disks
| Metric Name | Description | Statistics | Unit |
|---|---|---|---|
| Available Kilobytes | Available disk space in kilobytes. | Average | KB |
| Available Percent | Available disk space as a percentage. | Average | Percentage |
| Read Bytes per Second | Disk read bytes per second. | Average | Bytes write/s |
| Read Count per Second | Disk read count per second. | Average | Count |
| Total Kilobytes | Total disk space in kilobytes. | Average | KB |
| Used Kilobytes | Used disk space in kilobytes. | Average | KB |
| Used Percent | Used disk space as a percentage. | Average | Percentage |
| Write Bytes per Second | Disk write bytes per second. | Average | Bytes write/s |
| Write Count per Second | Disk write count per second. | Average | Count |
DB Databases
| Metric Name | Description | Statistics | Unit |
|---|---|---|---|
| Total Active Transactions | Total number of active transactions. | Average | Count |
| Total Active Transactions | Total log bytes flushed. | Average | Count |
| Total Log Flush Waits | Total number of log flush waits. | Average | Count |
| Total Log Flushes | Total number of log flushes. | Average | Count |
| Total Log Flushes | Total number of write transactions. | Average | Count |
DB General Statistics
| Metric Name | Description | Statistics | Unit |
|---|---|---|---|
| Blocked Processes | Total number of processes currently blocked. | Average | |
| User Connections | Total number of user connections. | Average |
DB Latches
| Metric Name | Description | Statistics | Unit |
|---|---|---|---|
| Latch Waits | Total number of latch waits. | Average | Count |
DB Memory Manager
| Metric Name | Description | Statistics | Unit |
|---|---|---|---|
| Memory Manager Memory Grants Pending | Number of memory grants that are pending. | Average | Count |
DB SQL Statistics
| Metric Name | Description | Statistics | Unit |
|---|---|---|---|
| Batch Requests | Total number of batch requests. | Average | Count |
| SQL Compilations | Number of SQL compilations. | Average | Count |
| SQL Re-Compilations | Number of SQL re-compilations. | Average | Count |
DB Buffer Manager
| Metric Name | Description | Statistics | Unit |
|---|---|---|---|
| Page Life Expectancy | Average number of seconds a page stays in the buffer pool. | Average | Count |
| Buffer Cache Hit Ratio | Percentage of page requests satisfied by the buffer cache. | Average | Count |
| Page Lookups | Total number of page lookups. | Average | Count |
| Page Reads | Total number of pages read from disk. | Average | Count |
| Page Writes | Total number of pages written to disk. | Average | Count |
DB SQL Queries
| Metric Name | Description | Statistics | Unit |
|---|---|---|---|
| Execution Count per Second | Total number of SQL executions per second. | Average | Count per second |
| Total Elapsed Time per Second | Total elapsed time for SQL executions per second. | Average | Seconds |
| Total Rows per Second | Total number of rows processed per second. | Average | Count per second |
| Total Logical Reads per Second | Total logical reads per second. | Average | Count per second |
| Total Logical Writes per Second | Total logical writes per second. | Average | Count per second |
| Total Physical Reads per Second | Total physical reads per second. | Average | Count per second |
| Total Worker Time per Second | Total worker time per second. | Average | Count per second |
| Total Elapsed Time per Call | Total elapsed time per call. | Average | Count |
| Total Rows per Call | Total number of rows processed per call. | Average | Count |
| Total Logical Reads per Call | Total logical reads per call. | Average | Count |
| Total Logical Writes per Call | Total logical writes per call. | Average | Count |
| Total Physical Reads per Call | Total physical reads per call. | Average | Count |
| Total Worker Time per Call | Total worker time per call. | Average | Count |
| Execution Plan Count | Total number of execution plans. | Average | Count |
| Executions per Second | Total number of executions per second. | Average | Count per second |
| Elapsed Time per Second | Elapsed time per second. | Average | Count per second |
| Rows Processed per Second | Rows processed per second. | Average | Count per second |
| Buffer Gets per Second | Total buffer gets per second. | Average | Count per second |
| Physical Read Requests per Second | Total physical read requests per second. | Average | Count per second |
| Physical Write Requests per Second | Total physical write requests per second. | Average | Count per second |
| Total Sharable Memory per Second | Total sharable memory per second. | Average | Count per second |
| CPU Time per Second | CPU time used per second. | Average | Count per second |
| Elapsed Time per Execution | Elapsed time per execution. | Average | Count |
| Rows Processed per Execution | Rows processed per execution. | Average | Count |
| Buffer Gets per Execution | Buffer gets per execution. | Average | Count |
| Physical Read Requests per Execution | Physical read requests per execution. | Average | Count |
| Physical Write Requests per Execution | Physical write requests per execution. | Average | Count |
| Total Sharable Memory per Execution | Total sharable memory per execution. | Average | Count |
| CPU Time per Execution | CPU time used per execution. | Average | Count |
DB Redo
| Metric Name | Description | Statistics | Unit |
|---|---|---|---|
| Redo Size | Total size of redo logs. | Average | Bytes |
Configuration details
| Attribute | Description |
|---|---|
| Instance identifier | Shows the unique identifier of the DB instance. |
| Instance class | Shows the RDS DB instance class. |
| vCPUs | Displays the number of virtual cores for the DB instance type. |
| Memory | Displays the memory capacity of the RDS instance type. |
| Allocated storage space | Displays the allocated storage capacity for your instance type. |
| Creation time | Shows the time when the DB instance was created. |
| Engine name | Shows the name of the DB engine. |
| Engine version | Shows the default version of the specified Db engine. |
| Master username | Shows the RDS database master username. |
| Database name | Shows the name of the default database. |
| Region | The region where the DB instance is deployed. |
| Availability zone | The Availability zone where the replicas are deployed. |
| VPC ID | The ID of the Virtual Private Cloud where the DB instance is deployed. |
| Security groups | Displays the name of the security groups assigned to the DB instance. |
| Endpoint address | Shows the connection endpoint for the database. |
| Endpoint port | Shows the port number on which the database accepts connections. |
| Multiple deployment | Shows whether the DB instacne is part of a multi AZ deployment or not. |
| Preferred back up window | Displays the prefered back up windows configured during DB instance creation. |
| Latest restorable time | Shows the latest restorable time of the DB instance. |
| Back up retention period | Displays the backup retention period for the DB instance. |
| Preferred maintenance window | Displays the prefered maintenance window for the DB cluster. |
See how you can configure a threshold profile for your monitored RDS instances.
Forecast
Estimate future values of the following performance metrics and make informed decisions about adding capacity or scaling your AWS infrastructure.
- CPU Utilization
- Free Storage Space
- Freeable Memory
- Swap Usage
- Bin Log Disk Usage
- Burst Balance
- Disk Queue Depth
- Transaction Logs Disk Usage
- CPU Credit Usage
- CPU Credit Balance
- CPU Surplus Usage
- CPU Surplus Balance
- Aurora Bin Log
- Free Local Storage
- Volume Read IOPs
- Volume Write IOPs
- Memory Utilization
Licensing
- RDS Instance: Each Amazon RDS Instance monitor utilizes one basic monitor license.
- RDS Performance Insights: Each RDS Performance Insights monitor utilizes one advanced monitor license.
- Amazon RDS Cluster: Each Amazon RDS Cluster monitor utilizes one basic monitor license.
Monitor data
Amazon RDS Instance
You can view your Amazon RDS Instance monitor data on the following tabs:
RDS Instance Information
The RDS Instance Information tab provides an overview of the Events Timeline and metrics in the form of charts.
Aurora DB metrics
View real-time performance metrics for Amazon RDS Aurora, such as Aurora Parallel Query Request, Forwarding Writer Performance, and Aurora capacity unit (ACU) metrics.
Topology View
The Topology View tab delivers a live, resource-centric dependency map. It dynamically traces how your RDS Instance resource is connected to its surrounding AWS infrastructure in real time, enabling faster root cause isolation when alerts fire. If any connected component is in a Critical state, it is marked accordingly within the topology view, along with the outage reason, so you can pinpoint the exact failure point without needing to navigate away from the monitor page. Unlike account-wide topology views, this tab scopes visualization to a single resource, answering the precise question: What does this RDS Instance resource connect to, and what breaks if it does?You can trace the full dependency chain from the individual resource up through its primary parent entities to the Service type, Region, and AWS account levels.
Zia Forecast
The Zia Forecast tab displays the forecast chart with future points of a performance metric (measurement of resource usage) based on historical time series data. Historical data, of up to 30 days, is used to predict what your metric usage will be in the next seven days.
Configuration Details
The Configuration Details tab provides key details of your RDS instance, such as instance identifier, region, instance class, and creation time.
Events
The Events tab shows significant activities and changes for your RDS instances, such as backups, maintenance, and state changes.
Logs
The Logs tab displays error logs for monitoring and troubleshooting AWS RDS instances.
Performance Insights
The Performance Insights tab provides detailed performance metrics for Amazon RDS, including overall database load (DBLOAD), CPU-related load (DBLOADCPU), and non-CPU-related load (DBLOADNONCPU). Click the applicable monitor name to obtain a detailed analysis of each Performance Insights monitor type.
Outages
The Outages tab provides details on an outage's start time, end time, duration, and comments (if any).
Inventory
Obtain details like the Resource Name, Region, and Monitor Licensing Category on the Inventory tab. The Threshold and Availability Profile and the Notification Profile can be set according to the user and viewed on this tab.
Log Report
This tab provides a consolidated report of each RDS monitor's log status, which can be downloaded as a CSV file.
RDS Cluster
You can view your RDS Cluster monitor data on the following tabs:
Summary
The Summary tab provides an overview of the events timeline and metrics in form of charts.
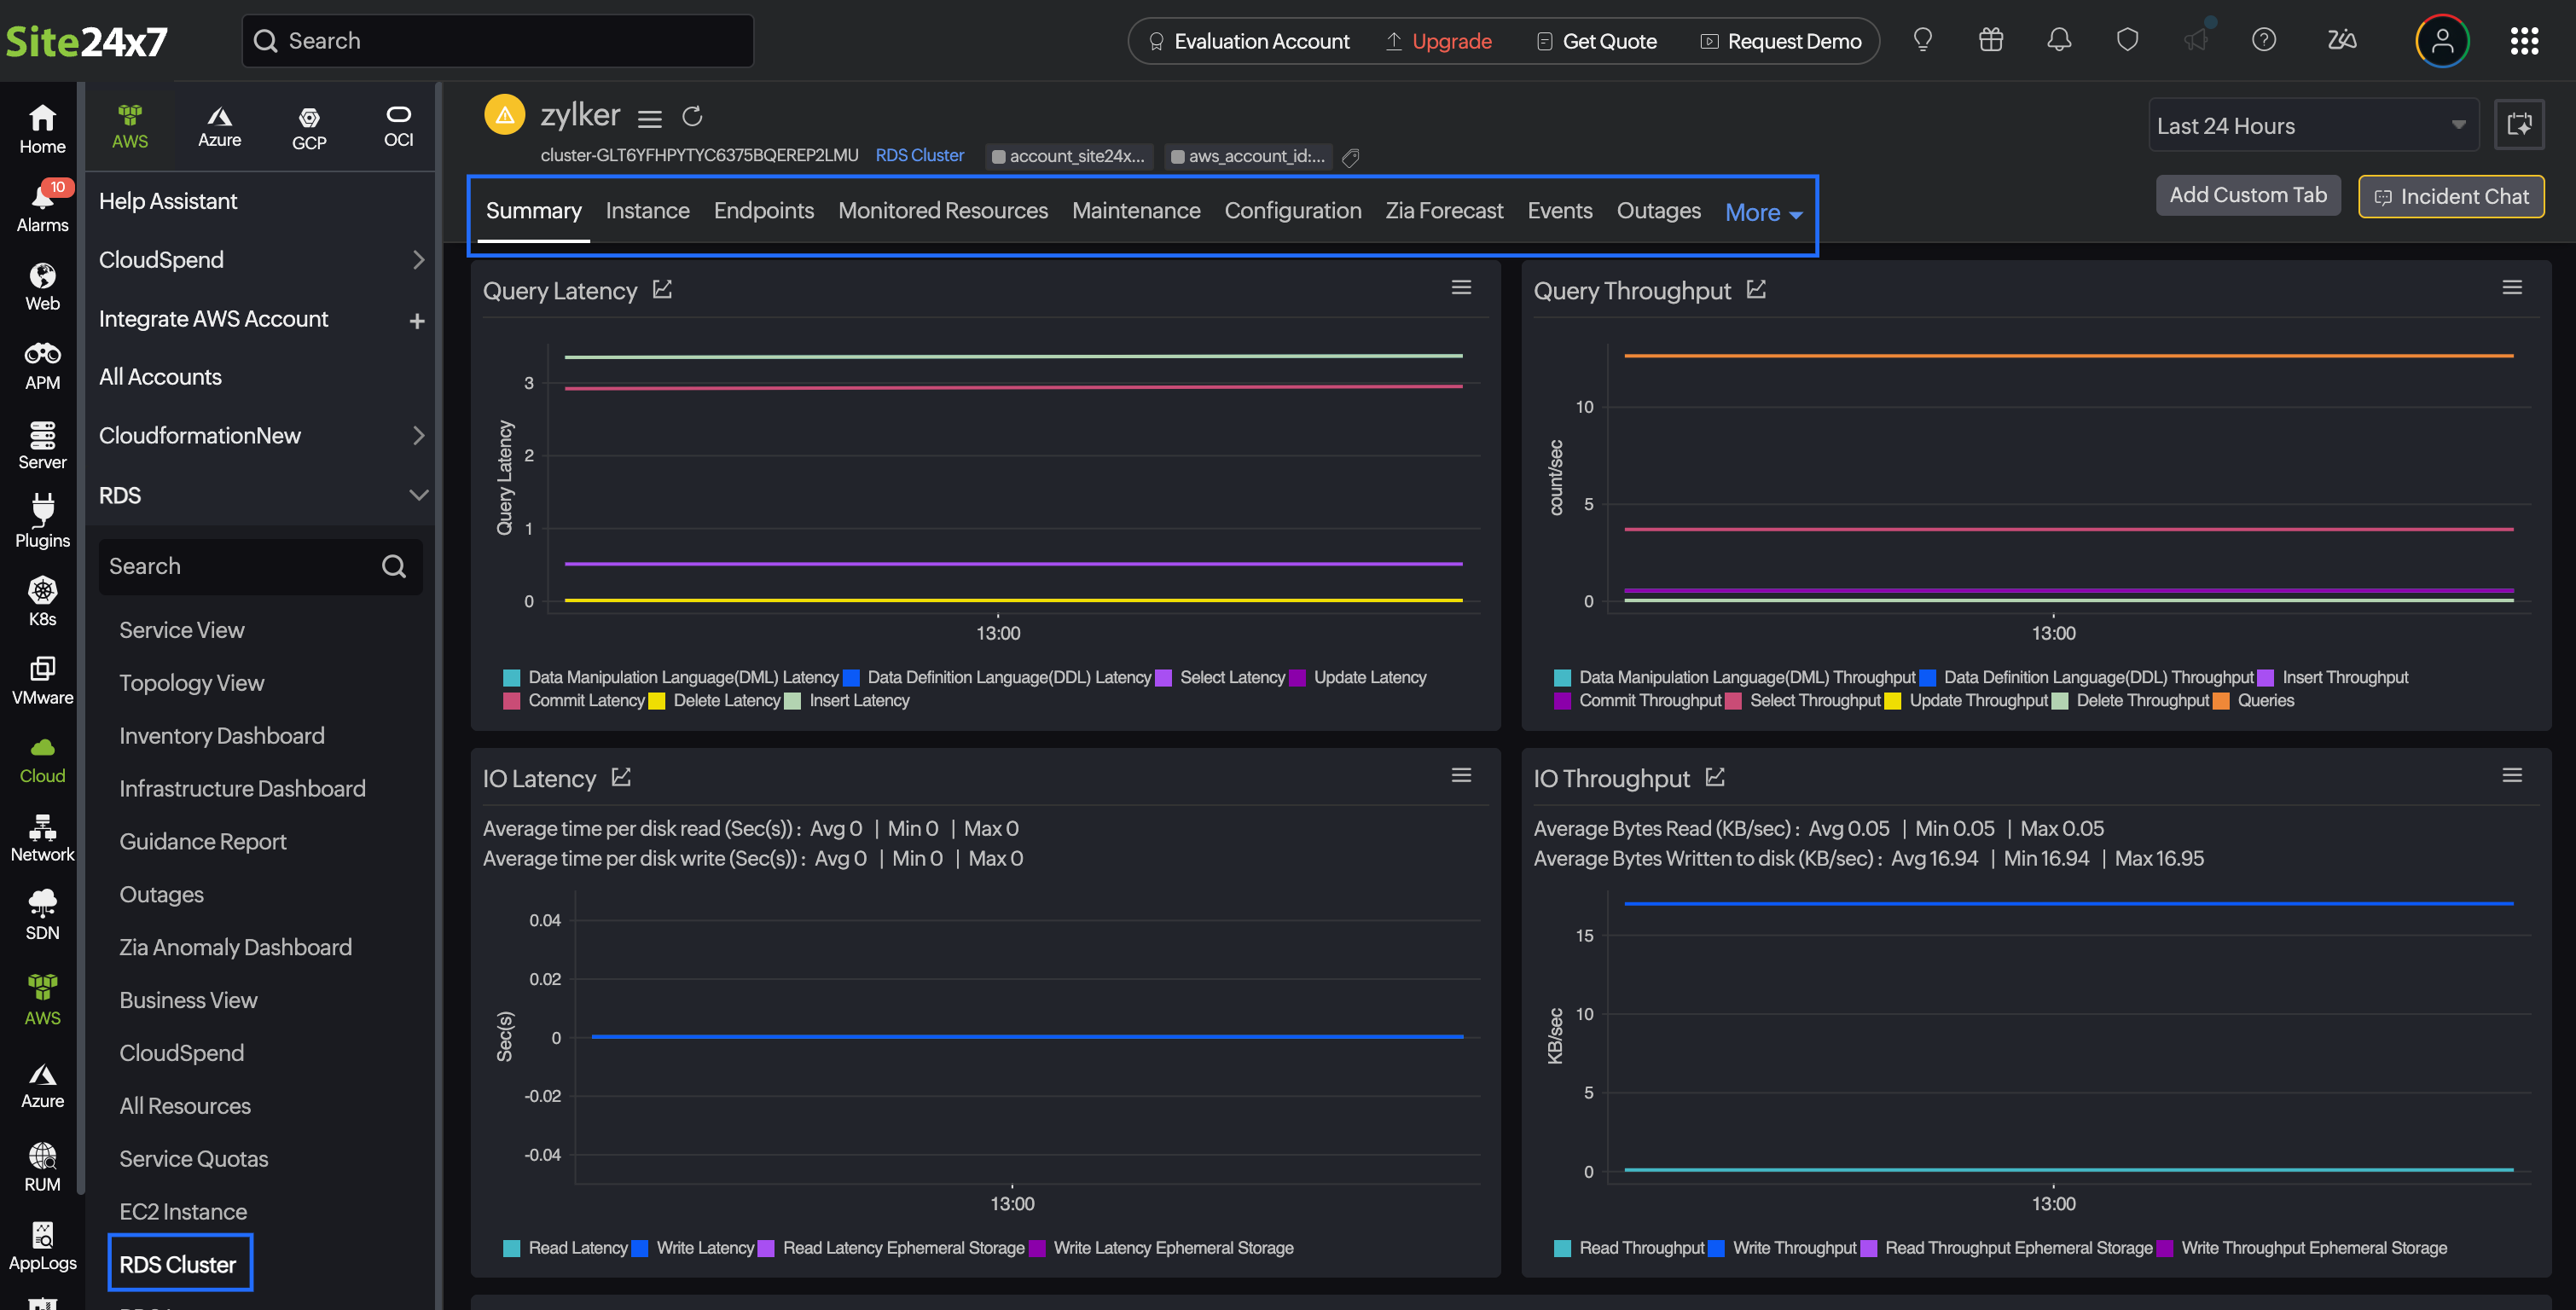
Topology View
The Topology View tab delivers a live, resource-centric dependency map. It dynamically traces how your RDS Cluster resource is connected to its surrounding AWS infrastructure in real time, enabling faster root cause isolation when alerts fire. If any connected component is in a Critical state, it is marked accordingly within the topology view, along with the outage reason, so you can pinpoint the exact failure point without needing to navigate away from the monitor page. Unlike account-wide topology views, this tab scopes visualization to a single resource, answering the precise question: What does this RDS Cluster resource connect to, and what breaks if it does?You can trace the full dependency chain from the individual resource up through its primary parent entities to the Service type, Region, and AWS account levels.
Write Forwarding
The Write Forwarding tab shows metrics related to write forwarding. It is available only when write forwarding is enabled for the cluster.
Parallel Query
The Parallel Query tab shows metrics related to parallel query. It is available only when parallel query is enabled.
Instance
This tab lists all child RDS instance monitors associated with the cluster.
Endpoints
The Endpoints tab lists all reader, writer, and custom endpoints configured for the cluster.
Maintenance
The Maintenance tab lists any pending maintenance tasks and the maintenance window settings.
Monitored Resource
The Monitored Resources tab displays the backend AWS resources associated with your RDS Cluster that are being monitored by Site24x7. Click the desired monitor name hyperlink to view the monitor details.
Configuration
The Configuration tab provides key details of your RDS instance, such as Cluster Name, Instance State, and Created Date.
Zia Forecast
The Zia forecast chart displays future points of a performance metric (measurement of resource usage) based on historical time series data. Thirty days of historical data is used to predict what your metric usage will be in the next seven days.
Events
The Events tab shows significant activities and changes for your RDS clusters, such as Timestamp, Message, and Events.
Outages
The Outages tab provides details on an outage's start time, end time, duration, and comments (if any).
Inventory
Obtain details like the Resource Name, Region, and Monitor Licensing Category on the Inventory tab. The Threshold and Availability Profile and the Notification Profile can be set according to the user and viewed on this tab.
Log Report
This tab provides a consolidated report of each RDS monitor's log status, which can be downloaded as a CSV file.
RDS Performance Insights
You can view your RDS Performance Insights monitor data on the following tabs:
Summary
The Summary tab provides an overview of the events timeline and metrics in form of charts.
Topology View
The Topology View tab delivers a live, resource-centric dependency map. It dynamically traces how your RDS Performance Insights resource is connected to its surrounding AWS infrastructure in real time, enabling faster root cause isolation when alerts fire. If any connected component is in a Critical state, it is marked accordingly within the topology view, along with the outage reason, so you can pinpoint the exact failure point without needing to navigate away from the monitor page. Unlike account-wide topology views, this tab scopes visualization to a single resource, answering the precise question: What does this RDS Performance Insights resource connect to, and what breaks if it does?You can trace the full dependency chain from the individual resource up through its primary parent entities to the Service type, Region, and AWS account levels.
All child monitors of RDS Performance Insights, such as OS General, OS CPU Utilization, and OS Disk IO, appear as tabs after the Topology tab.