Azure App Service Plan Monitoring Integration
An Azure App Service plan specifies the compute resources that a web app will use to run. One or more apps can be configured to run on a single App Service plan.
With Site24x7's integration, you can now monitor your App Service plan with accurate metrics, set thresholds, and receive alerts of your preference if there is a breach.
Set up and configuration
Adding an Azure App Service plan while configuring a new Azure monitor
If you haven't configured an Azure monitor yet, add one by following the steps below:
- Log in to your Site24x7 account.
- Choose Cloud from the left navigation pane, and select Azure > Add Azure Monitor. You can also follow these steps to add an Azure monitor.
- During Azure monitor configuration, in the Edit Azure Monitor page, select Azure App Service Plan from the Service/Resource Types drop-down.
Adding an Azure App Service plan to an existing Azure monitor
If you already have an Azure monitor configured for the tenant, you can add the Azure App Service plan by using the following steps:
- Log in to your Site24x7 account.
- Navigate to the Infrastructure, Inventory, or Management Dashboard from the left pane of the Azure monitor for which you wish to add an Azure service plan.
- Click the hamburger icon
 and then Edit, which will bring you to the Edit Azure Monitor page.
 - In the Edit Azure monitor page, select the corresponding Subscription and Resource Group from the drop-down menu, select Azure App Service Plan from the Service/Resource Types drop-down, and click Save.
After successful configuration, go to Cloud > Azure, select Azure App Service Plan from the Azure monitor drop-down. Now you can view the discovered service plans.
It will take 15-30 minutes to discover new Azure resources. For immediate discovery of the selected configuration, go to the Infrastructure Dashboard of the Azure monitor and click on Discover Now from the ![]() icon.
icon.
Polling frequency
Site24x7's Azure App Service Plan Monitor collects metric data every minute and the statuses from your service plans every five minutes.
Supported metrics
The following metrics are collected:
| Metric name | Description | Statistic | Unit |
|---|---|---|---|
| Data In | The average incoming bandwidth used across all instances of the plan | Average | Bytes |
| Data Out | The average outgoing bandwidth used across all instances of the plan | Average | Bytes |
| CPU Percentage | The average CPU used across all instances of the plan | Average | Percentage |
| Memory Percentage | The average memory used across all instances of the plan | Average | Percentage |
| Disk Queue Length | The average number of both read and write requests that are queued in storage: a high disk queue length is an indication of an app that might be slowing down because of excessive disk I/O | Average | Count |
| Http Queue Length | The average number of HTTP requests that had to sit in the queue before being fulfilled: a high or increasing HTTP queue length is a symptom of a plan with a heavy load | Average | Count |
| File System Storage | Total storage used | Average | Bytes |
| File System Used Percent | Percentage of total storage used | Average | Percentage |
| Number of App Services Down | Total number of app services in the App Service plan that are not running | Average | Count |
Azure Uptime monitoring
Site24x7’s Azure Uptime monitoring enables proactive tracking of your Azure resources’ availability and uptime, along with their configuration and inventory details. Note that uptime monitoring will disable performance metric data collection.
Threshold configuration
Global configuration
- Go to the Admin section in the left navigation pane.
- Select Configuration Profiles from the left pane and choose the Threshold and Availability (+) tab from the drop-down menu.
- Choose Azure App Service Plan as the monitor type.
You can also set the threshold values for all the metrics mentioned above.
Monitor-level configuration
- Go to Cloud > Azure and select Azure App Service Plan from the drop-down menu.
- Choose a resource for which you would like to set a threshold and then click the hamburger icon
 . Choose the Edit option, which will direct you to the Edit Azure App Service Plan Monitor page.
You can set the threshold values for the metrics by selecting the Threshold and Availability option. You can also configure IT Automation at the attribute level.
IT Automation
Site24x7's IT Automation tools help auto-resolve performance degradation issues. The alarm engine continually evaluates the system events for which thresholds are set, and executes the mapped automation when there is a breach.
How to configure IT Automation for a monitor.
Configuration Rules
Configure parameters like Threshold Profile, Notification Profile, Tags, Monitor Group, and others for multiple monitors with Site24x7's Configuration Rules. You can run a scan and associate any of the previously generated rules that suit the monitor configurations while adding new monitors.
How to add a configuration rule.
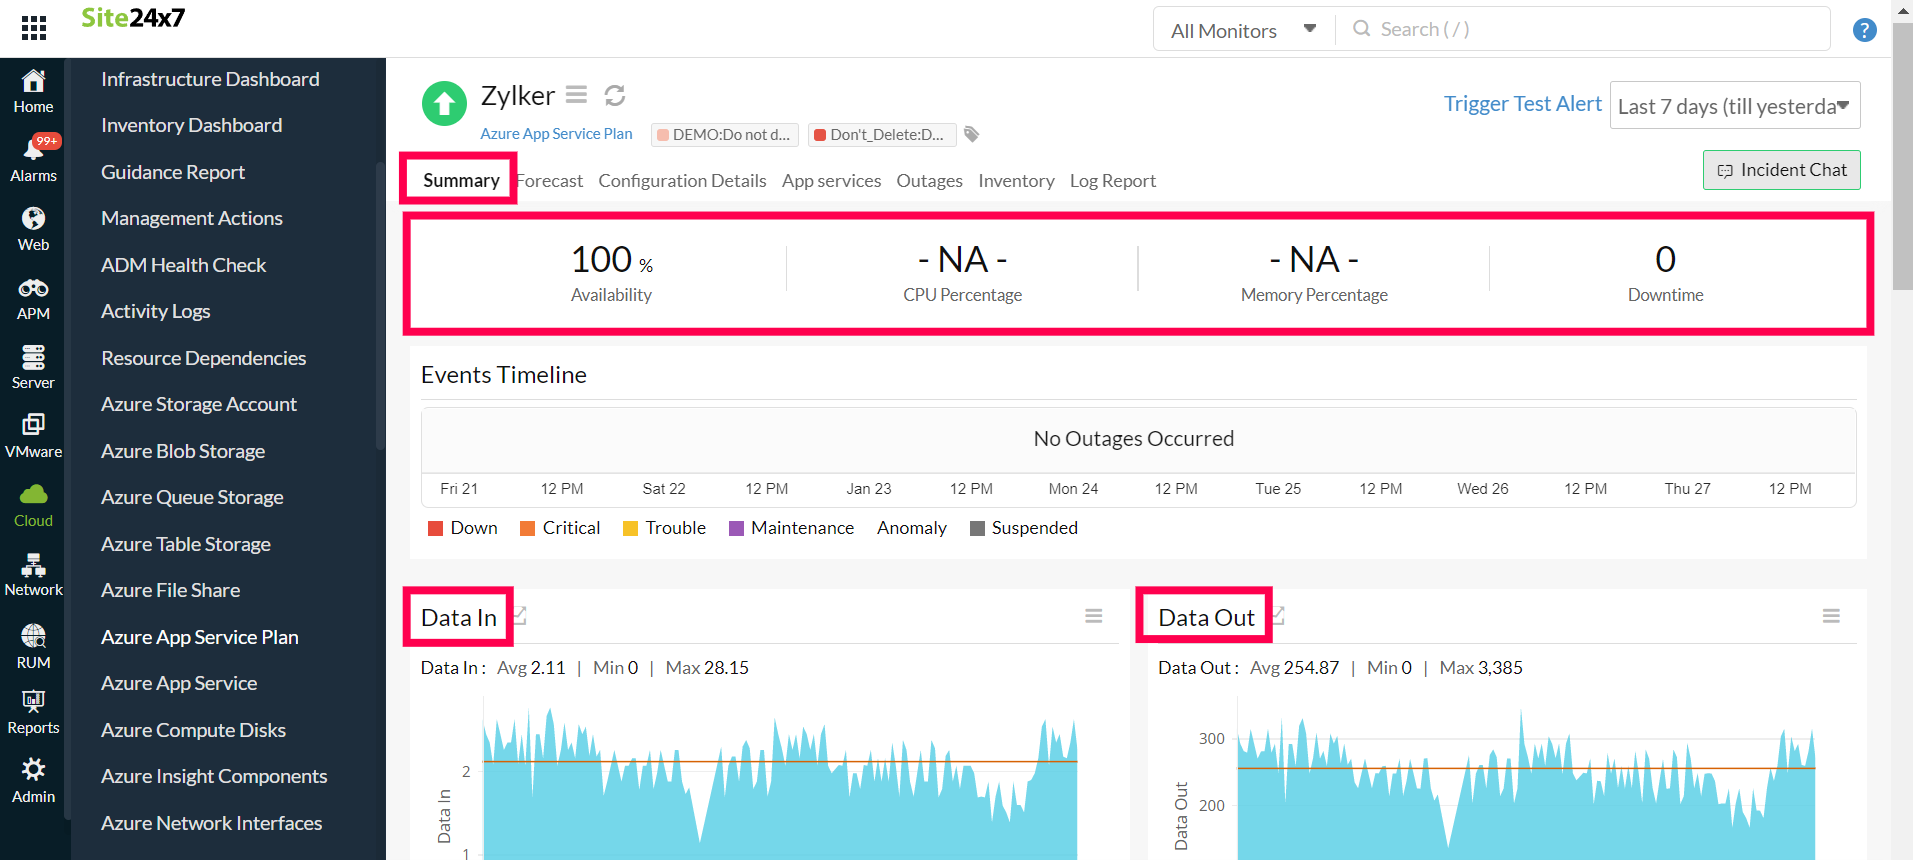
Summary
The Summary tab will give you the performance data organized by time for the above mentioned metrics.
- To view the summary, go to Cloud > Azure and click the Azure monitor > Azure App Service Plan.
- Click a resource and select the Summary tab.
Doing this allows you to view the Data In, Data Out, Number of App Services Down, and much more.
Configuration Details
The Configuration Details of an application instance are provided under this tab. Here, you'll find the Enabled Status, Number of Workers, Maximum Number of Workers, Tier, and so on.
- To get the configuration details, go to Cloud > Azure and click the Azure monitor > Azure App Service Plan.
- Click a resource and select the Configuration Details tab.
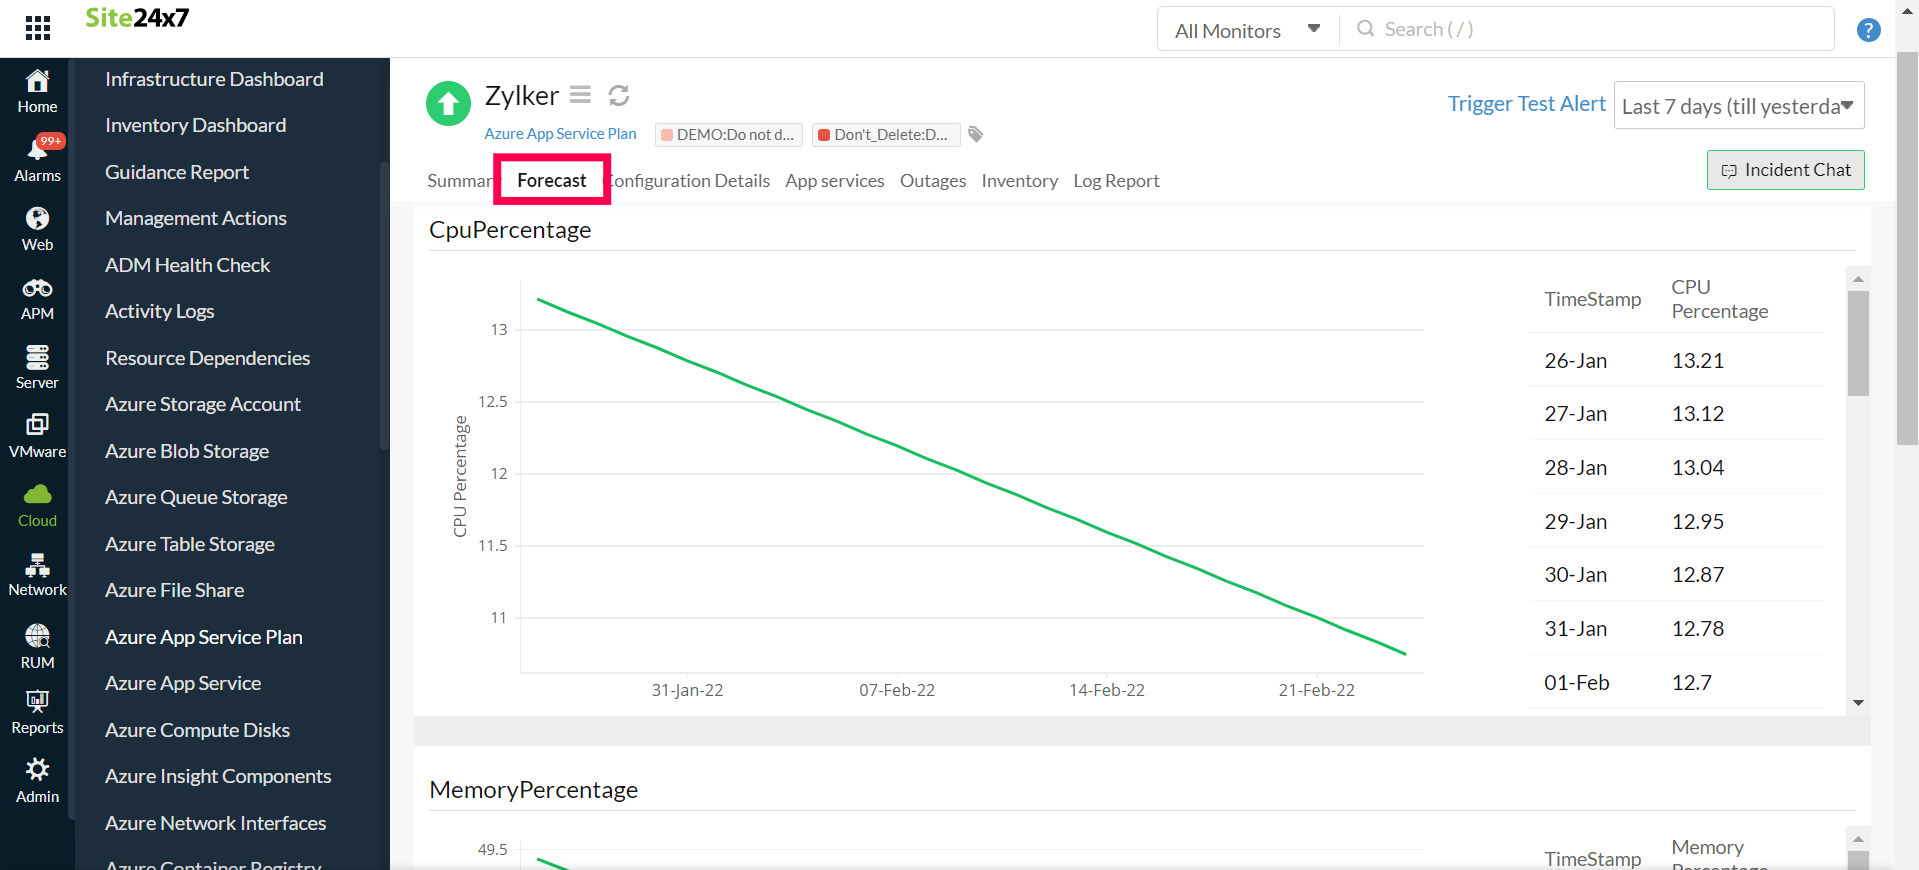
Forecast
Site24x7's forecasting engine enables you to predict the future points of Azure App Service plan performance metrics based on historical observations. To predict your metric value for the next seven days, it requires about 15-30 days of historical data to observe.
- You can view forecast charts by navigating to the Cloud section in the left navigation pane.
- Select Azure App Service Plan from the Azure drop-down, click a resource, and then choose the Forecast tab.

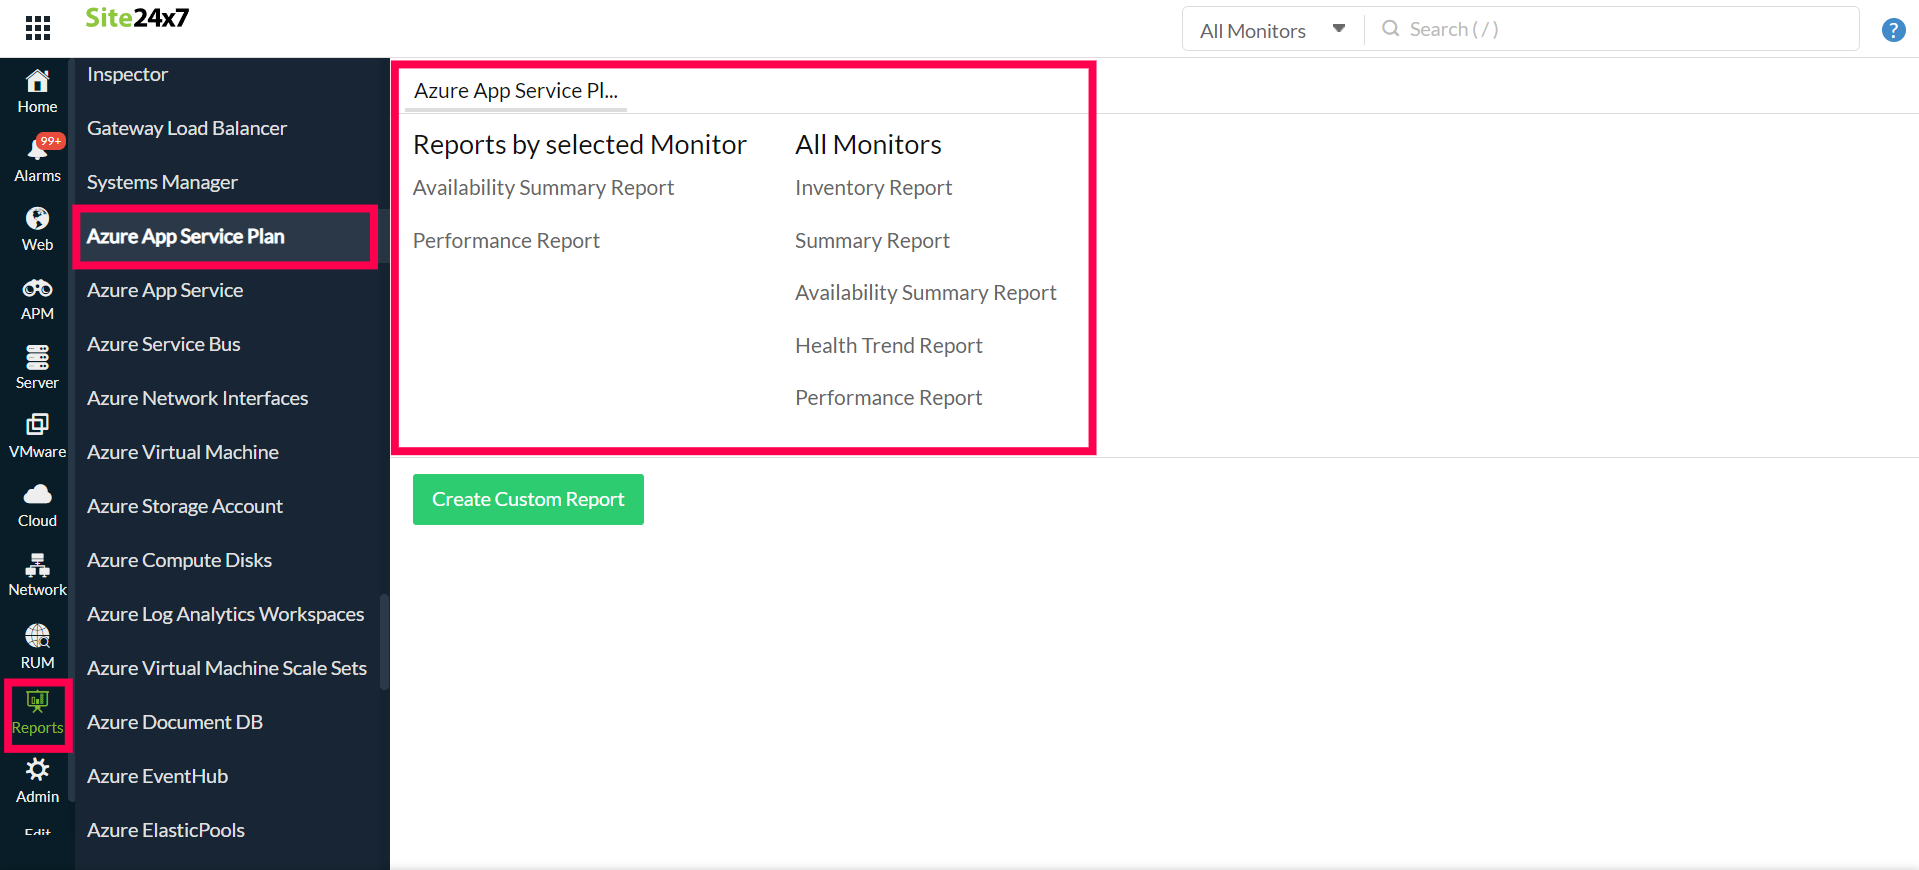
Reports
Gain in-depth data about the various parameters of your monitored resources and highlight your service performance using our insightful reports.
To view reports for your Azure App Service plan:
- Navigate to the Reports section on the left navigation pane.
- Select Azure App Service Plan from the menu on the left.
You can find the Availability Summary Report and the Performance Report for one selected monitor, or you can get the Inventory Report, Summary Report, Availability Summary Report, Health Trend Report, and the Performance Report for all the app service plan monitors.

You can also get reports from the Summary tab of the Azure App Service Plan Monitor.
- Get the Availability Summary Report of the monitor by clicking on Availability or Downtime.
- You can also find the Performance Report of the monitor by clicking on any chart title.

Related links:
How to add an Azure monitor.
How to configure IT automations for a monitor.
How to integrate an Azure App Service monitor.
How to integrate Azure Virtual Machine monitor.
How to configure IT automations for a monitor.
View the list of monitor reports.
