
Azure Load Balancer Monitoring Integration
Azure Load Balancer scales your applications and offers high-availability, low-latency, high-throughput services. You can scale up to millions of flows for all TCP and UDP applications using Azure Load Balancer.
With Site24x7's integration, you can monitor your load balancer, get precise analytics, set thresholds, automate operations, and stay on top of outages. Along with the load balancer itself, Site24x7 auto-discovers and monitors its multiple layers—Frontend IP Configurations, Load Balancing Rules, Health Probes, Backend Address Pools, and Backend Endpoints—each covered in its own section below.
Setup and configuration
You can add Azure Load Balancer while adding a new monitor or you can add it to an existing Azure monitor. Once the load balancer is added, all of its associated components described below are auto-discovered—no separate setup is required for them. Follow these steps to add the service.
Site24x7's Azure Load Balancer monitoring interface
Get an overview of the availability and usage status of your Azure Load Balancer.
Summary
With the information in this Summary tab, you can monitor traffic patterns and identify bottlenecks.
Settings
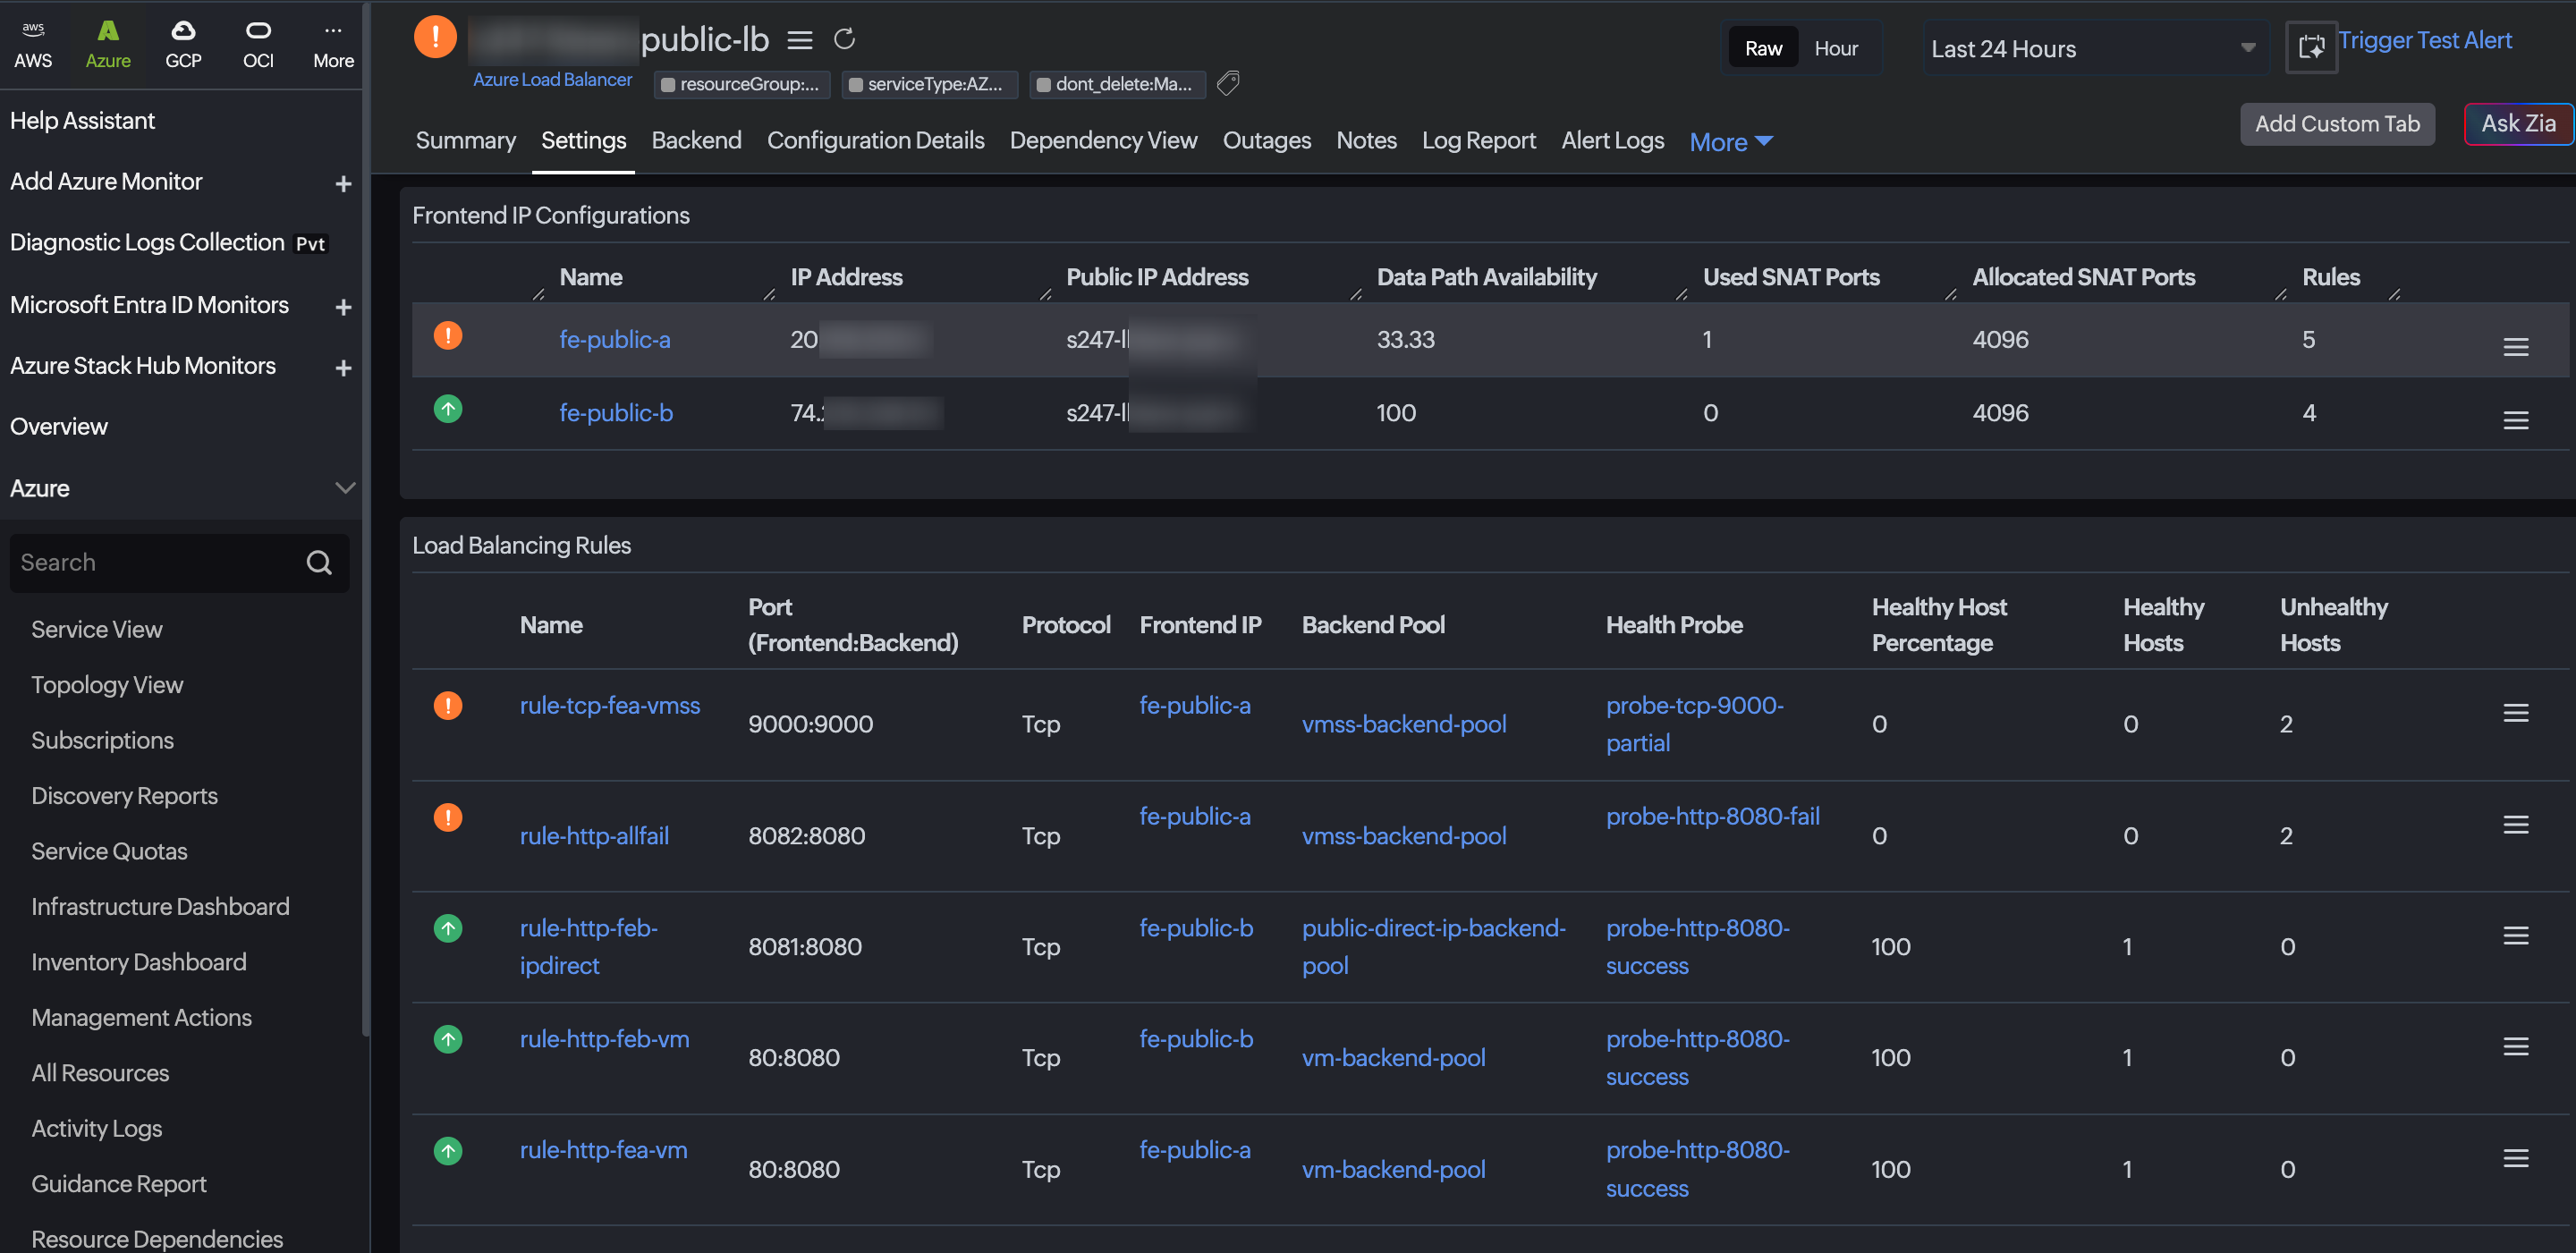
This tab lists the Frontend IP Configurations, Load Balancing Rules, and Health Probes configured for this load balancer, along with their statuses. With this information, you can verify frontend and rule health at a glance and drill into a specific rule or probe to investigate a failure.
Backend
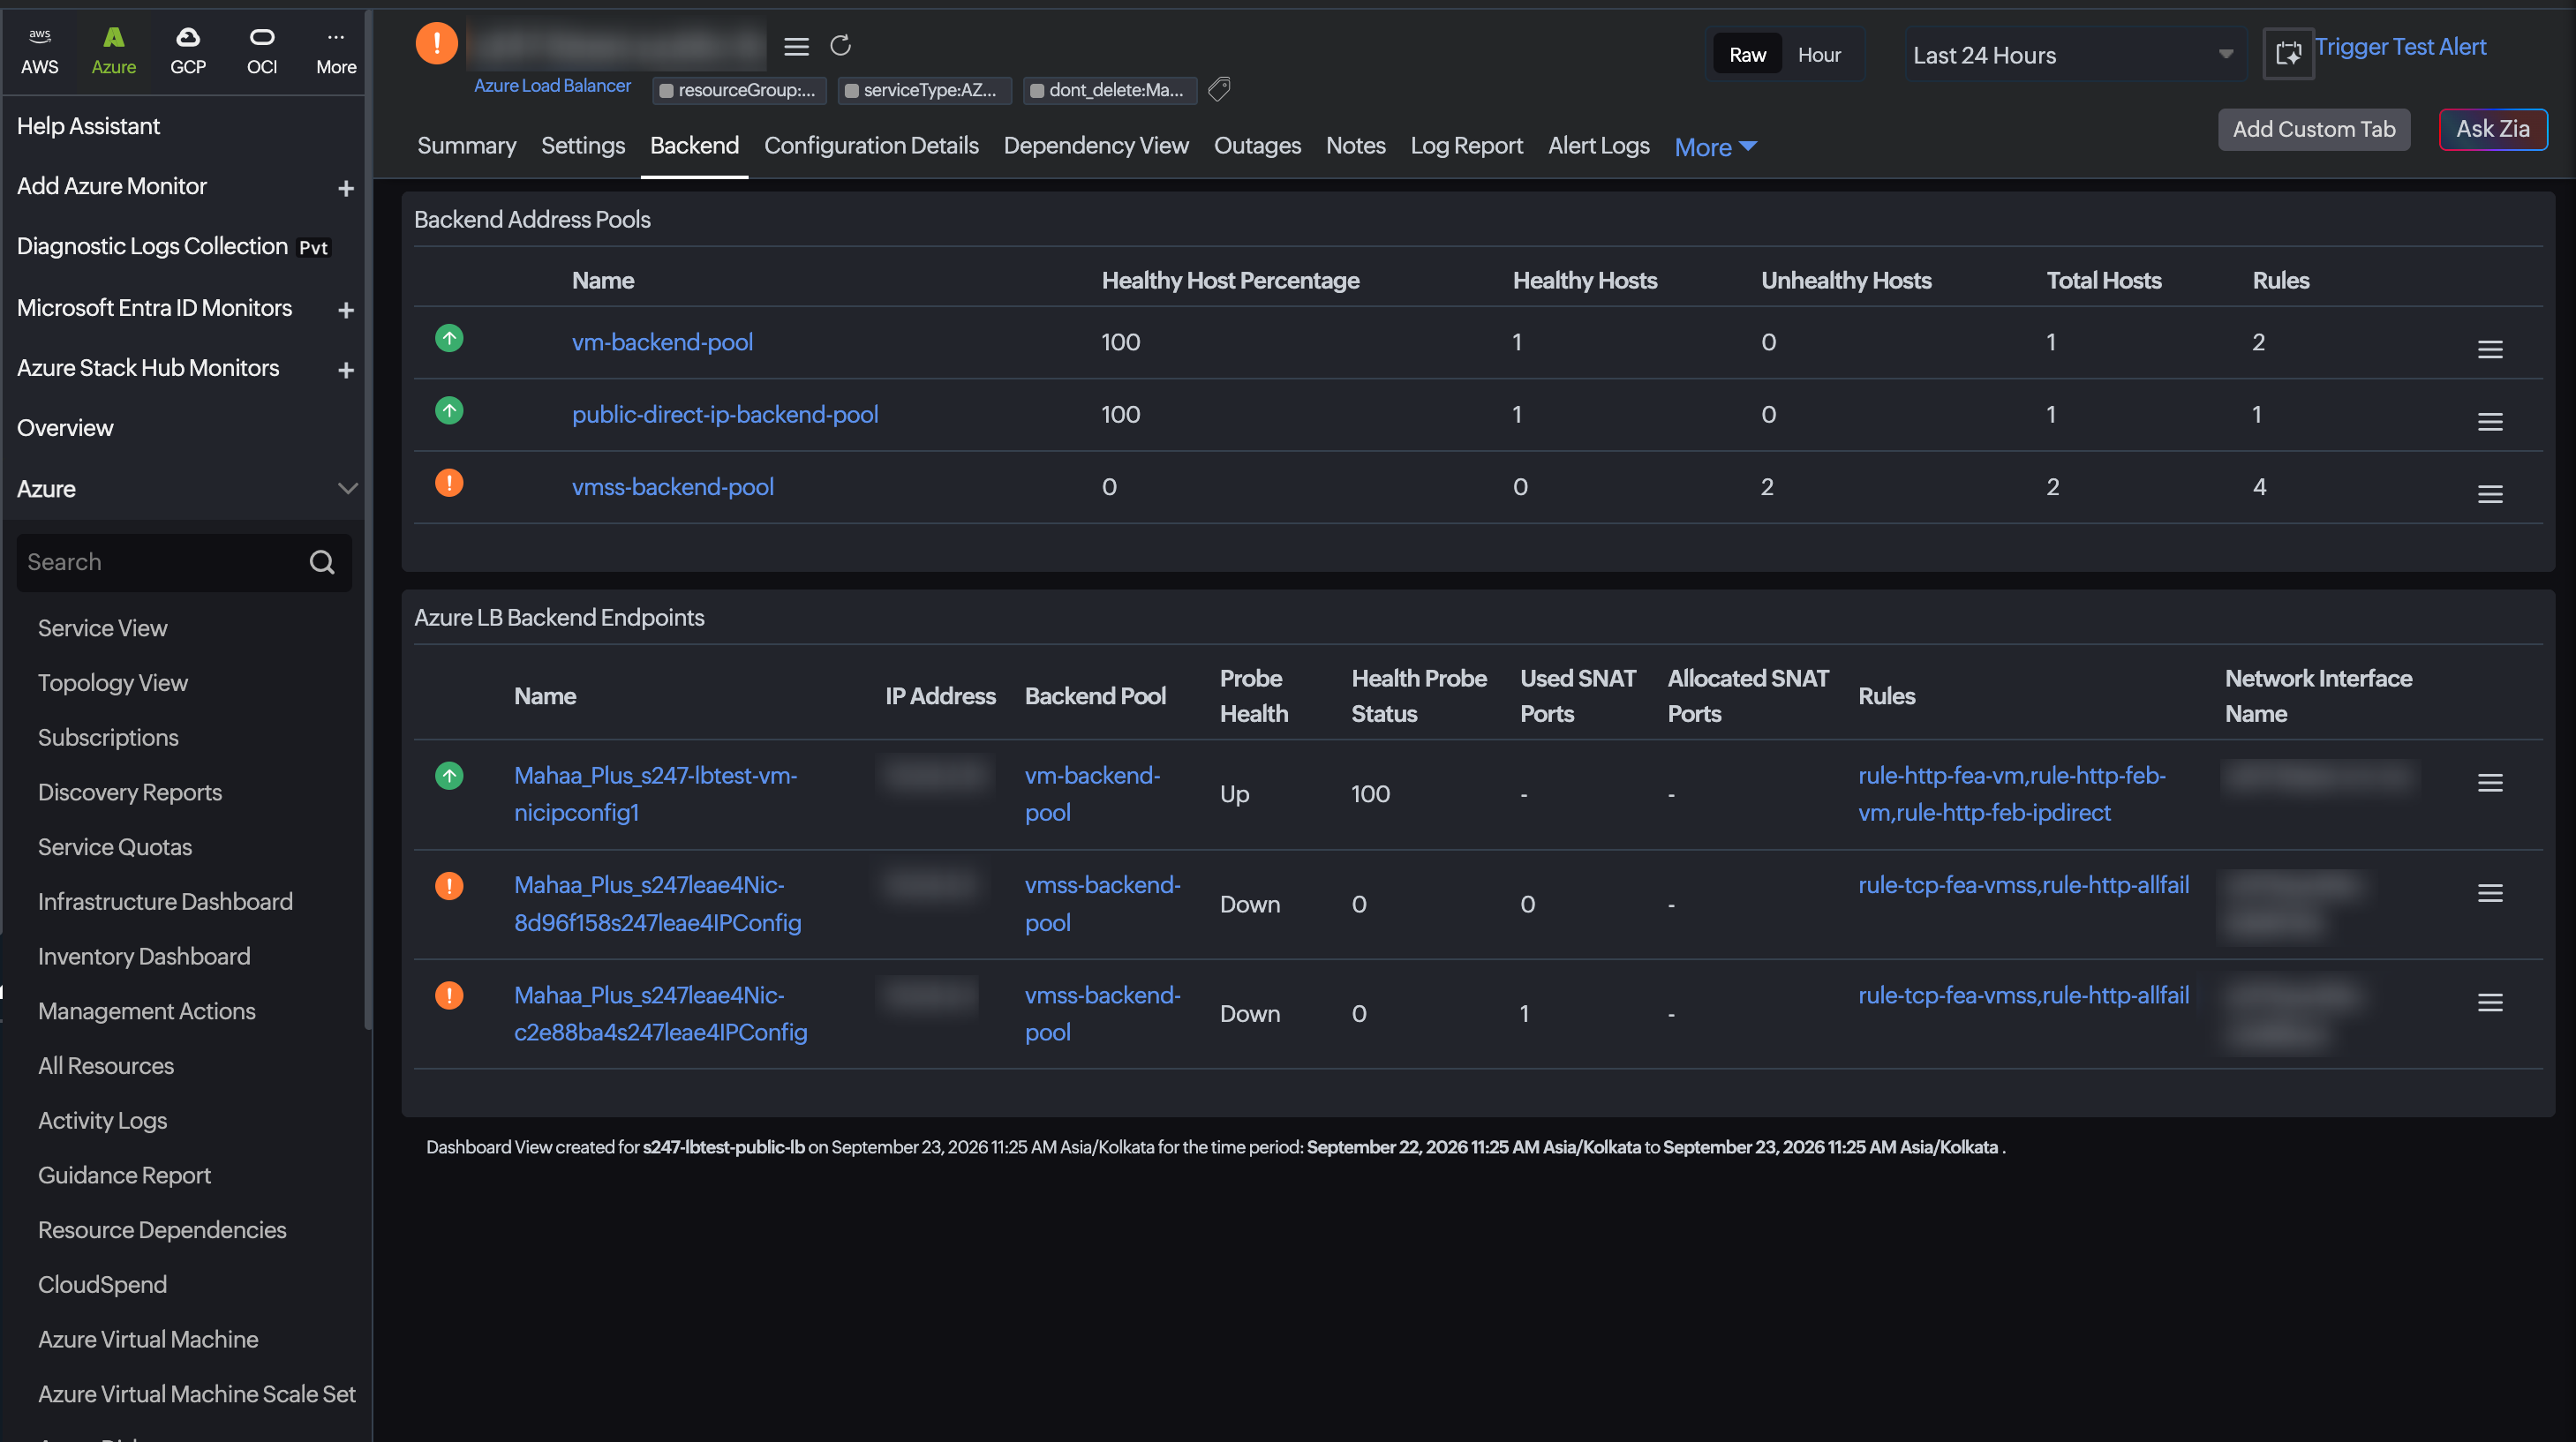
This tab has the list of the Backend Address Pools along with the statuses of the resources, Network Interfaces, and Virtual Networks mapped to them, as well as the individual Backend Endpoints within each pool, and the Inbound NAT Rules and Outbound Rules configured on the load balancer. With this information, you can verify backend connectivity and troubleshoot resource mapping issues.
Configuration Details
This tab provides the configuration details of your Azure Load Balancer, including the Subscription Name, Resource Group Name, Location, Provisioning State, Compute Size, Pricing Tier, and a consolidated list of the Frontend IP Configurations, Backend Address Pools, Load Balancing Rules, and Health Probes associated with the load balancer.
Dependency View
See the Dependency View section above for details on how the load balancer's associated components are visualized in this tab.
Outages
The Outages tab provides the history of the Azure Load Balancer's statuses, including Down, Trouble, and Critical.
Notes
The Notes tab lets you record and view notes associated with this monitor.
Log Report
The Log Report tab lists all the logs collected during every data collection along with their statuses.
Alert Logs
The Alert Logs tab lists the history of alerts triggered for this monitor.
More
Additional views, including Inventory (licensing, threshold and availability profiles, notification profiles, and user alert groups) and the Zia Forecast chart (predicted metric usage for the next seven days based on historical data), are available from the More drop-down.
Dependency View
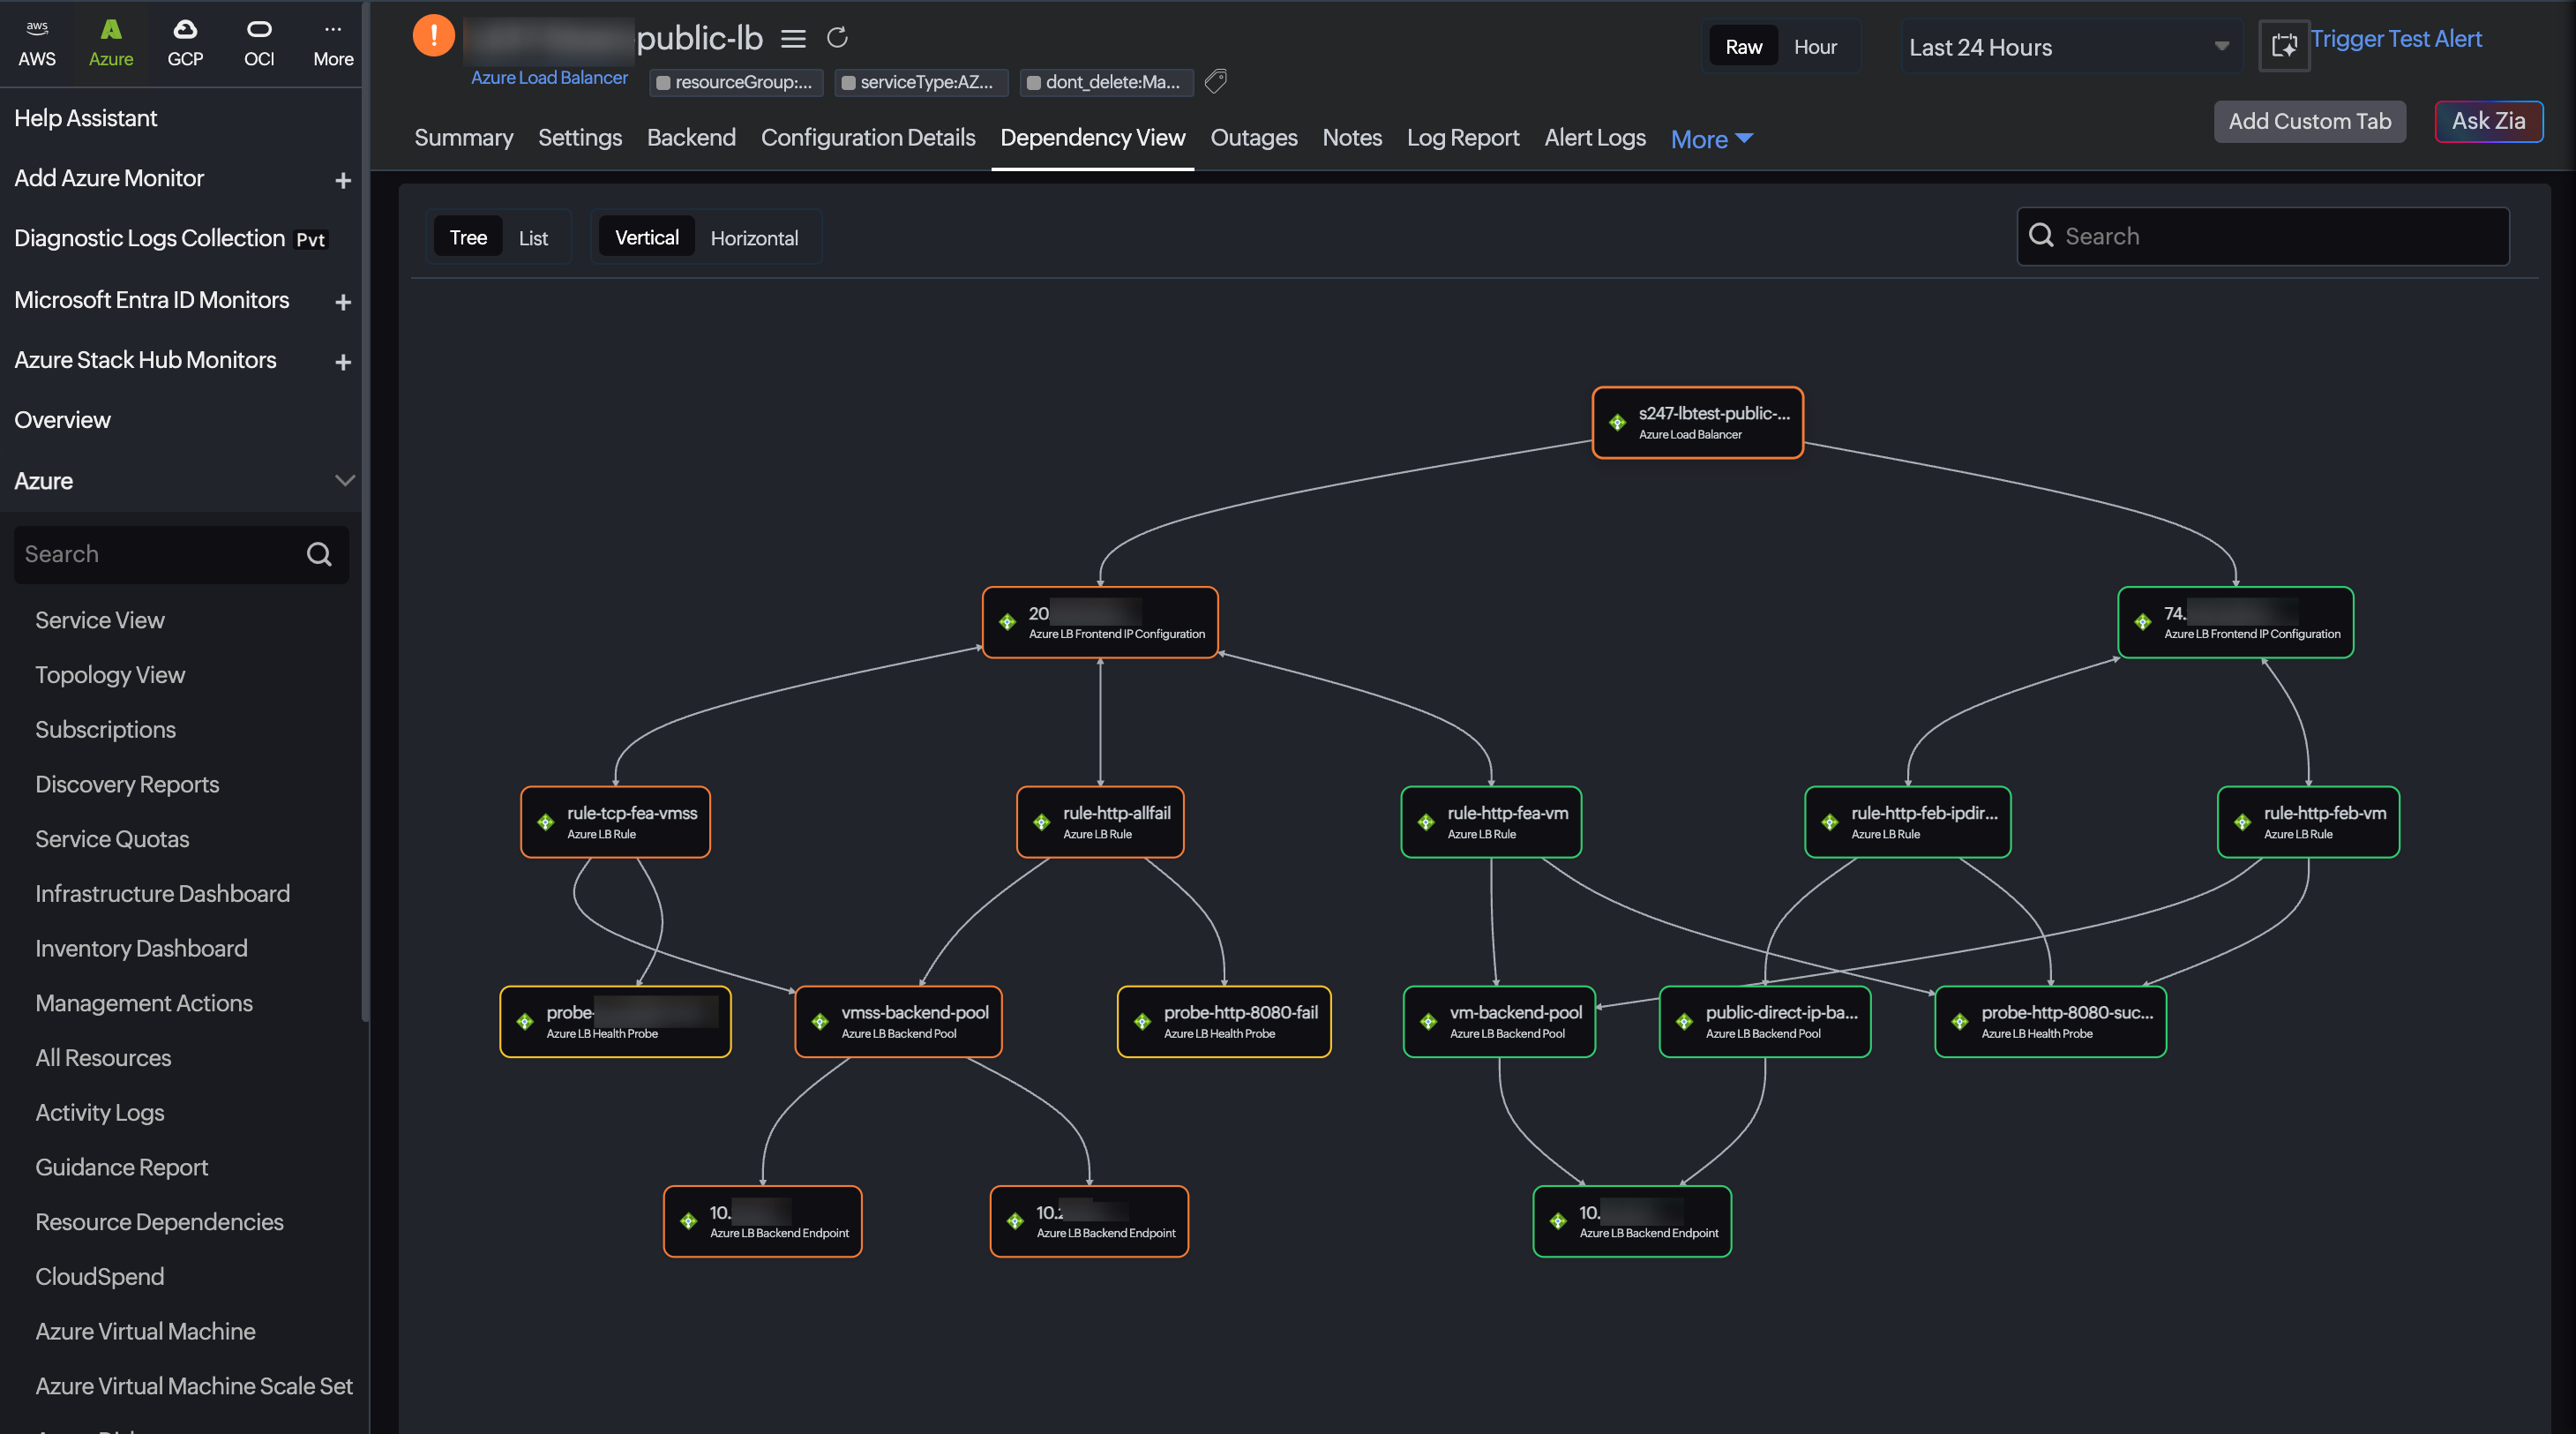
The Dependency View tab visualizes how the load balancer and its associated components are connected, so you can trace how traffic flows from a frontend IP all the way down to an individual backend endpoint.
The load balancer is shown as the root node, branching out to its Frontend IP Configurations. Each Frontend IP Configuration branches to the Load Balancing Rules that use it, and each rule branches to its associated Health Probe and Backend Pool. Each Backend Pool, in turn, branches to its individual Backend Endpoints.
- Switch between Tree and List views, and between Vertical and Horizontal orientation, using the toggles above the diagram.
- Use the search box to quickly locate a specific node by name, status, and monitor type.
- Each node is color-coded by its current status so you can spot which part of the dependency chain is affected at a glance.
- Hover over any node to view its details or navigate to that resource's own monitor page.
Supported metrics
The metrics below reflect the overall health and traffic of the load balancer, aggregated across all its backend pools, rules, and endpoints. For metrics scoped to an individual associated component, see the corresponding section below.
| Metric name | Description | Statistic | Unit |
|---|---|---|---|
| Allocated SNAT Ports | Total number of Source Network Address Translation (SNAT) ports allocated within the time period | Average | Count |
| Byte Count | Total number of bytes transmitted within the time period | Average | Count |
| Health Probe Status | Average load balancer health probe status per time duration | Average | Count |
| Packet Count | Total number of packets transmitted within the time period | Average | Count |
| SYN Count | Total number of synchronize (SYN) packets transmitted within the time period | Average | Count |
| SNAT Connection Count | Total number of new SNAT connections created within the time period | Average | Count |
| Used SNAT Ports | Total number of SNAT ports used within the time period | Average | Count |
| Data Path Availability | Average load balancer data path availability per time duration | Average | Count |
| Healthy Host | Number of healthy hosts behind the load balancer, aggregated across all backend pools | Average | Count |
| Unhealthy Host | Number of unhealthy hosts behind the load balancer, aggregated across all backend pools | Average | Count |
| Total Host | Total number of hosts behind the load balancer, aggregated across all backend pools | Average | Count |
| Healthy Host Percentage | Percentage of healthy hosts behind the load balancer, aggregated across all backend pools | Average | Percentage (%) |
Frontend IP Configuration
A Frontend IP Configuration defines the IP address (public or private) that receives incoming traffic for the load balancer. On the Site24x7 monitor, these are listed under the Settings tab.
Metrics
| Metric name | Description | Statistic | Unit |
|---|---|---|---|
| Byte Count | Total number of bytes transmitted through this frontend IP configuration within the time period | Total | Count |
| Packet Count | Total number of packets transmitted through this frontend IP configuration within the time period | Total | Count |
| Data Path Availability | Average data path availability of this frontend IP configuration per time duration | Average | Percentage (%) |
| Health Probe Status | Average health probe status of the hosts behind this frontend IP configuration per time duration | Average | Percentage (%) |
| SYN Count | Total number of synchronize (SYN) packets transmitted through this frontend IP configuration within the time period | Total | Count |
| SNAT Connection Count | Total number of new SNAT connections created through this frontend IP configuration within the time period | Total | Count |
| Used SNAT Ports | Total number of SNAT ports used through this frontend IP configuration within the time period | Average | Count |
| Allocated SNAT Ports | Total number of SNAT ports allocated to this frontend IP configuration within the time period | Average | Count |
Configuration attributes
| Attribute | Description |
|---|---|
| Subscription | The Azure subscription in which this frontend IP configuration is deployed |
| Resource Group | The Azure resource group containing this frontend IP configuration |
| Location | The Azure region where this frontend IP configuration is deployed |
| Name | The name of the frontend IP configuration |
| IP Address | The IP address assigned to this frontend IP configuration |
| IP Address Version | The IP version (IPv4 or IPv6) of this frontend IP configuration |
| Public IP | The public IP address resource associated with this frontend IP configuration, if any |
| Private IP Allocation Method | Indicates whether the private IP address is assigned dynamically or statically |
| Rules | The load balancing and NAT rules associated with this frontend IP configuration |
| Subnet | The subnet associated with this frontend IP configuration |
| VNet | The virtual network associated with this frontend IP configuration |
Load Balancing Rules
A Load Balancing Rule maps a frontend IP and port combination to a backend pool and port, using a health probe to determine which backend instances receive traffic. On the Site24x7 monitor, these are listed under the Settings tab.
Metrics
| Metric name | Description | Statistic | Unit |
|---|---|---|---|
| Healthy Host | Number of healthy hosts associated with this load balancing rule | Average | Count |
| Unhealthy Host | Number of unhealthy hosts associated with this load balancing rule | Average | Count |
| Total Host | Total number of hosts associated with this load balancing rule | Average | Count |
| Healthy Host Percentage | Percentage of healthy hosts associated with this load balancing rule | Average | Percentage (%) |
Configuration attributes
| Attribute | Description |
|---|---|
| Subscription | The Azure subscription in which this load balancing rule is deployed |
| Resource Group | The Azure resource group containing this load balancing rule |
| Location | The Azure region where this load balancing rule is deployed |
| Protocol | The transport protocol (TCP or UDP) used by this rule |
| Port | The frontend and backend port mapping configured for this rule |
| Backend Pool | The backend pool this rule distributes traffic to |
| Frontend IP | The frontend IP configuration this rule receives traffic on |
| Probe | The health probe used by this rule to determine backend instance health |
Health Probes
A Health Probe periodically checks the health of backend instances so that the load balancer can route traffic only to instances that respond successfully. On the Site24x7 monitor, these are listed under the Settings tab.
Metrics
| Metric name | Description | Statistic | Unit |
|---|---|---|---|
| Probe Health | Indicates the current health status of the probe (Up, Down, or Unknown) | Current status | Status |
Configuration attributes
| Attribute | Description |
|---|---|
| Subscription | The Azure subscription in which this health probe is deployed |
| Resource Group | The Azure resource group containing this health probe |
| Location | The Azure region where this health probe is deployed |
| Name | The name of the health probe |
| Protocol | The protocol (HTTP, HTTPS, or TCP) used by this health probe |
| Interval In Seconds | The interval, in seconds, at which this health probe checks backend instance health |
| Probe Threshold | The number of consecutive successful or failed probes required before an instance's health status is changed |
Backend Address Pools
A Backend Address Pool is a group of virtual machines or NICs that the load balancer distributes traffic to. On the Site24x7 monitor, these are listed under the Backend tab.
Metrics
| Metric name | Description | Statistic | Unit |
|---|---|---|---|
| Healthy Host | Number of healthy hosts in this backend pool | Average | Count |
| Unhealthy Host | Number of unhealthy hosts in this backend pool | Average | Count |
| Total Host | Total number of hosts in this backend pool | Average | Count |
| Healthy Host Percentage | Percentage of healthy hosts in this backend pool | Average | Percentage (%) |
Configuration attributes
| Attribute | Description |
|---|---|
| Subscription | The Azure subscription in which this backend pool is deployed |
| Resource Group | The Azure resource group containing this backend pool |
| Location | The Azure region where this backend pool is deployed |
| Name | The name of the backend pool |
| Rules | The load balancing rules associated with this backend pool |
| Backend Endpoint IPs | The IP addresses of the endpoints in this backend pool |
Backend Endpoints
A Backend Endpoint is an individual virtual machine NIC IP configuration within a backend pool. On the Site24x7 monitor, these are listed under the Backend tab.
Metrics
| Metric name | Description | Statistic | Unit |
|---|---|---|---|
| Data Path Availability | Average data path availability of this endpoint per time duration | Average | Percentage (%) |
| SNAT Connection Count | Total number of new SNAT connections created by this endpoint within the time period | Total | Count |
| Used SNAT Ports | Total number of SNAT ports used by this endpoint within the time period | Average | Count |
| Allocated SNAT Ports | Total number of SNAT ports allocated to this endpoint within the time period | Average | Count |
Configuration attributes
| Attribute | Description |
|---|---|
| Subscription | The Azure subscription in which this endpoint is deployed |
| Resource Group | The Azure resource group containing this endpoint |
| Location | The Azure region where this endpoint is deployed |
| Name | The name of the endpoint |
| IP Address | The IP address of this endpoint |
| Network Interface Name | The name of the network interface associated with this endpoint |
| Backend Pool | The backend pool this endpoint belongs to |
| VNet | The virtual network associated with this endpoint |
| Subnet | The subnet associated with this endpoint |
| Rules | The load balancing rules that route traffic to this endpoint |
| Probe State | The current health probe state for this endpoint |
| Probe Reason Code | The reason code reported by the health probe for this endpoint's current state |
| Probe Reason | The human-readable reason reported by the health probe for this endpoint's current state |
Inbound NAT Rules
Inbound NAT Rules forward traffic from a frontend IP configuration and port to a specific backend instance and port. On the Site24x7 monitor, these are listed under the Backend tab. Site24x7 discovers the following configuration attributes for each Inbound NAT Rule.
| Attribute | Description |
|---|---|
| Frontend IP | The frontend IP configuration associated with this inbound NAT rule |
| Target Type | The type of the target resource this rule forwards traffic to |
| Target Name | The name of the target resource this rule forwards traffic to |
| Port | The frontend and backend port mapping for this rule |
| Protocol | The transport protocol (TCP or UDP) used by this rule |
| Floating IP | Indicates whether Floating IP (direct server return) is enabled for this rule |
| TCP Reset | Indicates whether TCP Reset is enabled on idle connection timeout for this rule |
Outbound Rules
Outbound Rules configure outbound NAT for all or a subset of instances in a backend pool. On the Site24x7 monitor, these are listed under the Backend tab. Site24x7 discovers the following configuration attributes for each Outbound Rule.
| Attribute | Description |
|---|---|
| Frontend IP | The frontend IP configuration used for outbound connections by this rule |
| Backend Pool | The backend pool associated with this outbound rule |
| Protocol | The transport protocol (TCP, UDP, or All) used by this rule |
| TCP Reset | Indicates whether TCP Reset is enabled on idle connection timeout for this rule |
| Idle Timeout In Minutes | The idle connection timeout configured for this outbound rule, in minutes |
Azure Uptime monitoring
Site24x7’s Azure Uptime monitoring enables proactive tracking of your Azure resources’ availability and uptime, along with their configuration and inventory details. Note that uptime monitoring will disable performance metric data collection.
Threshold configuration
The instructions are applicable to set thresholds for each load balancer component like rule, configuration, and more.
Global configuration
- Go to the Admin section on the left navigation pane.
- Select Configuration Profiles from the left pane and choose Threshold and Availability (+) from the drop-down menu. Click Add Threshold Profile from the top right corner.
- Choose Azure Load Balancer as the monitor type.
You can also set the threshold values for all the metrics mentioned above.
Monitor-level configuration
- Go to Cloud > Azure and select Azure Load Balancer from the drop-down menu.
- Choose a resource for which you would like to set a threshold and then click the hamburger icon
 on the top. Choose the Edit option, which will direct you to the Edit Azure Load Balancer Monitor page.
You can set the threshold values for the metrics by selecting the Threshold and Availability option. You can also configure IT automation at the attribute level. To set thresholds for a specific associated component (a Frontend IP Configuration, Load Balancing Rule, Health Probe, Backend Pool, or Backend Endpoint), click the hamburger icon next to that entity on the Settings or Backend tab and choose Edit.
Default threshold
Site24x7 alerts you based on a set of default thresholds. These default thresholds ensure that your load balancer and its associated components are not overutilized, thus maintaining optimal performance.
IT Automation
You can configure Site24x7's IT Automation to auto-resolve performance degradation issues.
How to configure IT Automation for a monitor
Configuration Rules
Configure parameters like Threshold Profile, Notification Profile, Tags, and Monitor Group for multiple monitors with Site24x7's Configuration Rules.
How to add a Configuration Rule
Related links:
How to add an Azure monitor.
How to integrate an Azure App Service monitor.
How to integrate Azure Virtual Machine monitor.
How to configure IT Automations for a monitor.
How to add a Configuration Rule.
-
On this page
- Setup and configuration
- Site24x7's Azure Load Balancer monitoring interface
- Supported metrics
- Frontend IP Configuration
- Load Balancing Rules
- Health Probes
- Backend Address Pools
- Backend Endpoints
- Inbound NAT Rules
- Outbound Rules
- Dependency View
- Azure Uptime monitoring
- Threshold configuration
- IT Automation
- Configuration Rules