Plugin Integrations
Site24x7's plugin integrations, or plugins, help you expand monitoring capabilities across your entire tech stack, enabling the collection of performance metrics tailored to specific applications, services, or systems.
With plugin integrations, you can:
- Monitor popular applications and services using over 100 ready-to-install plugin integrations, including web servers, databases, caches, and messaging queues.
- Build your own plugin using custom scripts to gather performance data from any application, system, or service tailored to your organization or IT ecosystem, and view the data in Site24x7.
- Leverage Site24x7's platform capabilities to build custom dashboards, set threshold-based notifications, auto-remediate IT incidents, and more.
How does it work?
Plugin integrations, both out-of-the-box and custom ones, leverage scripts that gather monitoring data from the relevant application or service. A Windows or Linux server monitoring agent is required to install and add plugins in Site24x7. Once the agent is successfully installed, it will execute the plugin script added in the agent directory and push the output to the Site24x7 data center. The resulting data can be viewed in the Site24x7 web client.
What is a plugin template?
A plugin template in Site24x7 is a user-defined monitor type that allows customization of monitored attributes and units. The JSON output's keys in a plugin define its attributes within the template. This template enables users to tailor performance charts by selecting relevant attributes and displaying them on the plugin monitor details page.
When registering a new plugin script, Site24x7 checks attributes against existing templates. If there's no match, a new template is created; otherwise, it's mapped to the existing one. Modifying the plugin's JSON keys, i.e., editing the template, requires increasing the plugin version by 1.
For instance, upon registering a custom plugin script on Site24x7 servers, a corresponding plugin template is automatically generated, defining its performance attributes.
Learn more about plugin templates and how to edit them here.
What is a plugin monitor?
A plugin monitor is generated in Site24x7 from a registered plugin template, which tracks the attributes defined in the template.
For example, the mysql_monitoring.py template installed in N number of servers will create N number of MySQL plugin monitors.
Get started
Over 100 ready-to-install plugin integrations
Site24x7 provides over 100 ready-to-install plugin integrations, including Apache, MongoDB, Kafka, Tomcat, and Nagios, to monitor your applications, databases, load balancers, message brokers, caches, and more.
See a list of all plugin integrations supported by Site24x7 here.
How to set up ready-to-install plugin integrations
You can install our out-of-the-box plugins by navigating to Plugins > Plugin Integrations > + , clicking the required plugin, and following our detailed in-line documentation for each plugin. Alternatively, you can also visit our specific plugin webpages here and view related documentation.
In general, follow the steps below to install any plugin:
- Install the Site24x7 server monitoring agent (Windows | Linux).
- Ensure the relevant prerequisites (including providing access or installation of dependency modules) for the specific plugins are fulfilled.
- Download the required plugin files from our GitHub repository. Our detailed documentation within the Site24x7 web client or on the plugin webpages also lists the files to download for each plugin.
- Place the downloaded files in a folder that has the same name of the files.
For example, if you have downloaded the Apache monitoring plugin files apache_monitoring.py and apache_monitoring.cfg, place the files in a folder named apache_monitoring. - Edit the .cfg file to add the configurations specific to the application. This differs for each plugin. Follow the detailed documentation of each plugin to know what to edit in .cfg files.
- Place the folder (with the files within) in the Site24x7 server monitoring agent folder.
For Linux: /opt/site24x7/monagent/plugins/
For Windows: C:\Program Files (x86)\Site24x7\WinAgent\monitoring\plugins/
Build custom plugins
Create custom monitoring plugins with Zia in Site24x7. Generate scripts in multiple languages to monitor applications, databases, OS metrics, cloud services, APIs, and more.
You can also write your own plugin scripts to monitor custom metrics you require from your systems and services and see the data in the Site24x7 web client.
Site24x7 supports scripts in Python or Shell for Linux, and Batch, PowerShell, VB, and DLL for Windows.
Learn about some prerequisites before writing a custom plugin.
If you have a plugin script for popular services and applications working in your environment and wish to share it with other Site24x7 users, follow the steps in this document. You can win a gift voucher if the plugin is published in our repository.
Add multiple configurations in a single plugin script
If you have multiple application instances running in your environment, you can configure all the instances to be monitored with a single plugin script.
To do this for out-of-the-box plugins, add multiple configurations in the .cfg file of the plugin as shown below. Note that these configurations will differ based on the plugin you are installing.
[instance_1]
hostname='193.167.1.0'
port = 3306
username = 'test'
password = 'test'

[instance_2]
hostname='194.168.2.0'
port = 3306
username = 'test'
password = 'test'
To do this in custom plugins, follow the steps in this document.
Bulk installation
If you need to install a plugin on multiple servers simultaneously, you can use our plugin bulk installation methods.
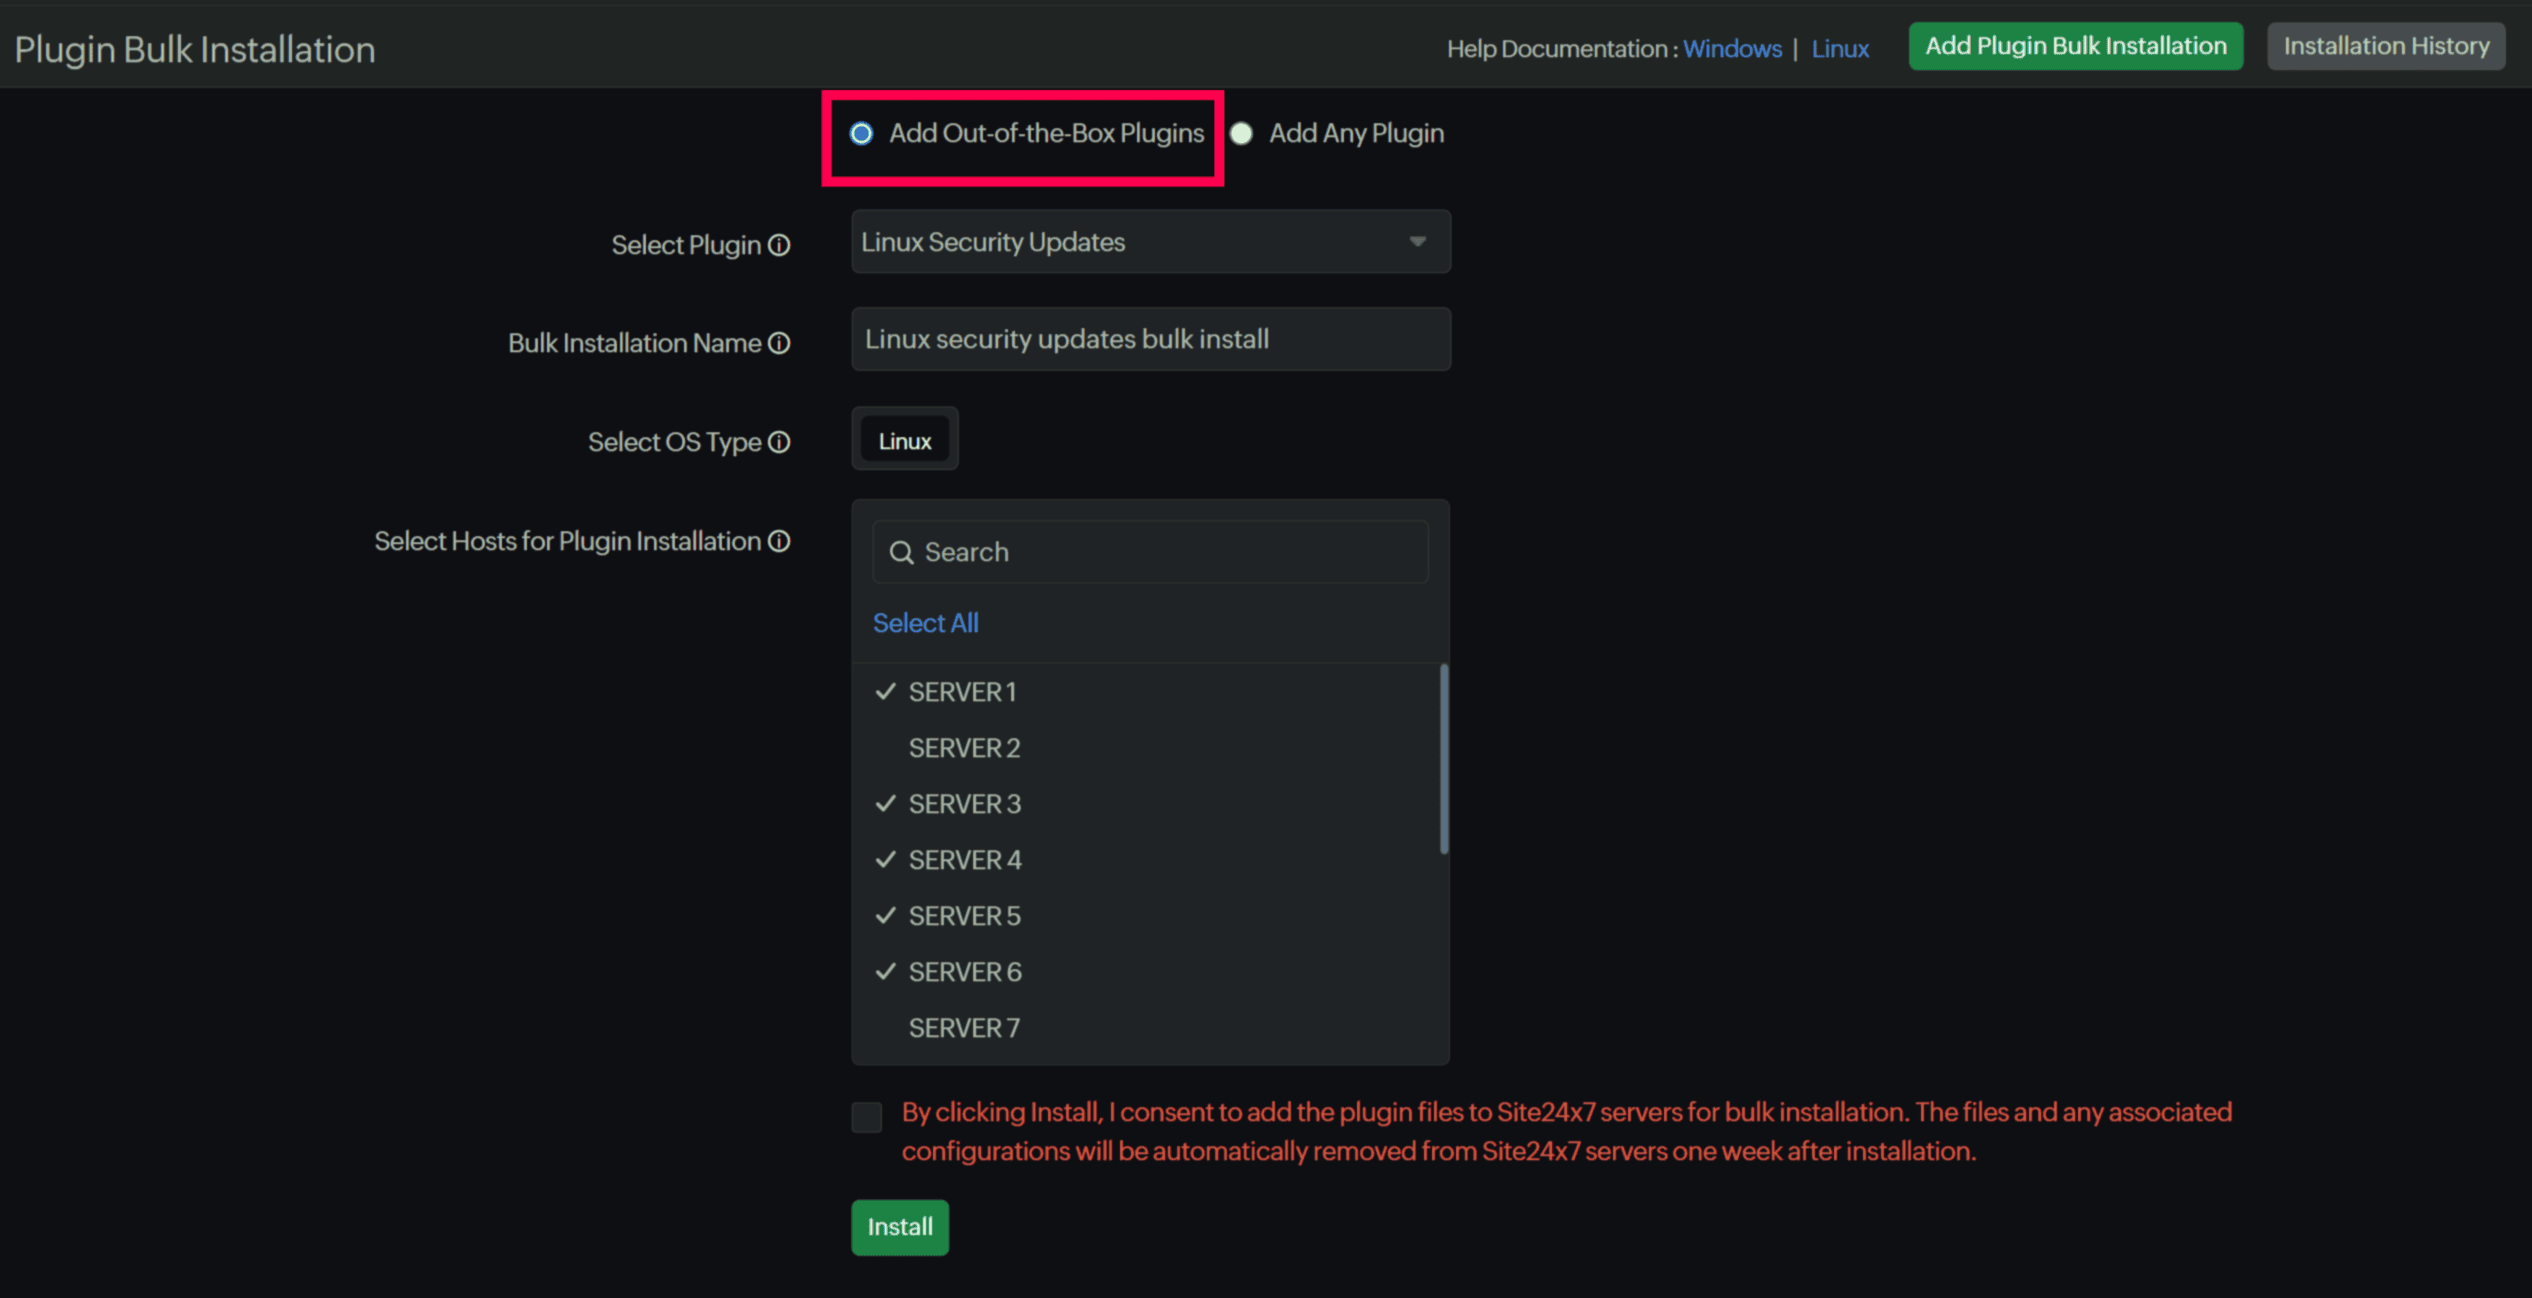
a. Bulk install an out-of-the-box plugin using the web client
You can choose from our supported plugins and quickly deploy predefined plugins through our web client across your servers.
To do this:
- Ensure that the IT automation module is enabled for the Linux/Windows monitoring agent.
- Navigate to Plugins > Plugin Bulk Installation.
- Select the Out-of-the-box Plugins radio button.
- From the Select Plugin dropdown menu, select the plugin you want to add to your servers.
- In the resulting fields, provide a name for the bulk installation, choose the OS type, select all the hosts you want to install the plugin on, and provide relevant configurations as applicable.
- Read and check the disclaimer and click Install. The uploaded plugin will be installed on the selected hosts. If a plugin with the same name already exists on any of the selected hosts, it will be replaced by the new plugin.

To check the installation status, click the Installation History tab at the top-right corner of the page.
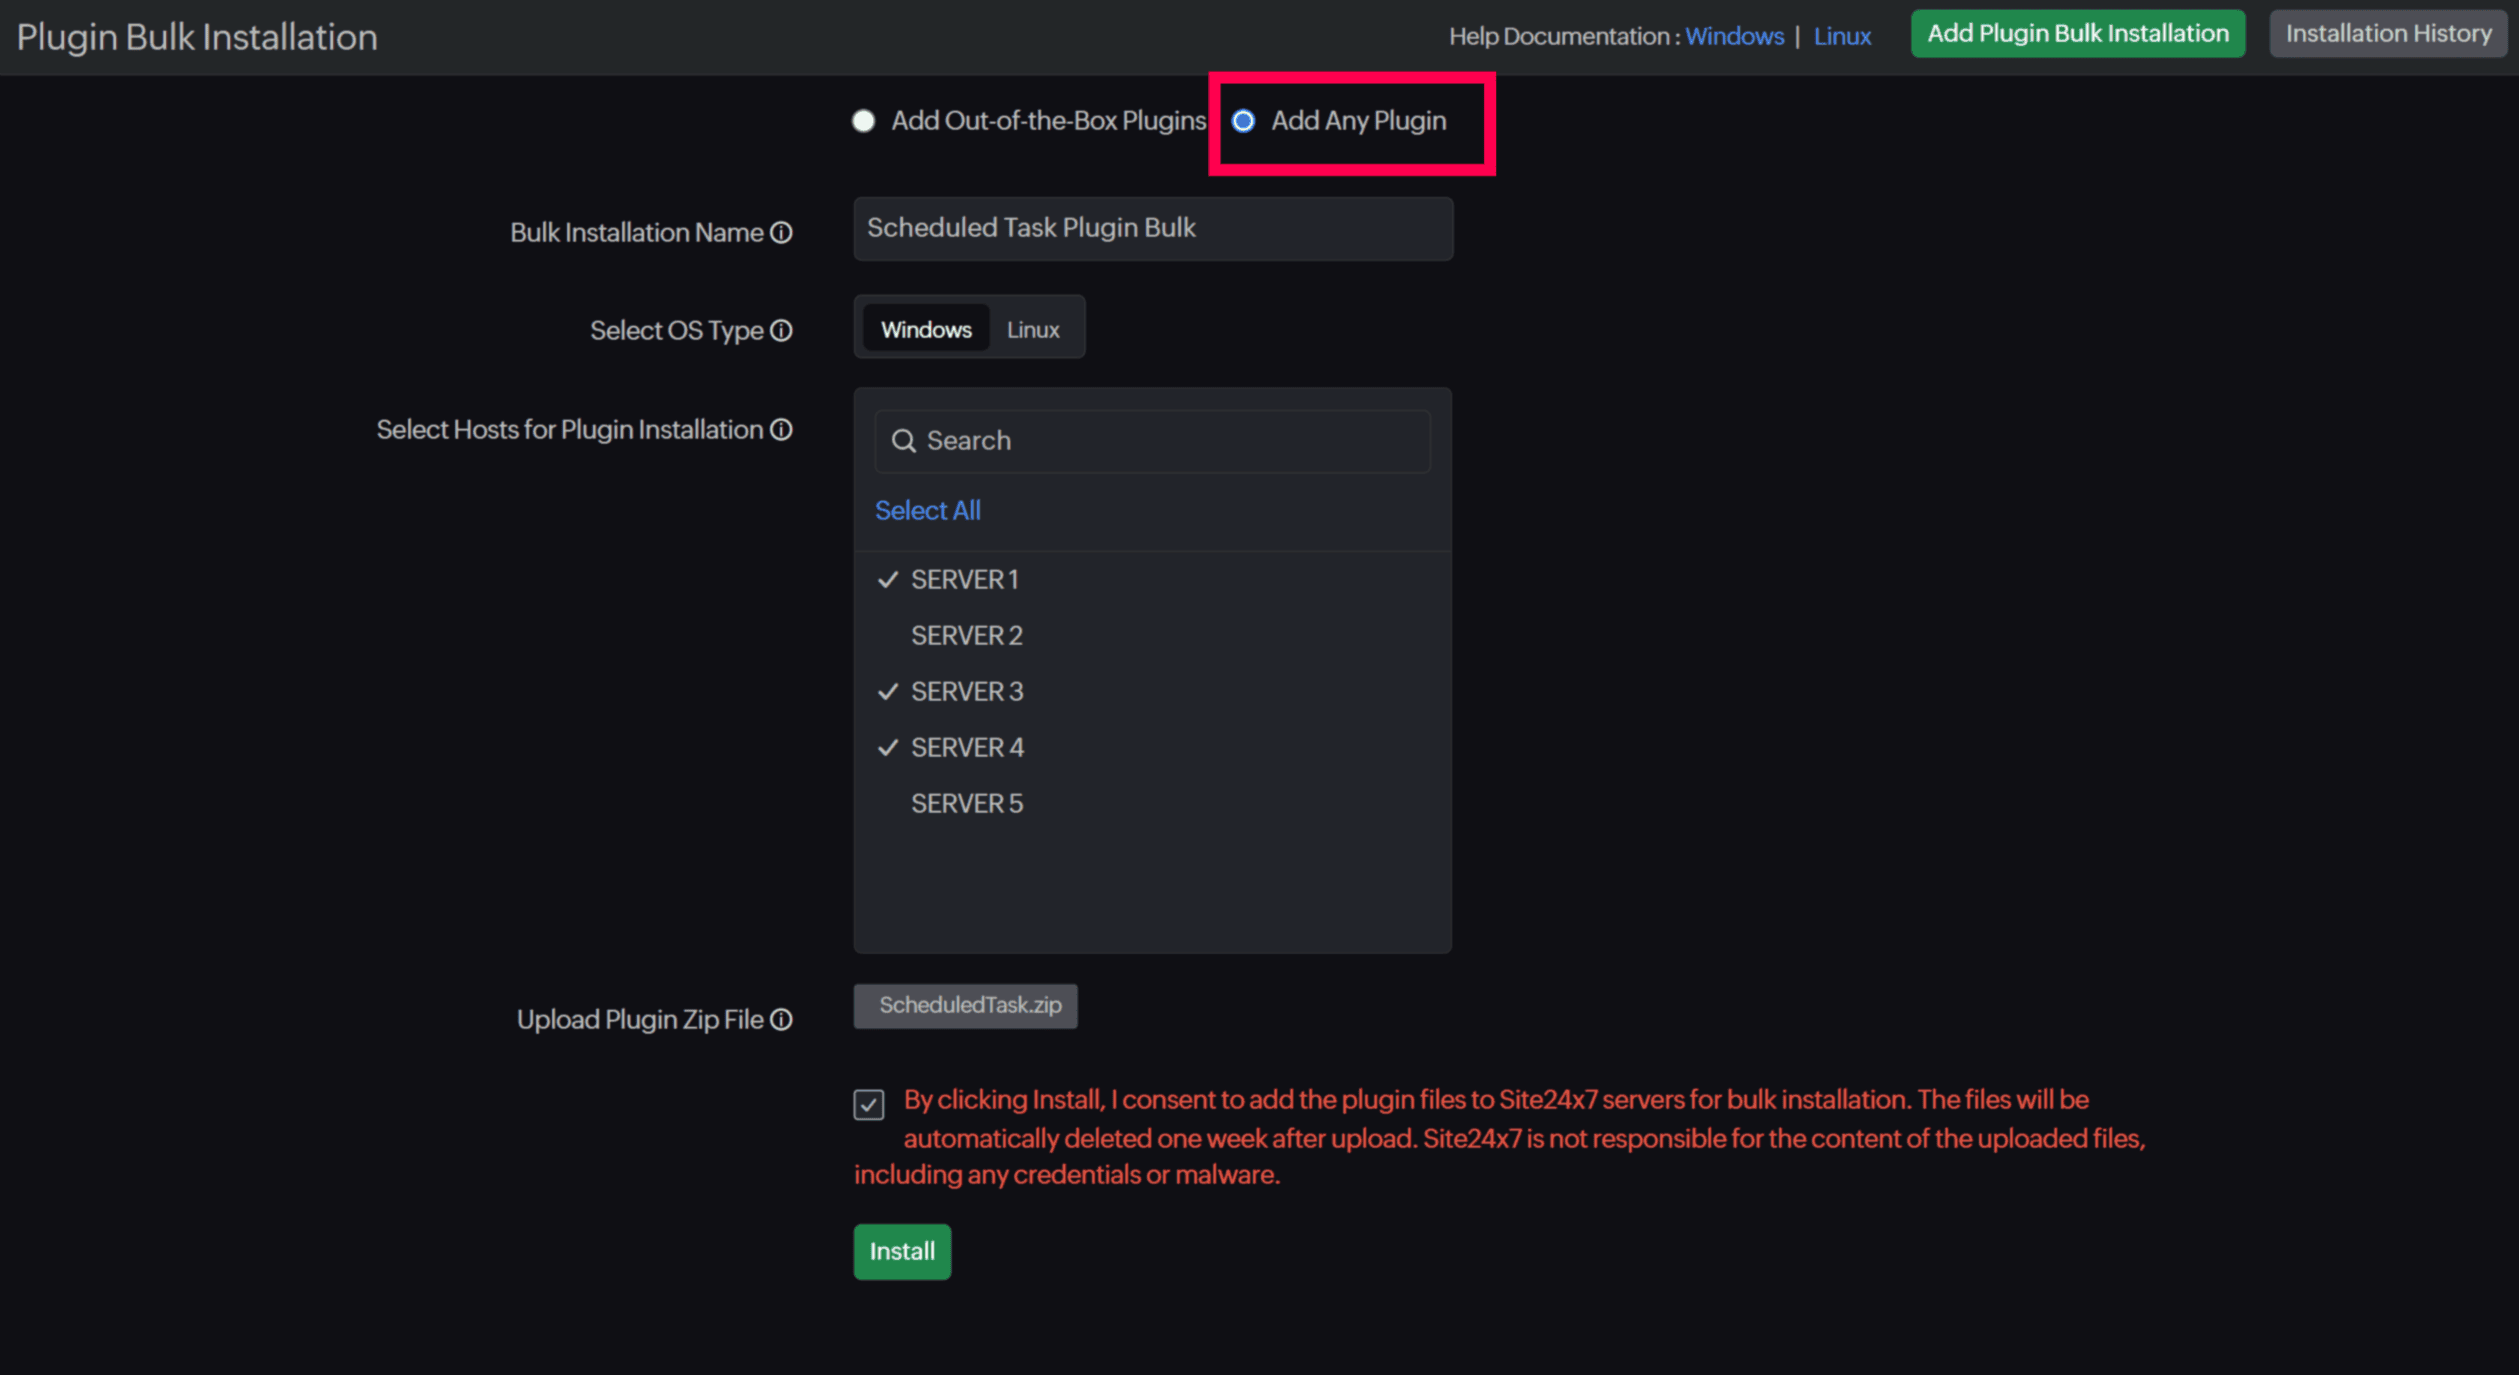
b. Bulk install any plugin on Windows or Linux servers using the web client
You can configure and deploy plugins from our GitHub repository or install custom plugins across Windows and Linux environments.
To do this, configure the plugin files and upload them as a ZIP file for bulk installation.

Refer to the detailed steps in these documents to get started:
Capacity Planning
Capacity Planning provides analytical insights for plugin monitors, helping you determine the required capacity to optimize resources for specific operations or workloads. By analyzing metrics-related data, you can efficiently plan, manage, and allocate additional resources as needed.
Security
All the plugin files are available in Site24x7's GitHub repository. The Site24x7 monitoring agent will communicate to the application monitoring interfaces over standard protocols (that is defined in the plugin script files) to collect the performance data, based on your poll setting. Only the output of the executed plugin will be uploaded to the Site24x7 Data Center. Site24x7 does not store or access any kind of sensitive and confidential data written in the script file. You can choose to disable the addition of plugins while installing the agent.
If the plugin configuration file contains passwords, they will be encrypted during the first data collection. Plugin configurations are stored on your server where the plugin script is located. No configurations are sent to Site24x7; only the collected metrics from application instances are sent to Site24x7 and displayed as graphs.
Folder path for Windows plugins: C:\Program Files (x86)\Site24x7\WinAgent\monitoring\Plugins\
Folder Path for Linux plugins: /opt/site24x7/monagent/plugins/
What's next?
Inventory dashboard
You can view the installation status of your plugins, their associated server monitors, poll interval, versions, and more in the Inventory Dashboard. Go to Plugins > Inventory Dashboard to view all your plugin monitors in one place.
Set thresholds
Once a plugin monitor is added, associate a threshold and availability profile to help the alarms engine decide if a specific resource has to be declared critical or down.
Analyze metrics with logs
In order to analyze your application logs and identify the exact root cause of the issues, you can make configuration changes by adding logs_enabled, log_type_name, and log_file_path to the plugin configuration file.
A log_type_name defines the format in which an application writes logs. Site24x7 supports more than 30 different log types. Additionally, you can also create custom log types.
Example:
logs_enabled ="true"
log_type_name="MySQL Error"
log_file_path="/var/mysql/log/error.txt"
In the plugin script, add logs_enabled, log_type_name, log_file_path under the dictionary name "applog" as:
"applog": {
logs_enabled ="true"
log_type_name="MySQL Error"
log_file_path="/var/mysql/log/error.txt"
                  }
Note that you need to enable the AppLogs at account and server levels to perform these changes.
Steps to enable AppLogs:
- Log in to Site24x7.
- To enable AppLogs at account level, go to Admin > AppLogs > Settings. Configure Yes to collect the application logs from the servers using AppLogs.
- To enable AppLogs at server level, go to Server > Server Monitor > Servers. Select the Server Monitor, navigate to the AppLogs tab, and click on Enable AppLogs.
Licensing
The first plugin added for a server monitor is free. After that, each plugin monitor is considered as a basic monitor.
Troubleshooting tips
- Error handling messages for Plugins
- Possible reasons why my Linux plugin has not been added to my Site24x7 account
- Possible reasons why my Windows plugin is not added to my account
- Why is my MySQL plugin not getting added to Site24x7?
- Possible reasons why your Nagios plugin is not working
- What happens if I delete a plugin monitor from the Site24x7 web client?
- Under what cases does a plugin monitor move to the Ignored List?
For the complete list of articles, refer our knowledge base for plugin integrations.
Related articles
-
On this page
- How does it work
- Get started
- Over 100 ready-to-install plugin integrations
- How to set up ready-to-install plugin integrations
- Build custom plugins
- Add multiple configurations in a single plugin script
- Bulk installation
- Capacity planning
- Security
- What's next?
- Licensing
- Troubleshooting tips
