
Kubernetes container process monitoring
Monitor the processes running in each container of your Kubernetes cluster. Pinpoint which process within a container is driving up CPU or memory usage, all without needing to access the container.
Industry-wise use cases and benefits
Here are a few use cases and benefits:
| Industry | Use case | Benefit |
|---|---|---|
| E-commerce | Differentiate main app spikes from caching sidecar tasks (e.g., Redis syncs) during flash sales. | Prevents latency spikes and Out Of Memory (OOM) kills before checkout flows collapse. |
| FinTech (banking) | Correlate resource usage across transaction engines, fraud checks, and audit logging. | Provides strict compliance auditing without granting engineers direct shell execution access to secure pods. |
| Healthcare | Track ephemeral health checks, data pipeline syncs, and long-running patient record services. | Automatically registers new processes during workload shifts to preserve system availability and auditability. |
| SaaS (tech) | Isolate core microservices from telemetry sidecars (Fluent Bit, Istio proxy, and other agents). | Pinpoints shared container resource consumption to isolate vendor issues from application issues. |
Prerequisites
- Install the Kubernetes agent version 22.3.00 or above.
- For existing customers, upgrade your Kubernetes agent to version 22.3.00 or above.
How to add a process to your Kubernetes monitoring
You can monitor a process running inside a Kubernetes container using one of the following methods:
Method 1: Manual addition
For immediate and targeted container process selection, follow the steps below:
- Log in to your Site24x7 account.
- Go to K8s from the left navigation menu.
- Select your cluster, then click Containers and choose your container.
- Go to the Processes tab.
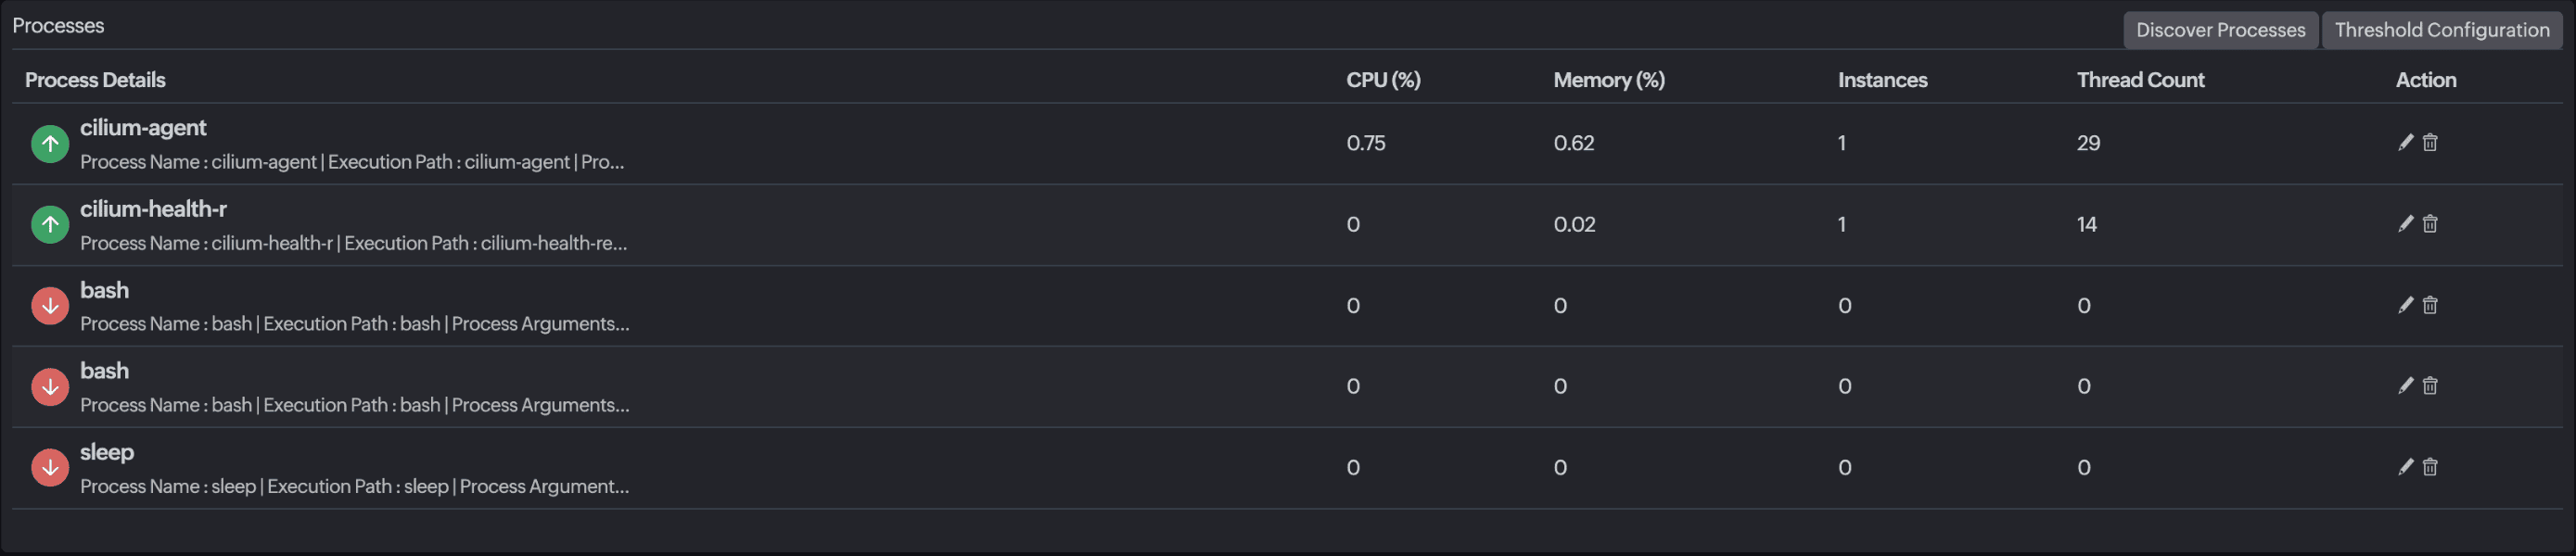
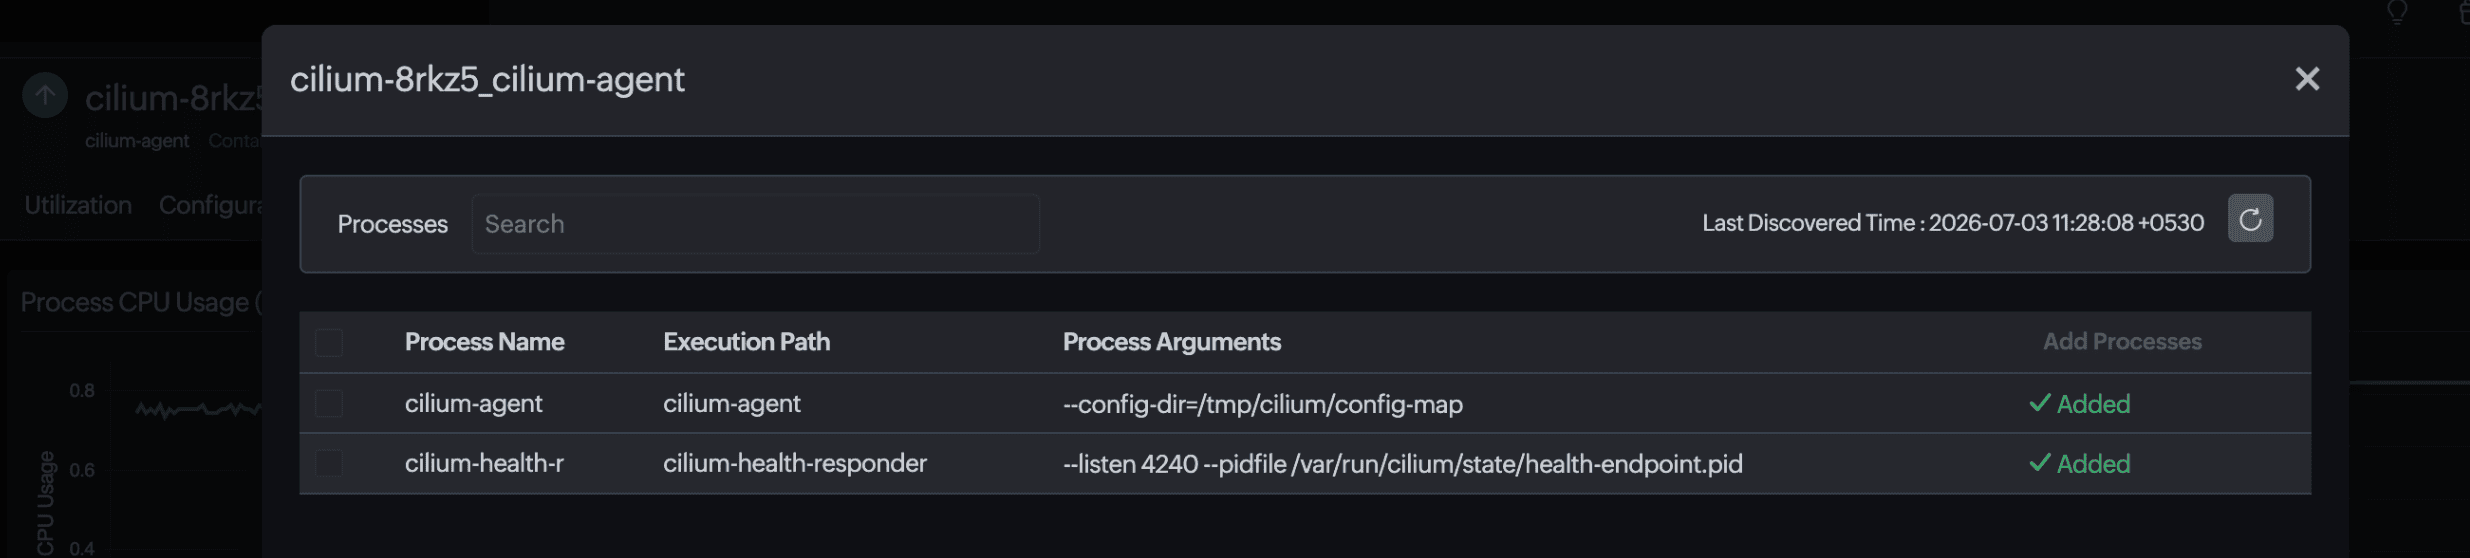
- Click Discover Processes to view all processes currently running in the container.
- Select the process you want to track, and click Add to start monitoring.
Method 2: Configuration rules
To automate the container discovery, follow the steps below:
- Create configuration rules that apply once a container is added for monitoring.
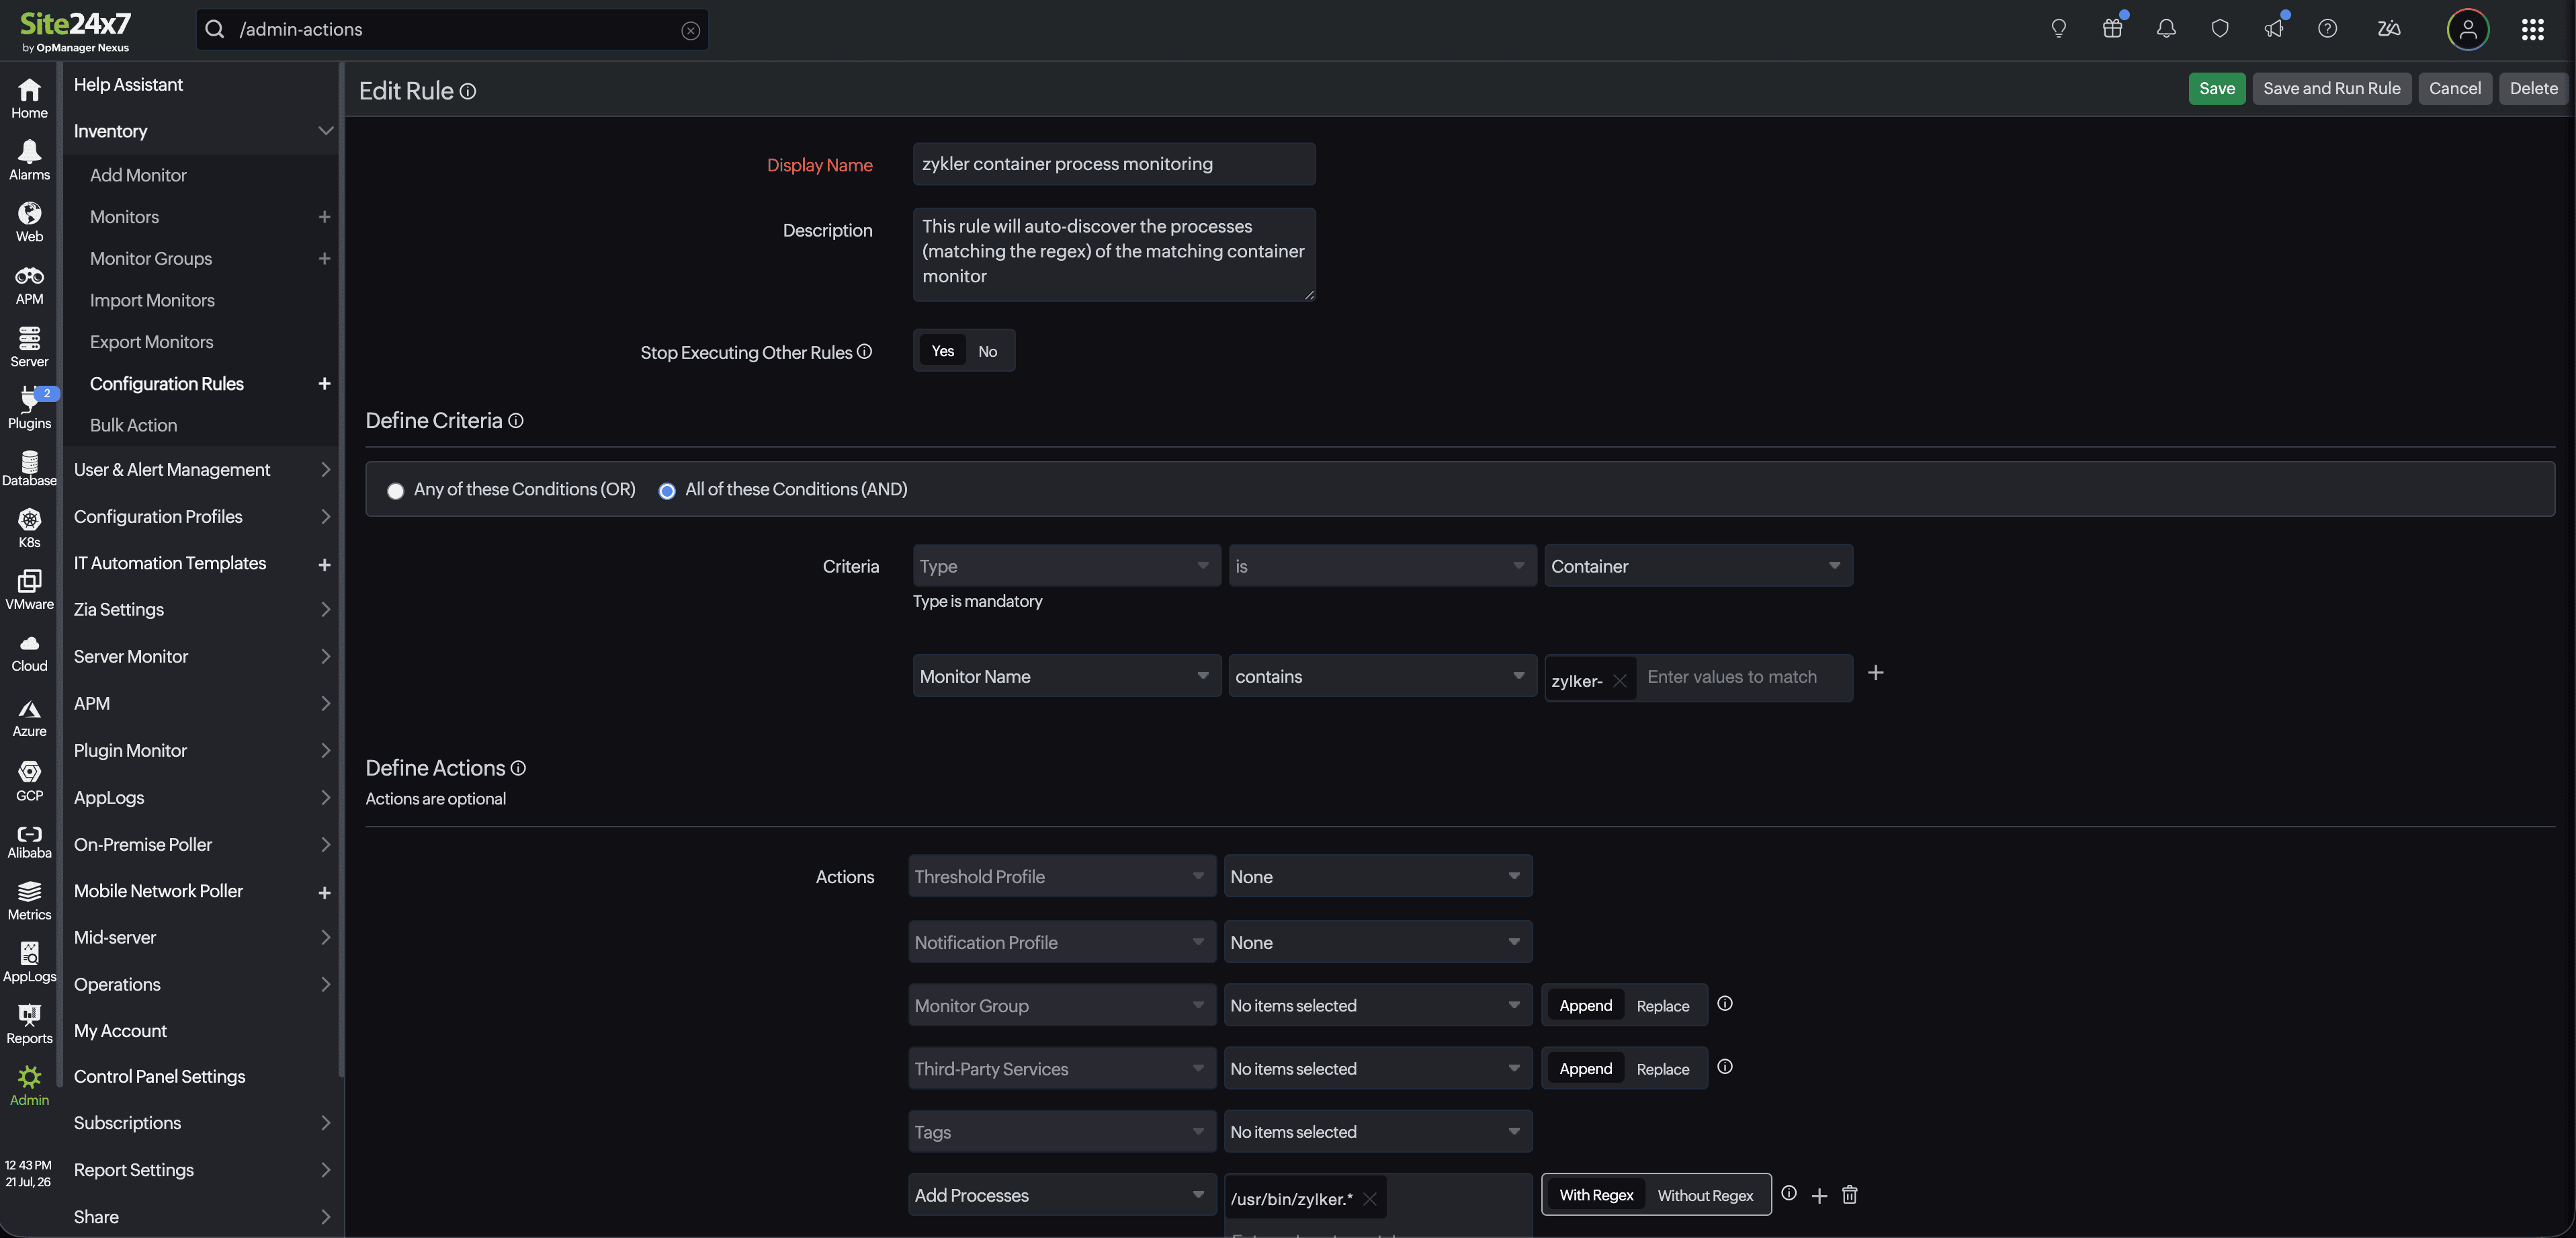
- Under the Define Criteria section, in Criteria, select Container from the drop-down menu as the monitor type.
- Under the Define Actions section, configure the actions to be made by the monitors that satisfy the conditions set in the Define Criteria section.
- Select Add Processes and enter the path file details.
- Toggle between the options below:
- With Regex: Matches the process command-line arguments or absolute path against a regular expression, enabling flexible and precise process identification. For example:
zylker###/usr/bin/zylker###-conf_file.* - Without Regex: Matches the exact text entered in the input field against the process command-line arguments or absolute path. For example:
python3###/usr/bin/python3###main.py --user=zylker --role=admin
- With Regex: Matches the process command-line arguments or absolute path against a regular expression, enabling flexible and precise process identification. For example:
Understanding regex patterns
If multiple instances of a process run inside a container but you only want to monitor those that start with a specific configuration file, use a regex pattern (ex: -conf_file=/etc/zylker/.*). This allows you to match only the command-line arguments that contain the pattern, ensuring that only relevant processes are picked up for monitoring while others are ignored.
Regex syntax:
<process-name>###<process-path>###<process-args>
Sample process:
/usr/bin/zylker -conf_file=/etc/zylker/zylker.json/usr/bin/zylker -conf_file=/etc/zylker/zylker1.json
Sample regex:
zylker###/usr/bin/zylker###-conf_file.*
| Syntax | Description | Example |
|---|---|---|
| <process-name> | The name of the process or executable. | zylker |
| <process-path> | The absolute path to the process executable. | /usr/bin/zylker |
| ### | A delimiter to separate the process path, name, and arguments. This is mandatory if you provide more than one value. | ### |
| <process-args> | The command-line arguments passed to the process. | -conf_file=/etc/zylker/zylker.json |
Note: This configuration supports multiple process entries.
View Kubernetes container processes
To view the processes running inside a container:
- Go to K8s from the left navigation menu.
- Select the cluster, then click Containers and select the required container.
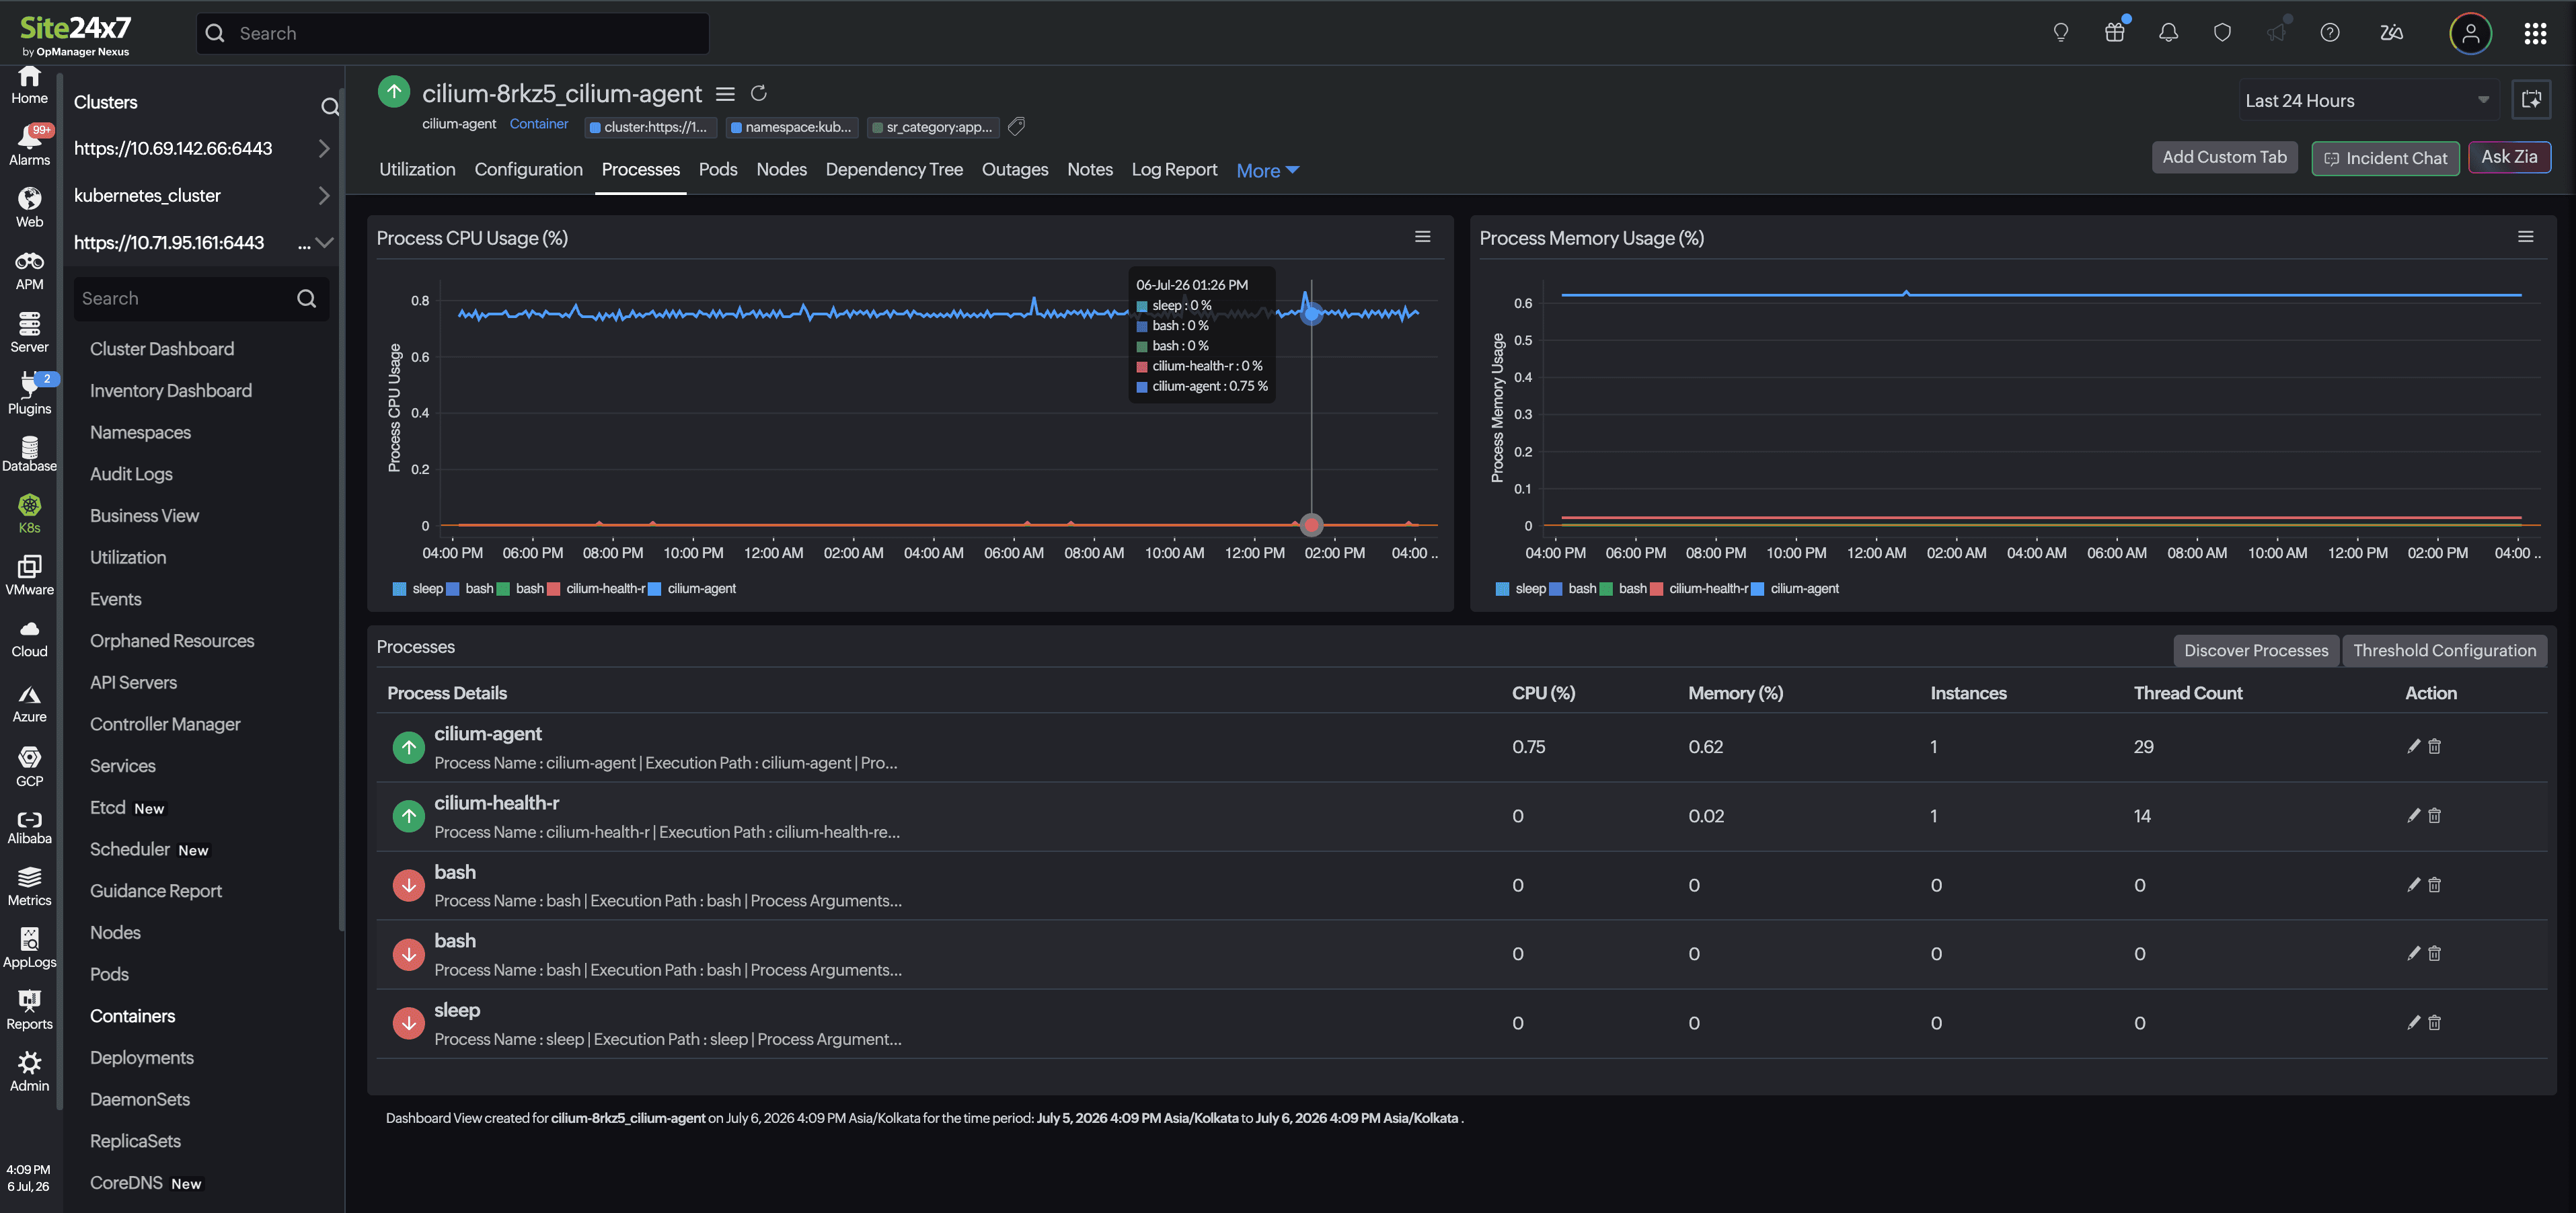
- Click the Processes tab.
Monitor data
Processes
| Metric name | Description | Units |
|---|---|---|
| Process CPU Usage (%) | Trend chart showing the CPU consumed by each monitored process over the selected time period. Hover over the chart to see the CPU usage of each process at a specific point in time. | Percentage |
| Process Memory Usage (%) | Trend chart showing the memory consumed by each monitored process over the selected time period. Hover over the chart to see the memory usage of each process at a specific point in time. | Percentage |
| Process Details | The process name and execution path. An upward arrow indicates the monitoring is up and running; a downward arrow indicates the monitoring is down. | Text |
| CPU (%) | The percentage of CPU used by the process. | Percentage |
| Memory (%) | The percentage of memory used by the process. | Percentage |
| Instances | The number of instances of the process running inside the container. | Count |
| Thread Count | The number of threads running in the process. | Count |
Use the Discover Processes button to find and add new processes running inside the container for monitoring. Use the Threshold Configuration button to set CPU, memory, instance, or thread count thresholds for the processes listed.