Amazon ECS logs
Amazon Elastic Container Service (ECS) is a fully managed container orchestration service that automates the deployment, management, and scaling of container-based applications.
Monitor Amazon ECS logs to:
- Identify and troubleshoot issues with your containerized applications.
- Ensure that your applications are running smoothly and efficiently.
- Gain insights into the performance of your applications and infrastructure.
ECS supports two launch types: Amazon Elastic Compute Cloud (EC2) and AWS Fargate. With EC2, you can gain full access and control of your infrastructure as your containerized applications run on EC2 instances that you register to your Amazon ECS cluster. With Fargate, you only need to manage your application as it is serverless, and AWS fully manages the infrastructure and containers.
You can choose one of the below approaches based on the launch type to forward logs from Amazon ECS to AppLogs.
| Launch type | EC2 | Fargate |
| Collecting logs via the Site24x7 Server Monitoring agent | Yes | No |
| Collecting logs via CloudWatch using the Lambda function | Yes | Yes |
| Collecting logs using the FireLens plugin | Yes | Yes |
Collecting logs via the Site24x7 Server Monitoring agent
- Log in to your Site24x7 account.
- Download and install the Site24x7 Server Monitoring agent (Windows | Linux) on the EC2 instance.
- Go to Admin > AppLogs > Log Profile and click Add Log Profile.
- Select AWS ECS Logs from the Choose the Log Type drop-down.
- By default, ECS containers are configured to write logs to the following file path:
For Widows: C:\ProgramData\Docker\containers\*\*.log
For Linux: /var/lib/docker/containers/*/*.log - Choose the server from the Associate this log profile with these servers drop-down.
- Click Save.
To edit the log type, you can navigate to Admin > AppLogs > Log Type > click the log type you want to edit.
Log pattern
json $log$ $stream$ $time:date:yyyy-MM-dd'T'HH:mm:ss.SSS'Z'$ $container_name$ $container_hostname$ $containerid$ $cluster_name$ $image$ $image_id$ $Labels:json-object$
Refer to the section in this document to customize the log pattern based on your log format.
This is the default pattern defined by Site24x7 for parsing AWS ECS logs based on the sample mentioned below.
Sample log
{"log":"Starting image","stream":"stdout","time":"2019-06-04T11:29:54.295671087Z","container_name" : "/ecs-agent","container_hostname" : "3e9ceb8286e3", "containerid": "323e26da-67d4-4ae8-ad17-a30abcb9e007", "image" : "amazon/amazon-ecs-agent:latest", "image_id": "sha256:c3503596a2197b94b7b743544d72260374c8454453553d9da5359146b9e2af98","Labels": {"org.label-schema.build-date": "2022-11-16T20:43:16.419Z","org.label-schema.license": "Elastic License"},"cluster_name":"ECS"}
The above sample log can be separated into the following fields, each of which will take its respective value from here and will then be uploaded to Site24x7.
| Field name | Field value |
| log | Starting image |
| stream | stdout |
| time | 2019-06-04T11:29:54.295671087Z |
| container_name | /ecs-agent |
| container_hostname | 3e9ceb8286e3 |
| containerid | 323e26da-67d4-4ae8-ad17-a30abcb9e007 |
| cluster_name | ECS |
| image | amazon/amazon-ecs-agent:latest |
| image_id | sha256:c3503596a2197b94b7b743544d72260374c8454453553d9da5359146b9e2af98 |
| Labels | Labels.key Labels.value org.label-schema.license Elastic License org.label-schema.build-date 2022-11-16T20:43:16.419Z |
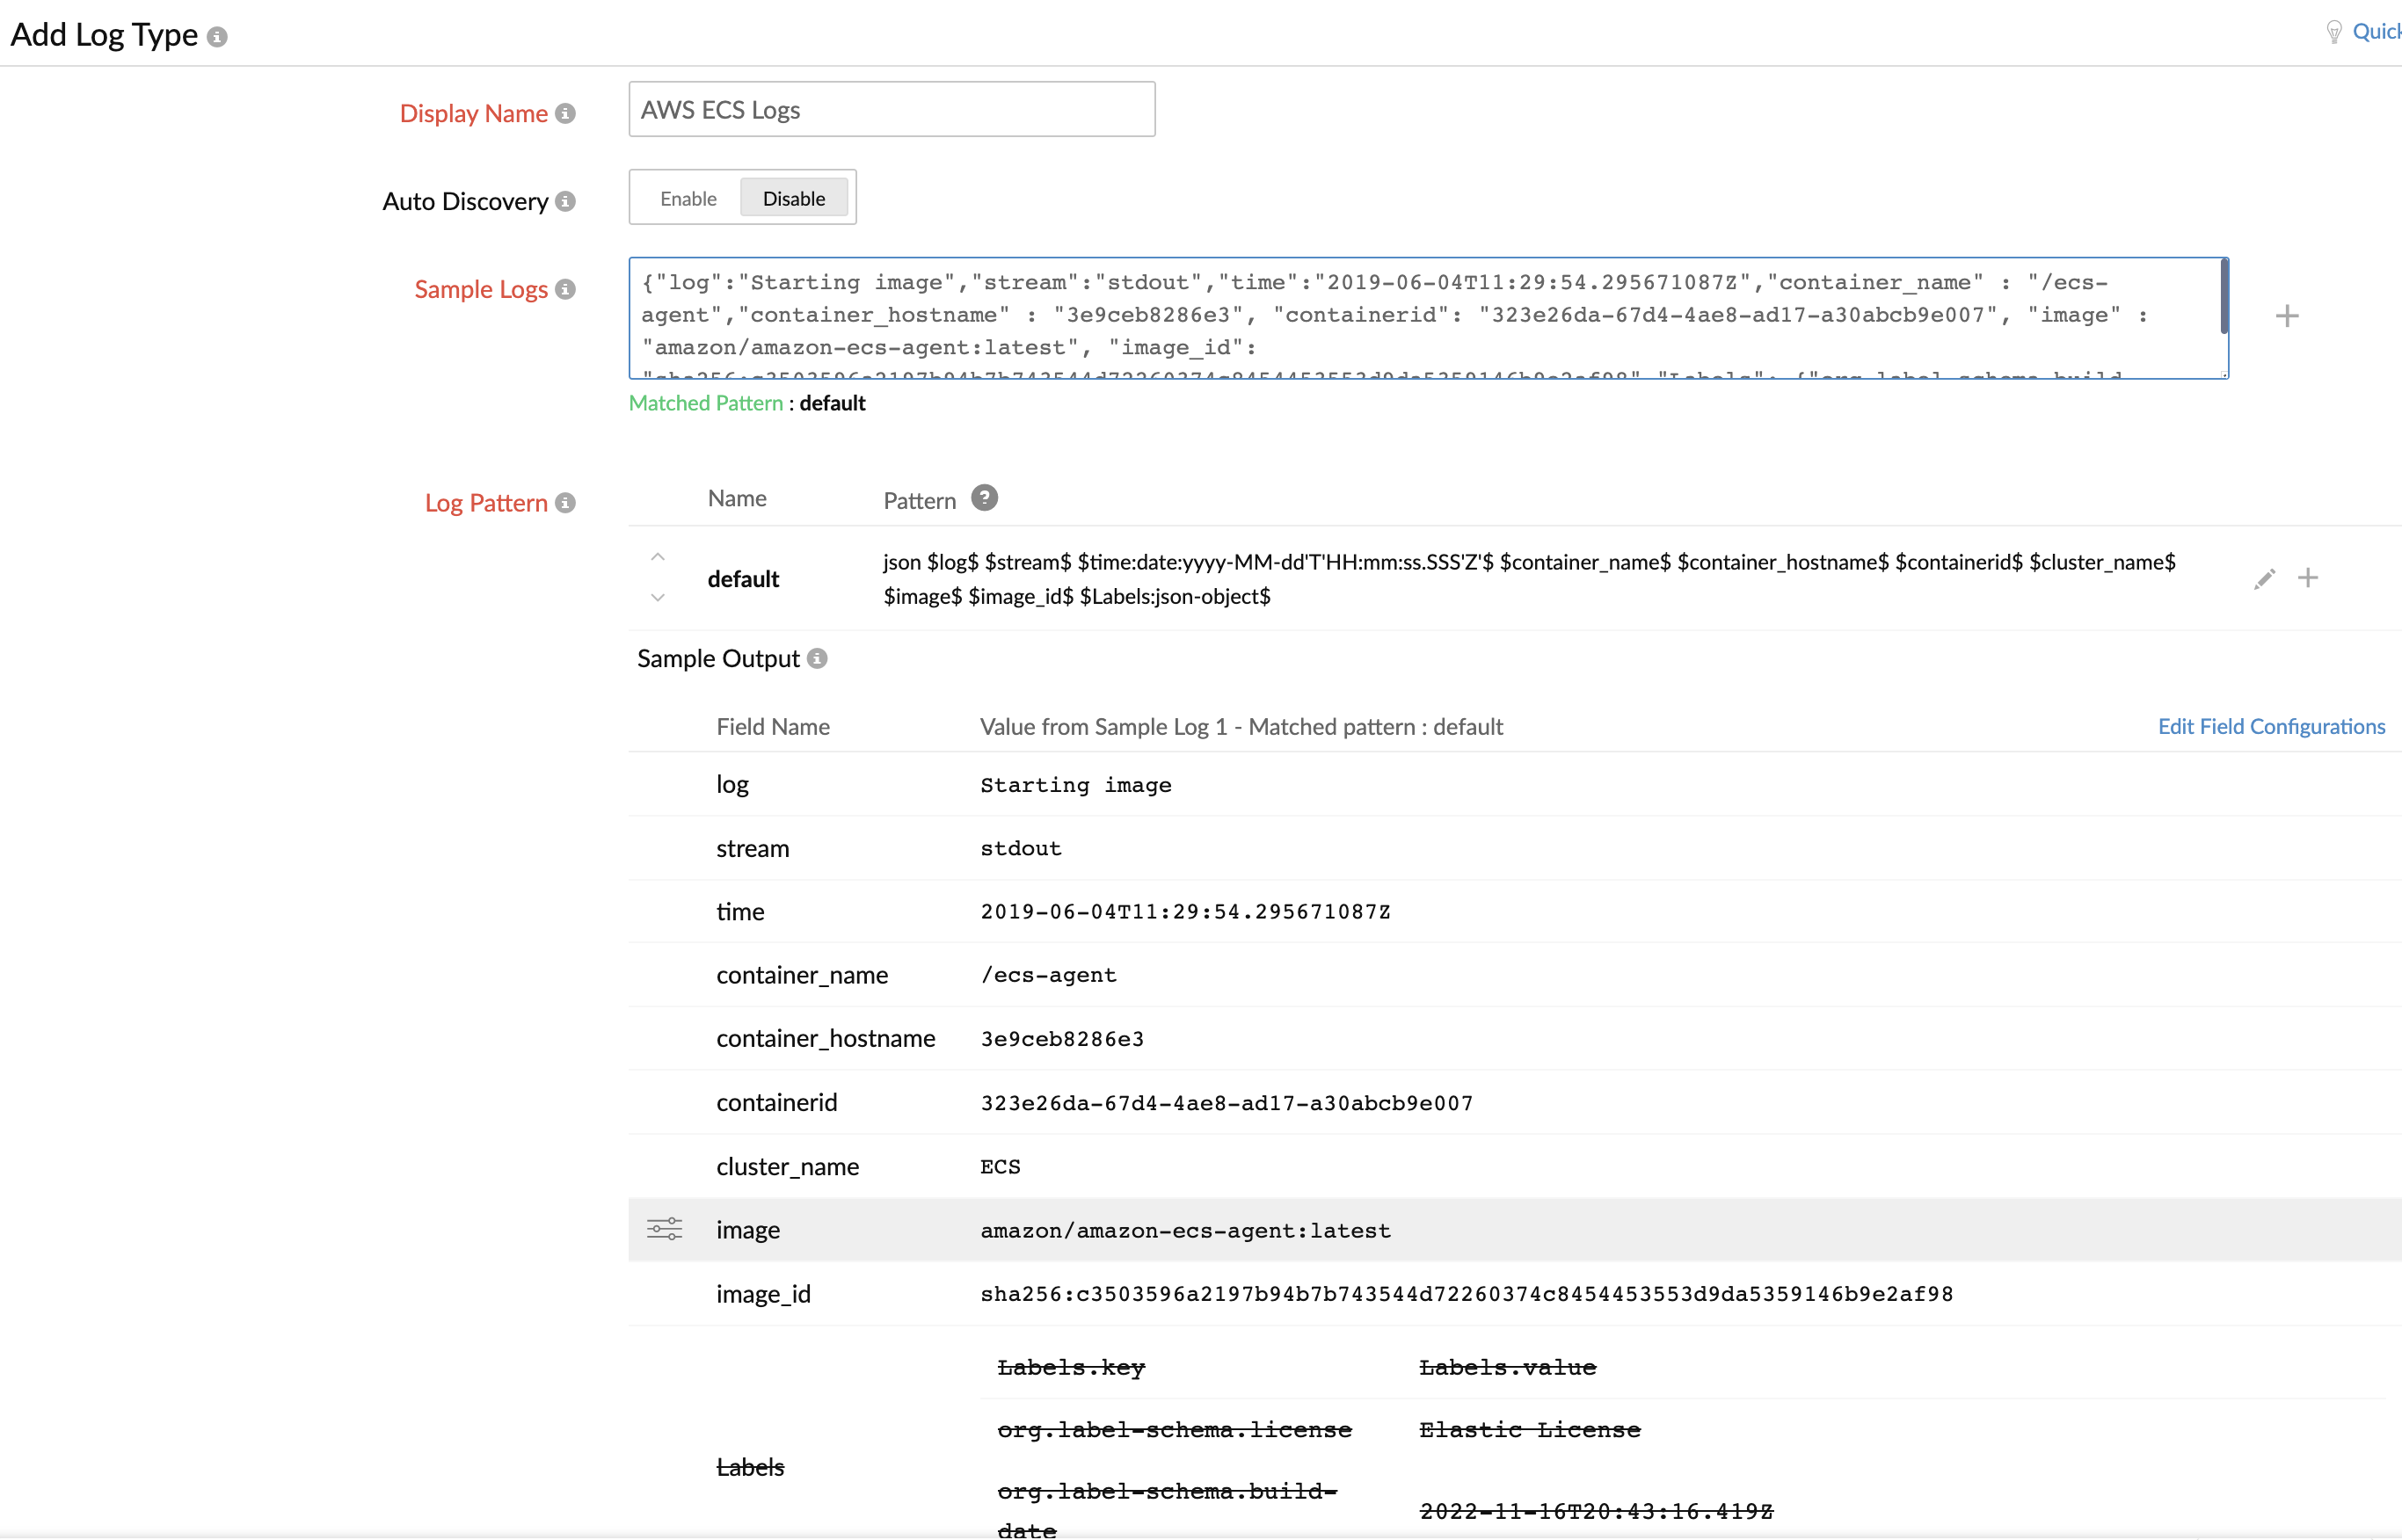
1. If you want the Labels information, you can enable it by clicking Edit Field Configurations > Toggle Ignore this Field at Source and toggling to No. Refer to this documentation for more details on filtering log lines at the source.
2. Our custom parser extracts the fields that have the container's meta information, such as container_name, container_hostname, cluster_name, image, image_id, and Labels.
That's it. You are set to monitor the Amazon ECS logs with AppLogs.
Collecting logs via CloudWatch using the Lambda function
Using the awslogs log driver and a Lambda function, you can forward the container logs to Site24x7 via CloudWatch logs.
To do that, you need to define the log driver as awslogs in the application container in your task definition.
The following shows a snippet of a task definition that configures the awslogs log driver:
{
"logConfiguration": {
"logDriver": "awslogs",
"options": {
"awslogs-group": "sample-application/container",
"awslogs-region": "us-east-2",
"awslogs-create-group": "true",
"awslogs-stream-prefix": "sample-application"
}
}
}
To use the awslogs-create-group option to create your log groups, your task execution IAM role policy or EC2 instance role policy must include the logs: CreateLogGroup permission. Otherwise, you have to create the log group manually. Please refer to Amazon's documentation for more information about using the awslogs log driver in your task definitions.
Then, follow the below steps to collect logs via CloudWatch.
- From the Site24x7 web console, navigate to Admin > AppLogs > Log Profile > Add Log Profile, and then:
- Enter a name for your Log Profile in the Profile Name field.
- Choose AWS ECS Logs from the Choose the Log Type drop-down.
- Click the
 icon beside the Choose the Log Type drop-down.
 - This will open the Edit Log Type window.
- Replace the following sample log in the Sample Logs field:
{"timestamp":1556785146165,"message":"Starting image"} - Click the
 icon beside the Log Pattern field, update the below log pattern, and click the
  icon to save the pattern:
json $timestamp:date:unixm$ $message$ $ecs_cluster:config:@filepath:0$ $container_name:config:@filepath:1$
- Click Save to save the log type.
- Replace the following sample log in the Sample Logs field:
- Now, choose Amazon Lambda from the Log Source drop-down.
- Click Save to save the Log Profile.
- Follow the instructions in the AWS setup section of this document to collect the CloudWatch logs and view them in Site24x7. However, make sure you choose AWS ECS Logs, its logtypeconfig, and the ECS container log group, and continue the instructions defined in the same document.
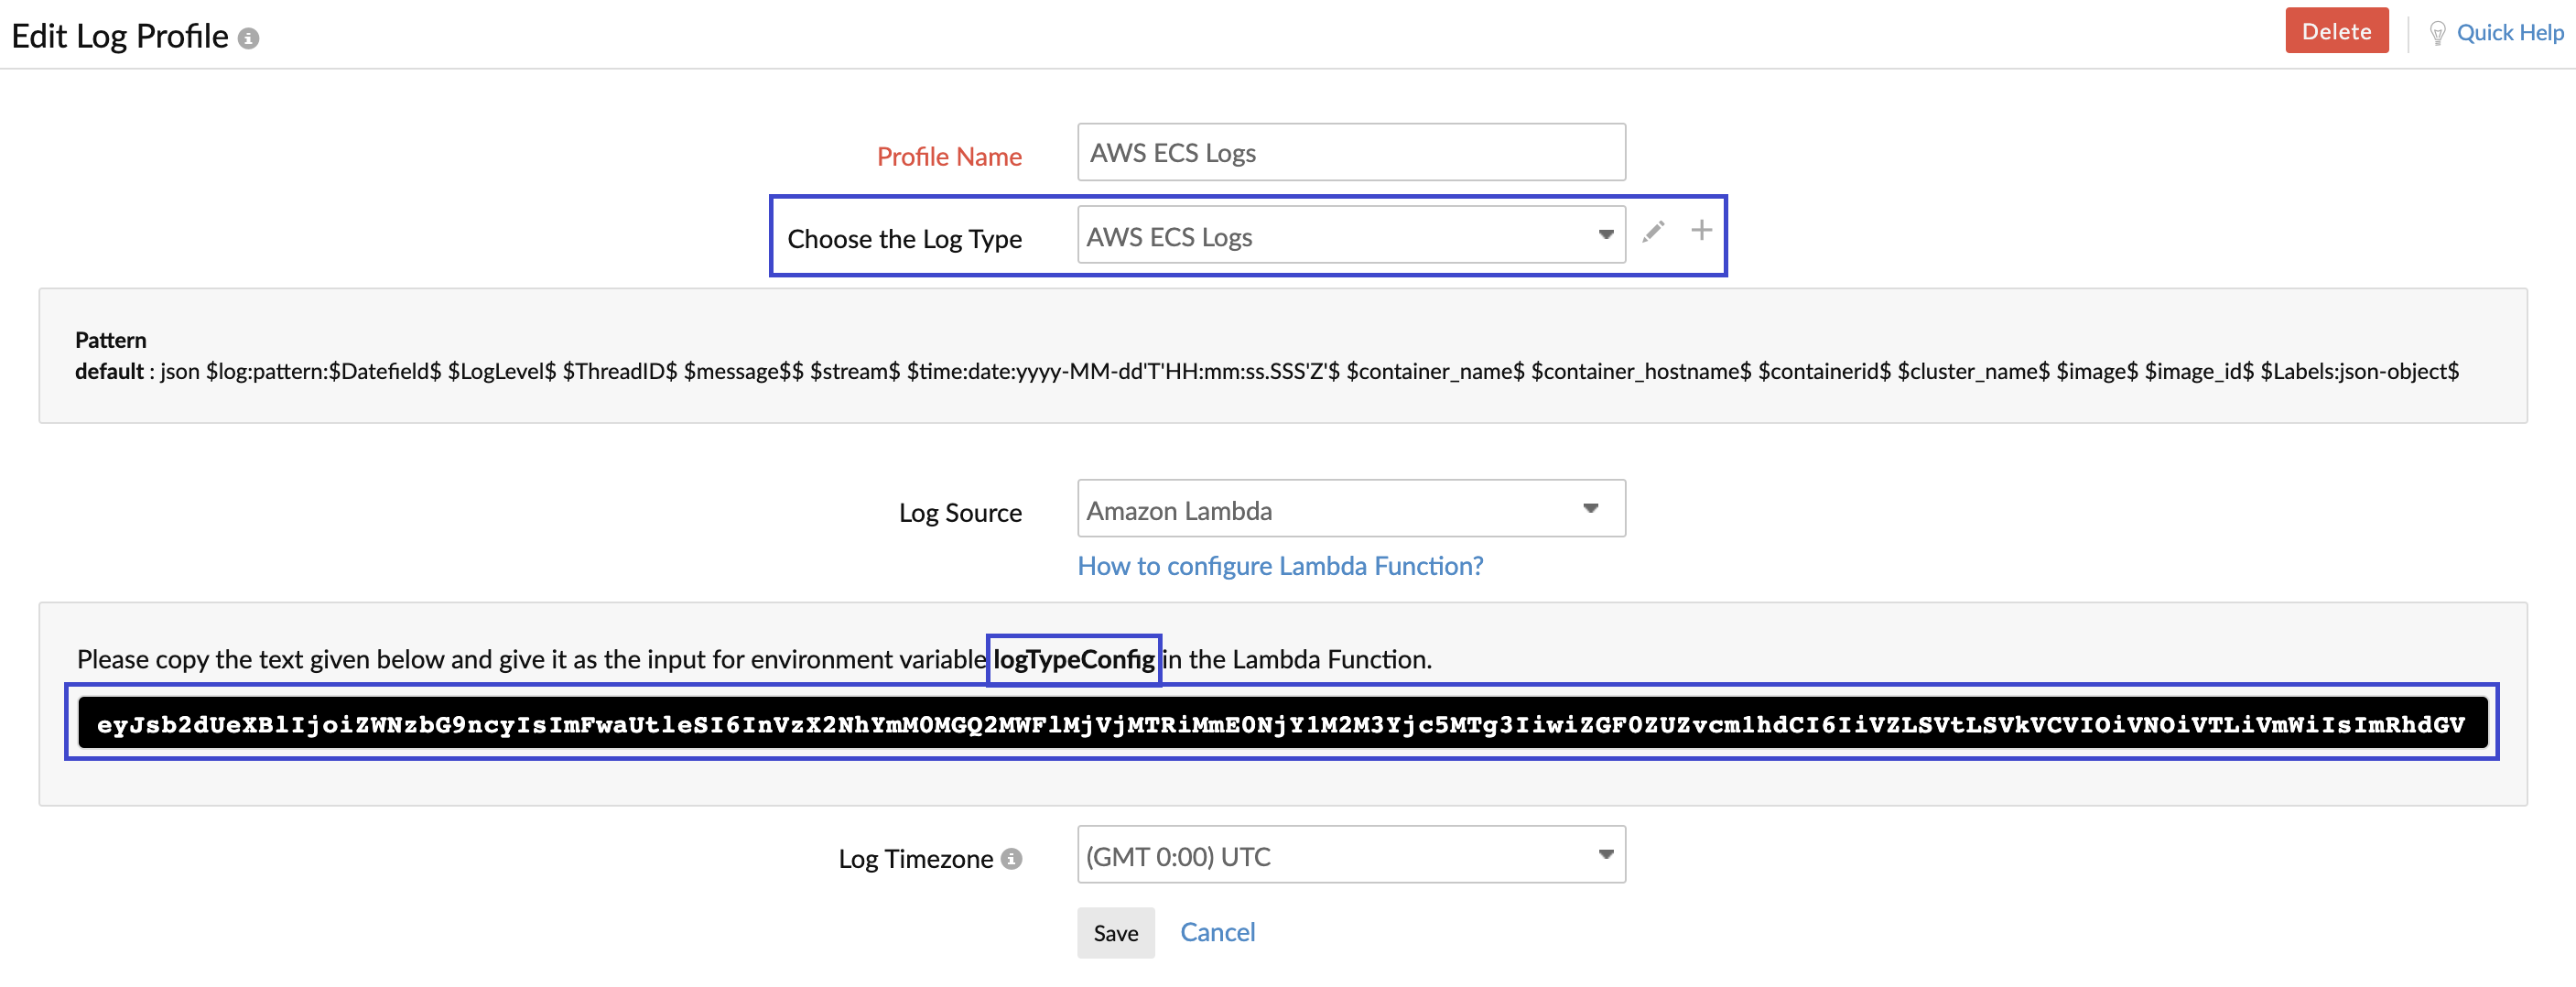
That's it. You are set to monitor the Amazon ECS logs with AppLogs.
Collecting logs using the FireLens plugin
- Log in to your Site24x7 account.
- Go to Admin > AppLogs > Log Type and click Add Log Type.
- Select AWS ECS Logs from the Log Type drop-down.
- Enter the Display Name.
- Update the existing sample logs with the below sample logs in the Sample Logs field.
{
"date": 1684129842.901607,
"log": "Starting image",
"container_id": "e961d005829f458dasd32342377ffec-1159264102",
"container_name": "sample-fargate-app",
"source": "stderr",
"ecs_cluster": "Applog_ECS_CLUSTER",
"ecs_task_arn": "arn:aws:ecs:us-east-2:12736187623:task/Applog_ECS_CLUSTER/e961d005829f458dasd32342377ffec",
"ecs_task_definition": "fargate-task-definition:1"
}
- Click the
 icon beside the Log Pattern field, update the below log pattern, and click the
  icon to save the pattern.
json $date:date:unixm$ $ecs_task_arn$ $container_name$ $log$ $ecs_cluster$ $source$ $container_id$ $ecs_task_definition$

NoteRefer to the section in this document to customize the log pattern based on your log format.
- Enable API Upload.
- Note down the URL as you need it when you update the container configurations with log driver details.

- Click Save and proceed to Log Profile.
Note
You don't need to create a Log Profile. Please proceed with the AWS FireLens configuration mentioned below.
AWS FireLens configuration
You can use FluentBit HTTP output plugin in FireLens to collect logs from the ECS Fargate.
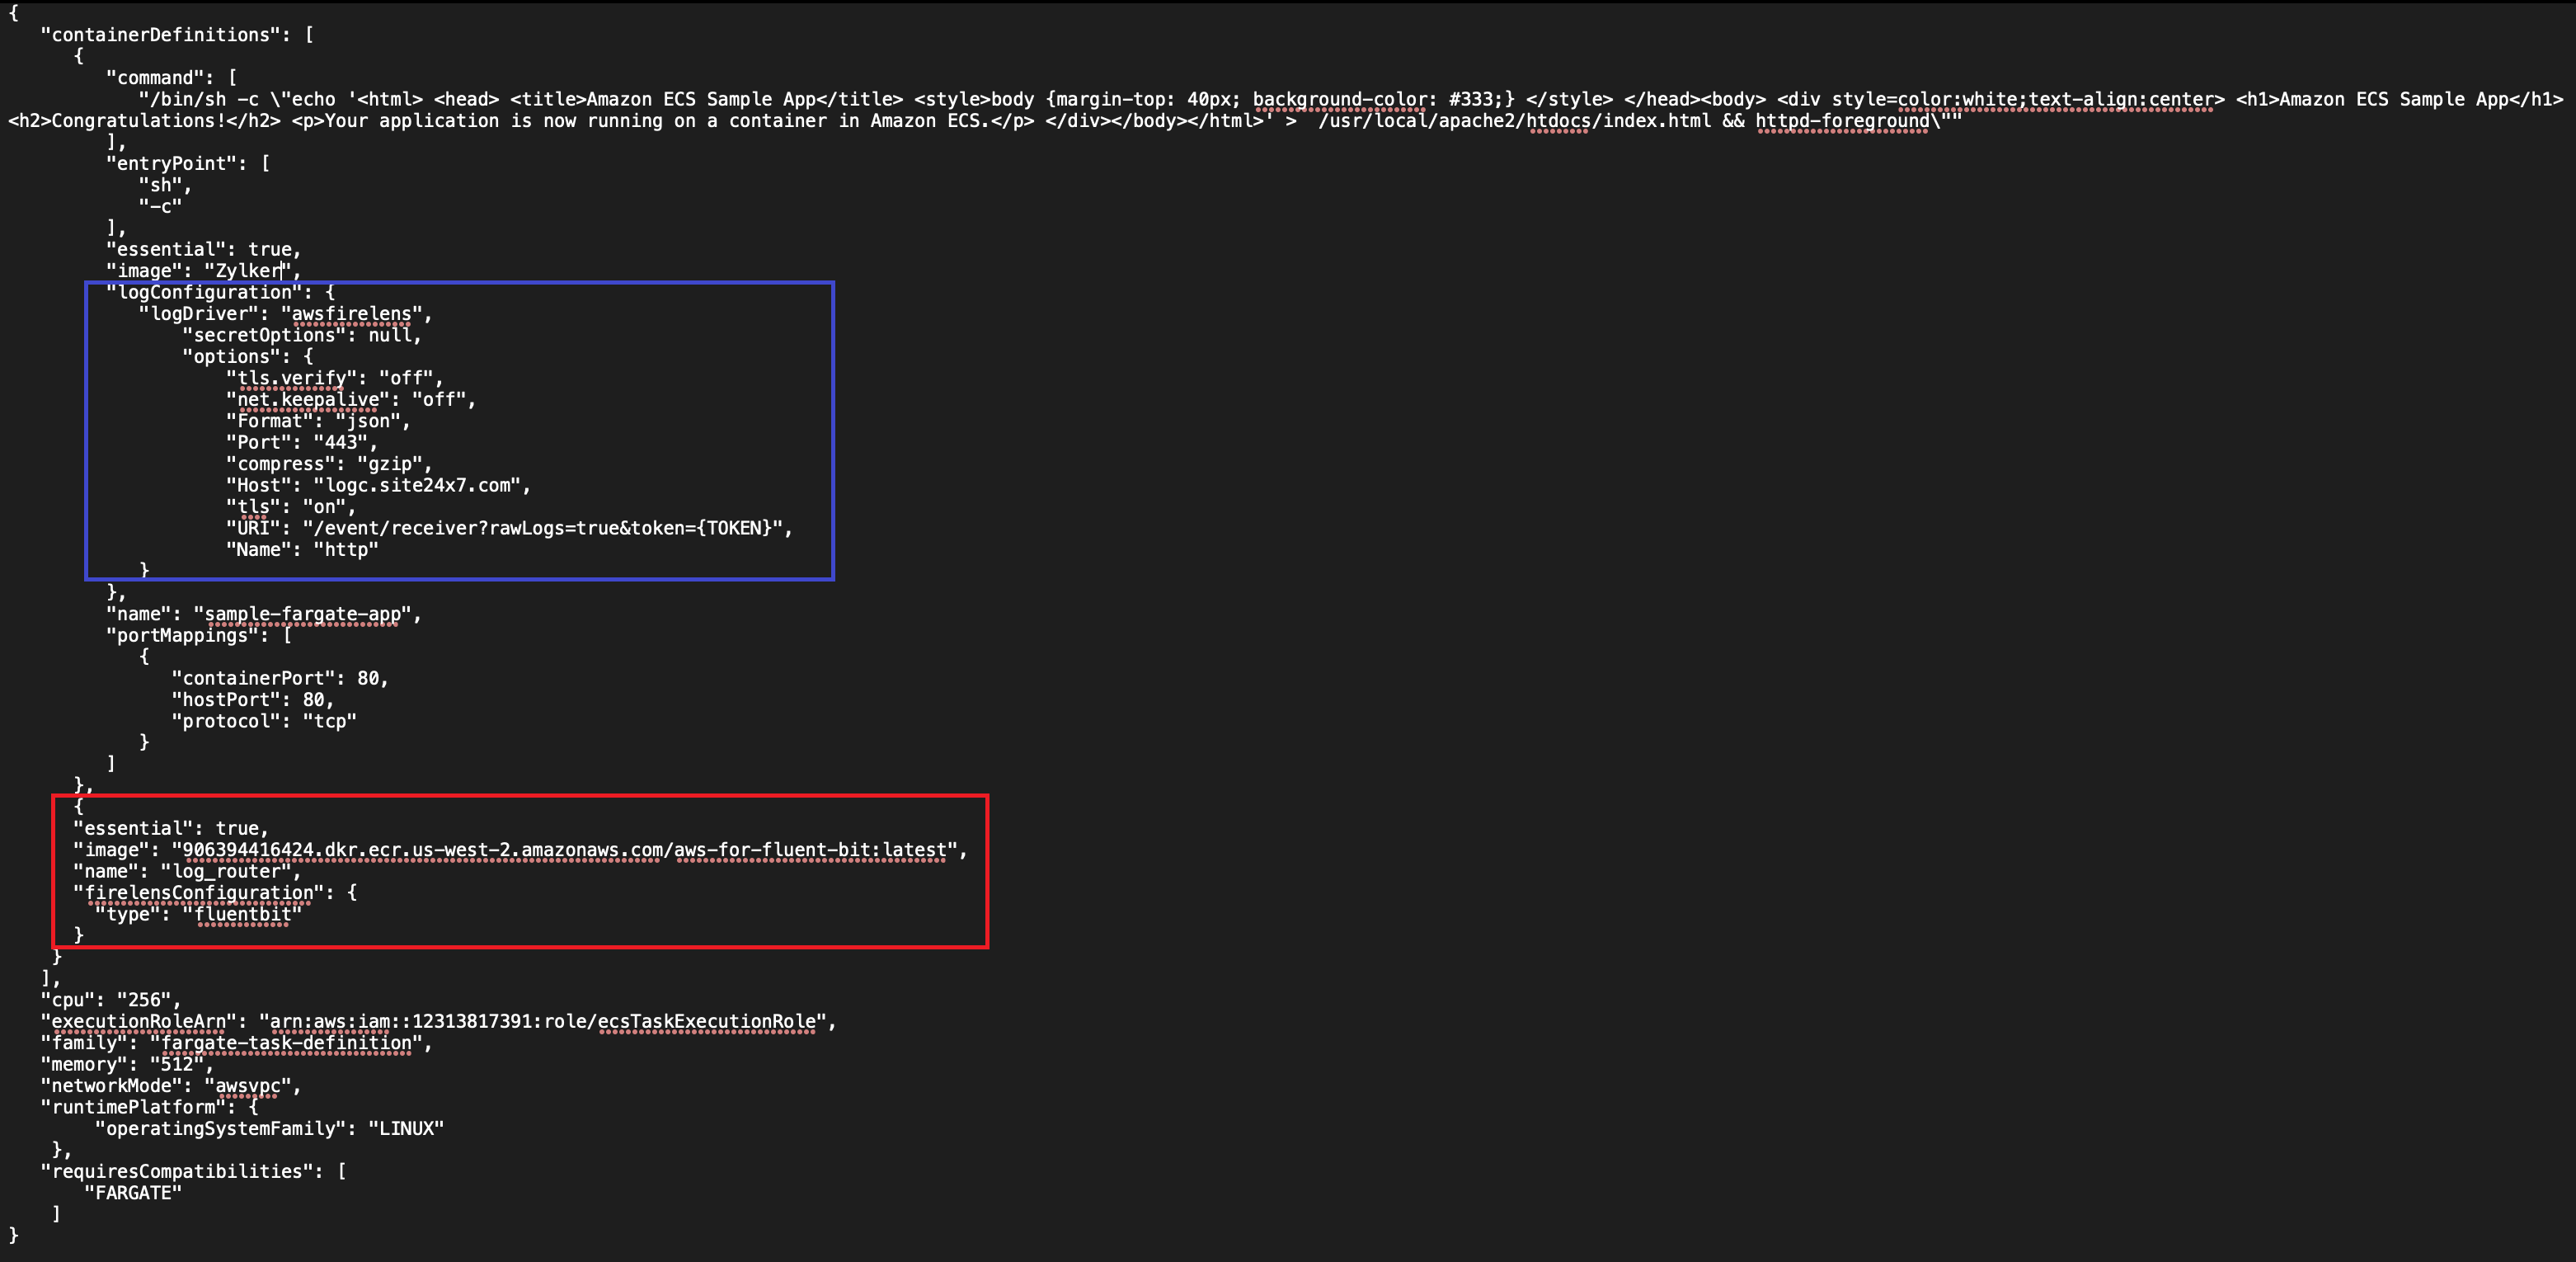
- You must add the Fluent Bit FireLens log router container to your existing Fargate task. For detailed help on configuring FireLens, refer to Amazon's official documentation.
Add the below code snippet to the task definition.
{
"essential": true,
"image": "906394416424.dkr.ecr.us-west-2.amazonaws.com/aws-for-fluent-bit:latest",
"name": "log_router",
"firelensConfiguration": {
"type": "fluentbit"
}
}
In the same Fargate task, define a log configuration for the desired containers to ship logs. awsfirelens should be the log driver for this configuration, with data being output to Fluent Bit. - Here is an example snippet of a task definition where FireLens is the log driver and outputs data to Fluent Bit.
"logConfiguration": {
"logDriver": "awsfirelens",
"secretOptions": null,
"options": {
"tls.verify": "off",
"net.keepalive": "off",
"Format": "json",
"Port": "443",
"compress": "gzip",
"Host": "logc.site24x7.com",
"tls": "on",
"URI": "/event/receiver?rawLogs=true&token={TOKEN}",
"Name": "http"
}
}
Once the above changes are done, deploy the changes to your cluster.NoteYou must provide the Host and URI key values from the API URL mentioned in step 8. For the URI key, replace {TOKEN} with the token value you get from step 8.

That's it. You are set to monitor the Amazon ECS logs with AppLogs.
Customizing the log pattern based on your log format
As every application writes logs in varied patterns, you can customize the log pattern based on your sample log lines.
For example, if your service writes customized messages in the log field, such as date, log level, log level ID, thread, class name, and message, as in the sample log line below, you can customize the log pattern based on the log format.
Sample log
{
"date": 1684129842.901607,
"log": "2023-05-16 13:00:16.109 ERROR 1 --- [zylker-thread] zylker.classname : zylkermethod",
"container_id": "e961d005829f458dasd32342377ffec-1159264102",
"container_name": "sample-fargate-app",
"source": "stderr",
"ecs_cluster": "Applog_ECS_CLUSTER",
"ecs_task_arn": "arn:aws:ecs:us-east-2:12736187623:task/Applog_ECS_CLUSTER/e961d005829f458dasd32342377ffec",
"ecs_task_definition": "fargate-task-definition:1"
}
In that case, you can customize the log pattern as below to extract that information into individual fields such as Date, LogLevel, LogLevelID, Thread, ClassName, and Message. Refer to this documentation to define a pattern field.
Log pattern customized based on the above sample log format
json $ecs_task_arn$ $container_name$ $log:pattern:$Date:date:yyyy-MM-dd HH:mm:ss.SSS$ $LogLevel$ $LogLevelId$ --- [$Thread$] $ClassName$ :$Message$$ $ecs_cluster$ $source$ $container_id$ $ecs_task_definition$
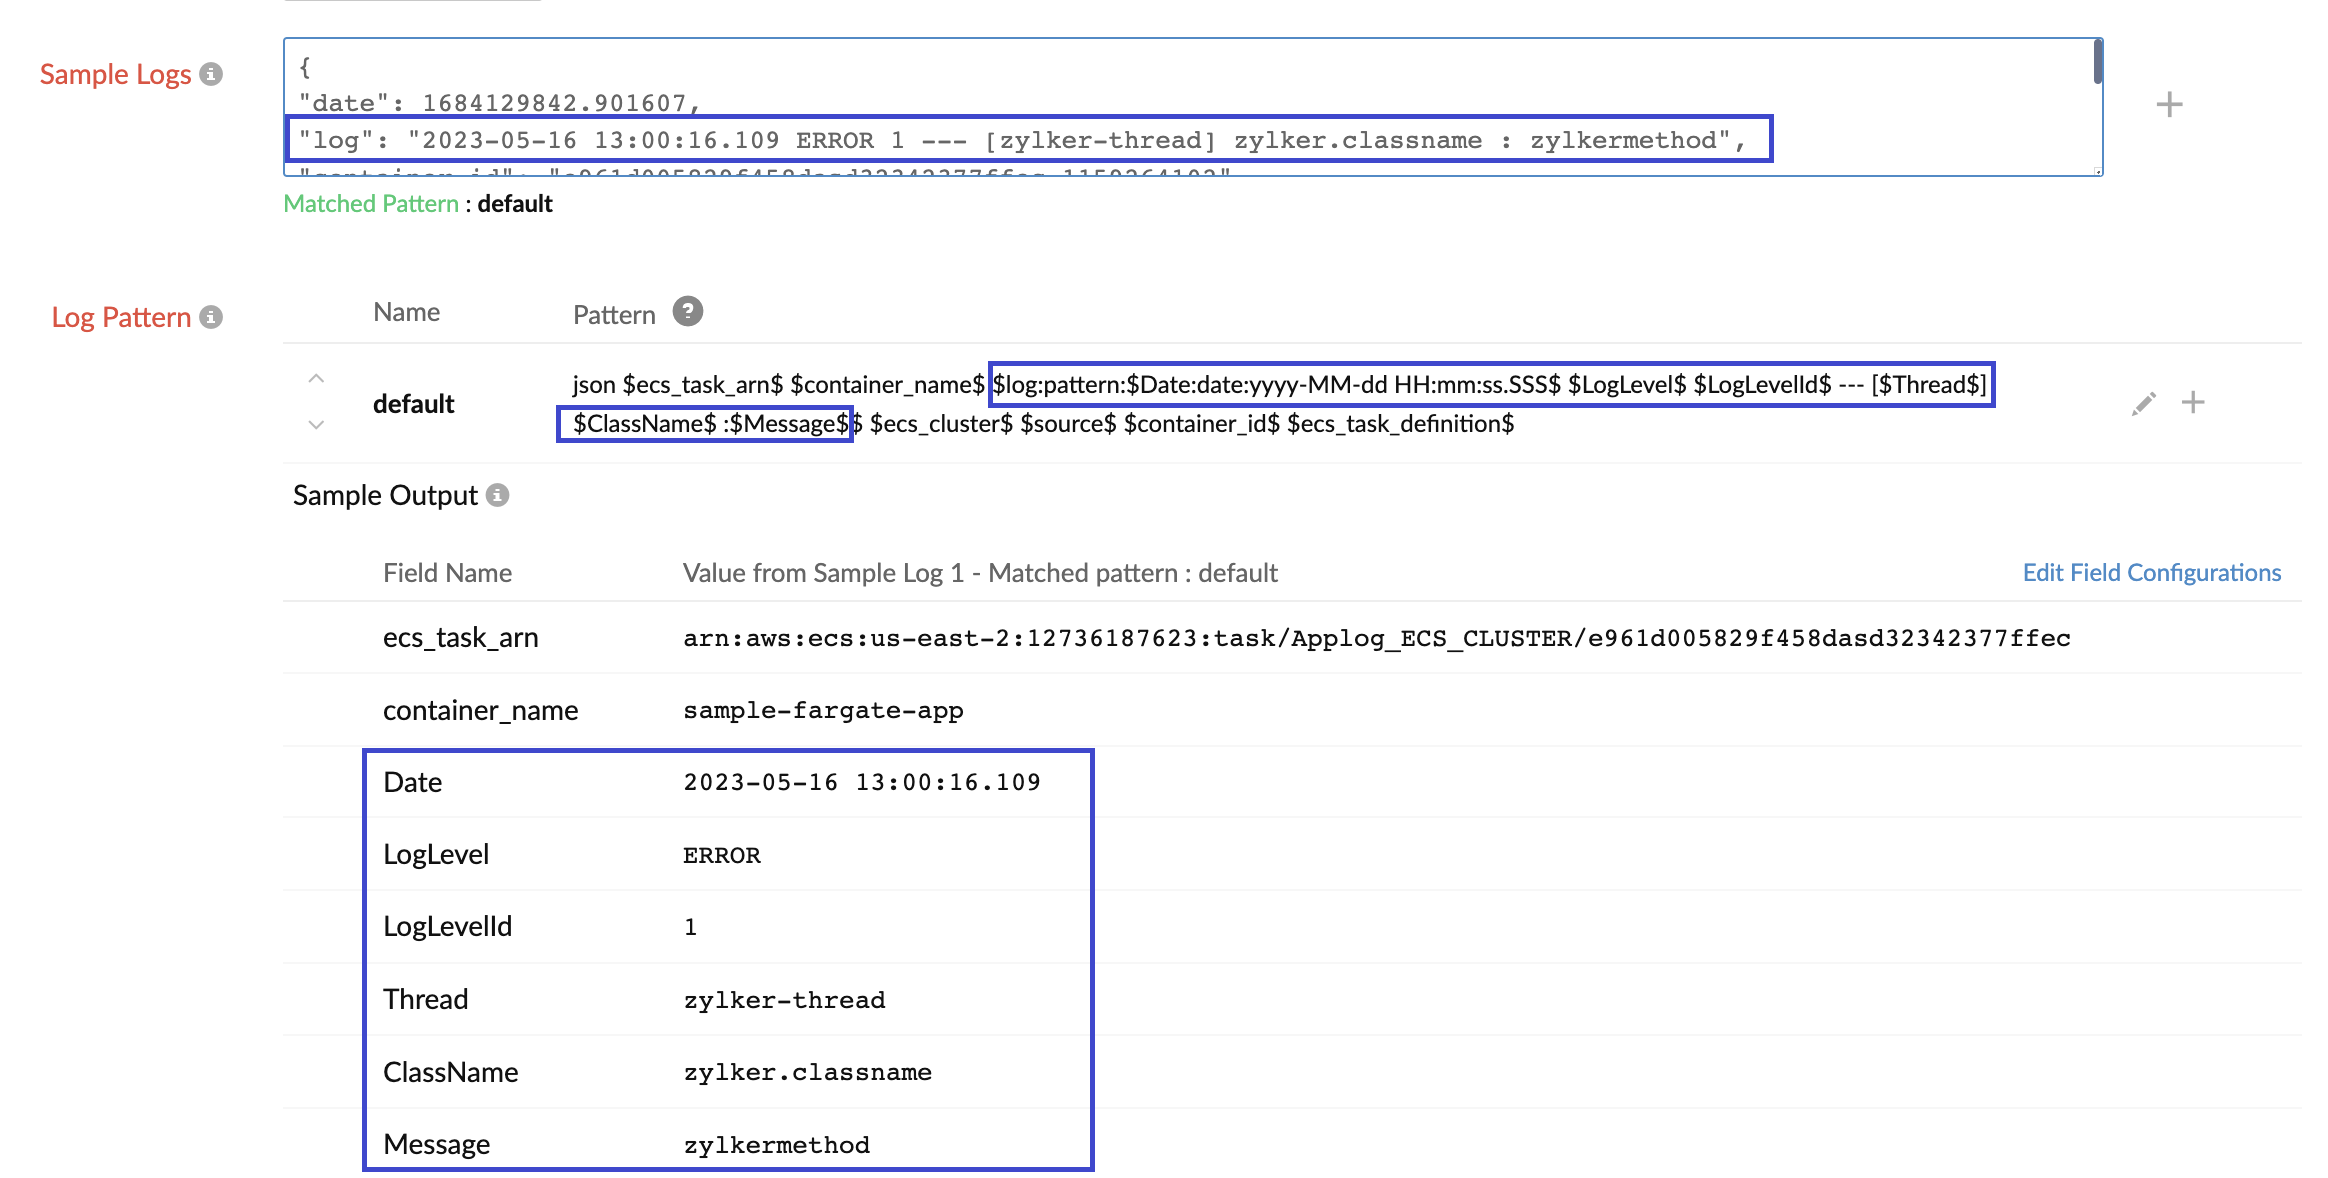
If you still face any problems in creating the log pattern, you can click Report Problem. This will send the log pattern and configured sample logs to our support for analysis, or you can reach out to support@site24x7.com.

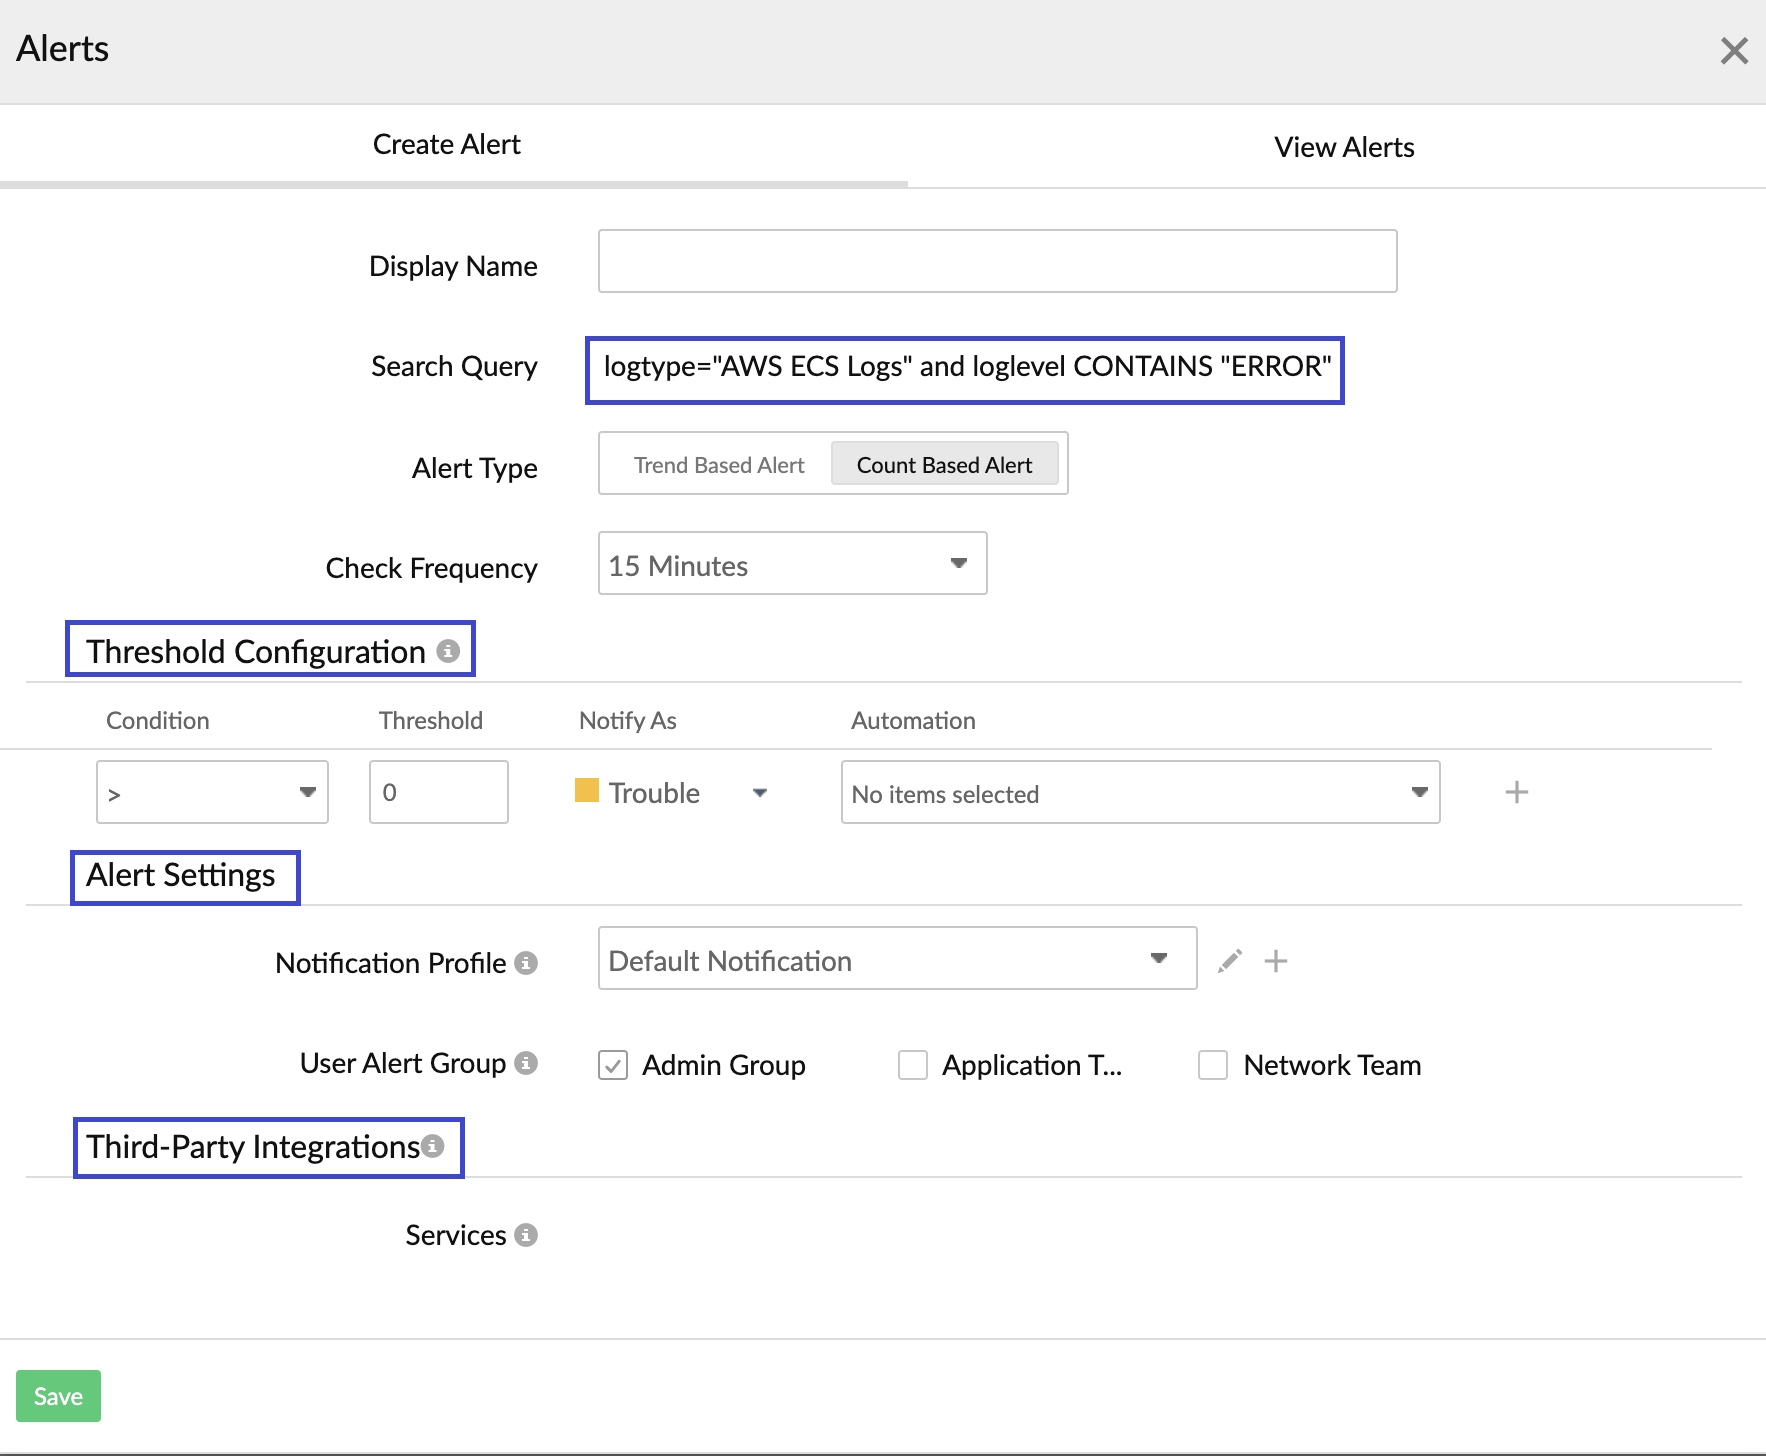
Creating alerts to get notified about errors
Once you start pushing your logs to AppLogs, you can create a saved search and alerts to monitor your logs.
For example, you can save the below query that filters the logs containing the error. Saved searches are added to the dashboard by default.
logtype="AWS ECS Logs" and loglevel CONTAINS "ERROR"

You can also create an alert to notify you of any errors.
Monitor utilization stats and EC2 metrics at both the cluster and service levels for both the EC2 launch type and the Fargate launch type with Amazon Elastic Container service monitoring integration.
