Gunicorn Logs
Web Server Gateway Interface (WSGI) bridges the request-response cycle between your web server and web application. Gunicorn is the WSGI-compliant web server for Python applications and it writes two main log files: access and error logs. Using Site24x7's multiple log pattern support, you can create a single log type for both Gunicorn access logs and Gunicorn error logs to visualize the data on an exclusive dashboard. Learn more about Site24x7's log management.
Getting started
- Log in to your Site24x7 account.
- Download and install the Site24x7 Server Monitoring Agent (Windows | Linux).
- Go to Admin > AppLogs > Log Types > Add Log Type.
You can refer to this adding a log type help documentation for more information.
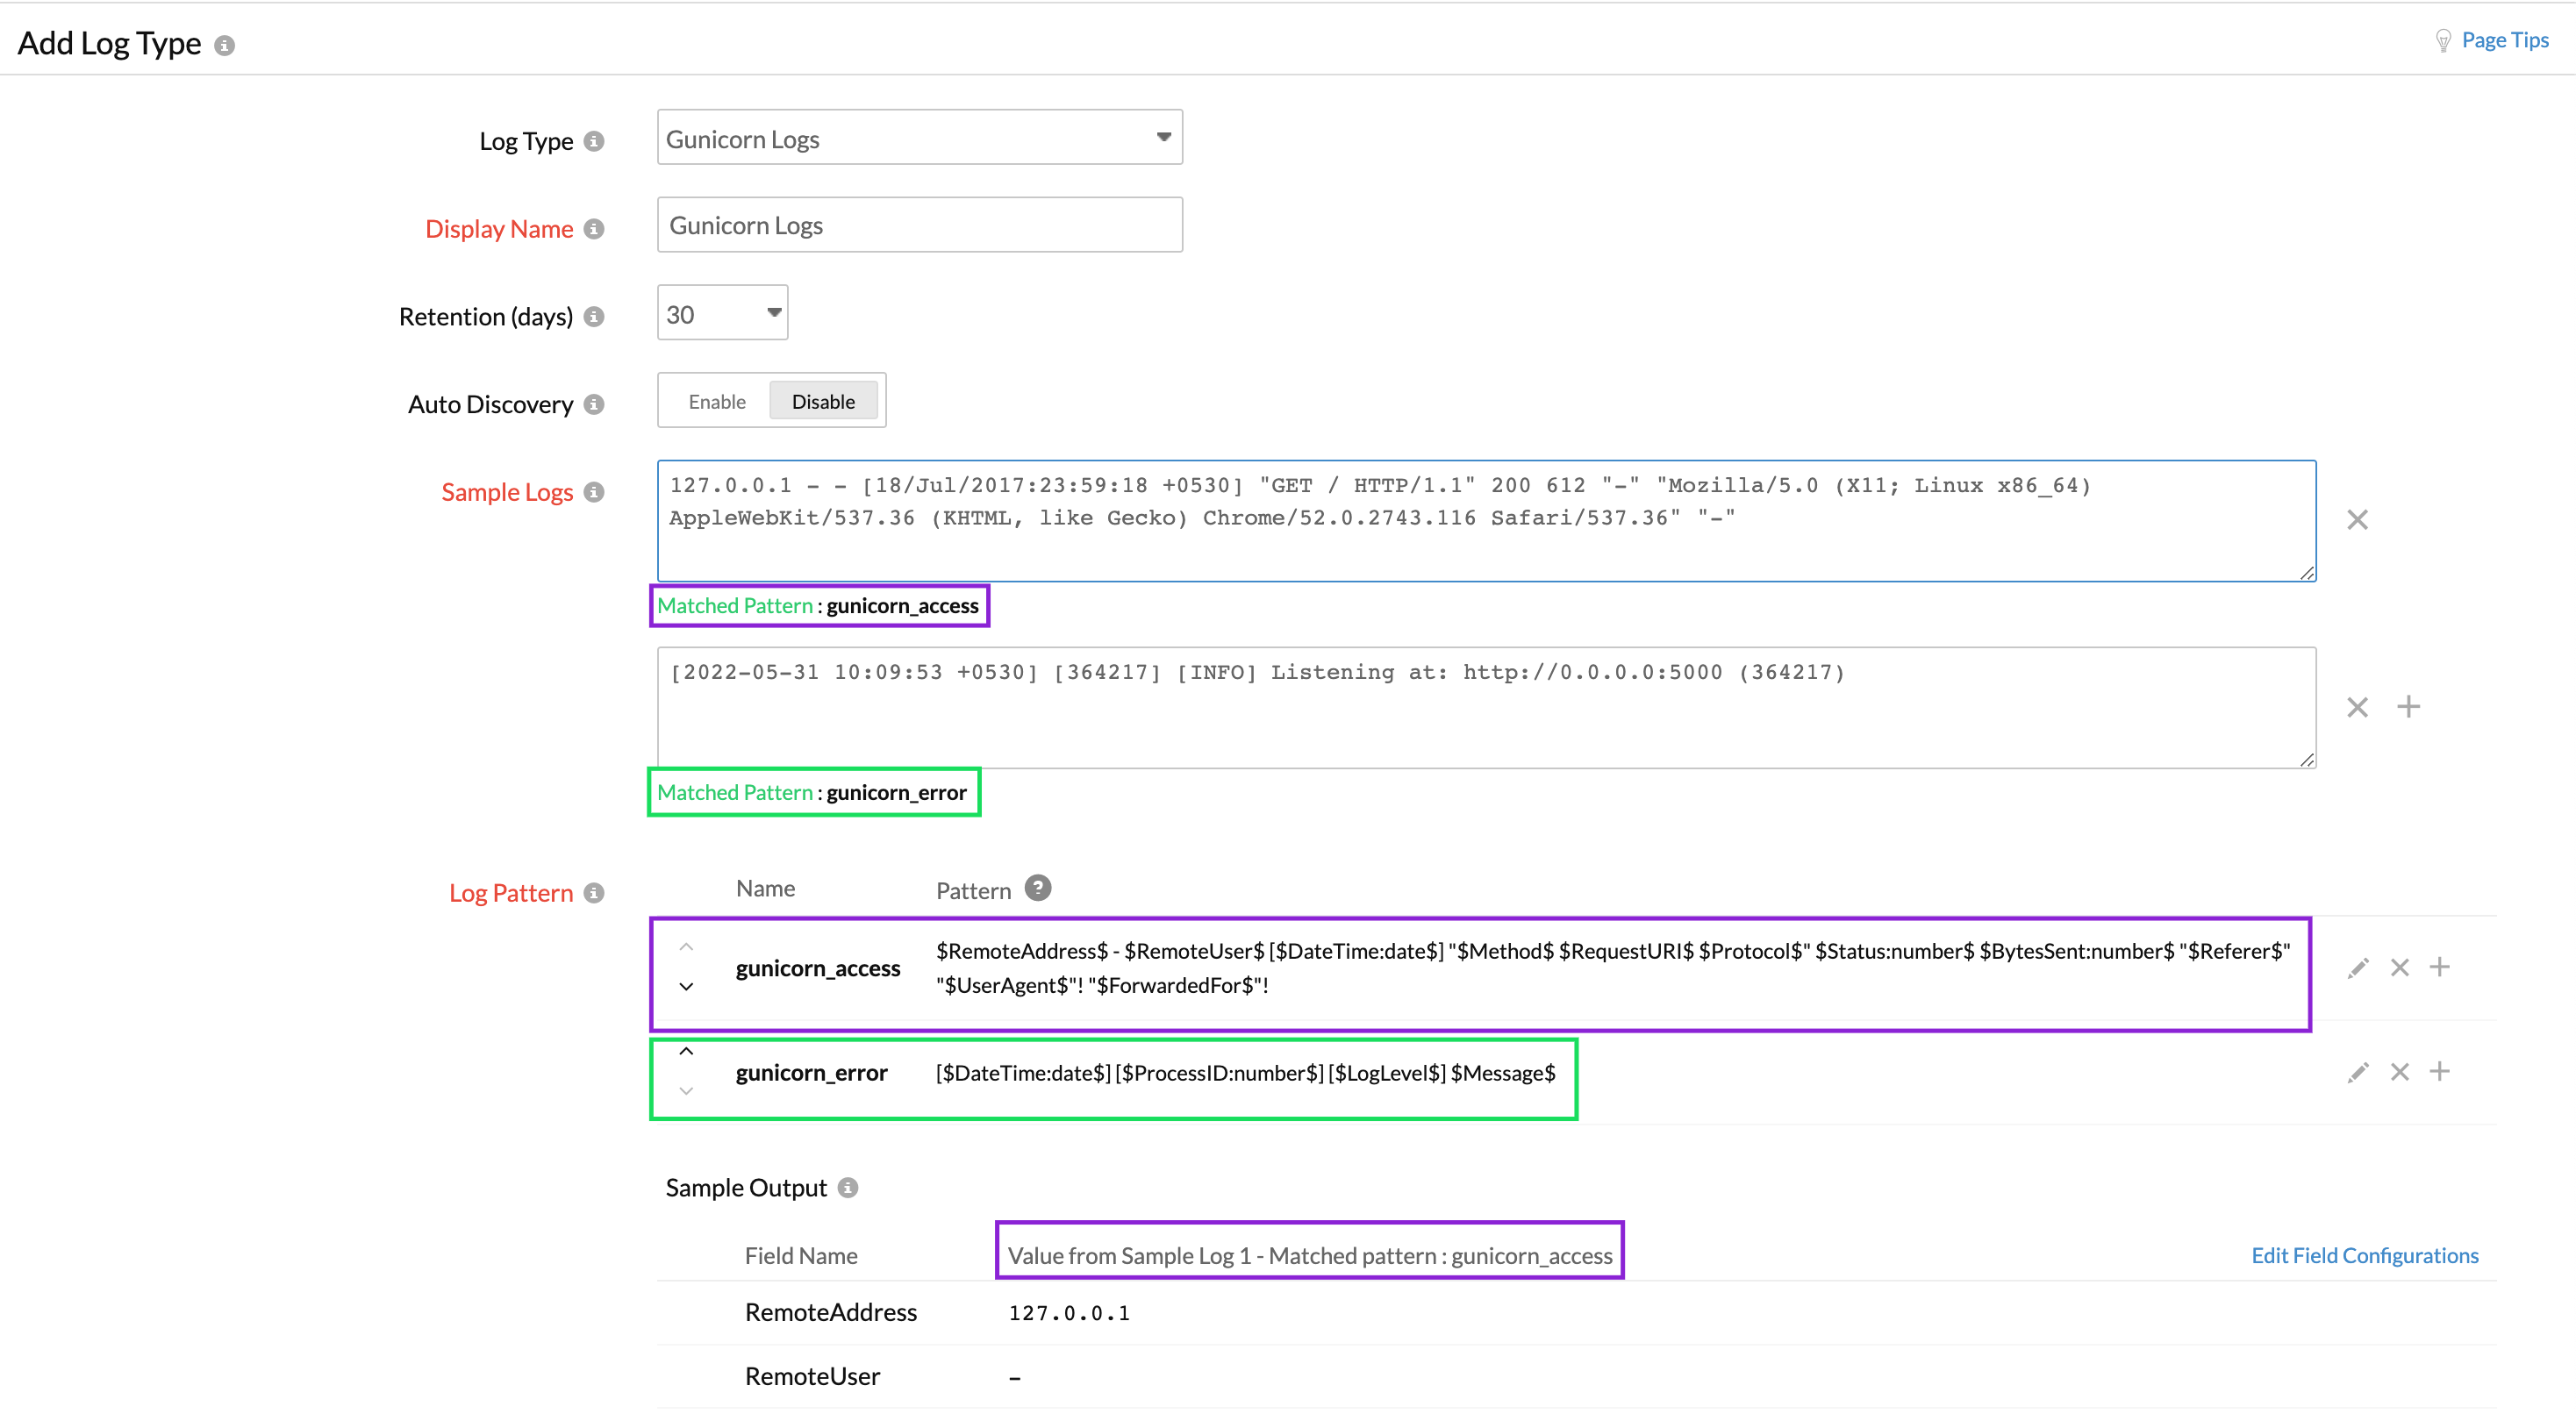
Using the multiple log pattern support, you can add different log patterns written in an access.log file and an error.log file under a single Gunicorn log type.
Gunicorn access logs (sample log and log pattern)
Here is the sample log and log pattern for the Gunicorn access logs:
127.0.0.1 - - [18/Jul/2017:23:59:18 +0530] "GET / HTTP/1.1" 200 612 "-" "Mozilla/5.0 (X11; Linux x86_64) AppleWebKit/537.36 (KHTML, like Gecko) Chrome/52.0.2743.116 Safari/537.36" "-"
$RemoteAddress$ - $RemoteUser$ [$DateTime:date$] "$Method$ $RequestURI$ $Protocol$" $Status:number$ $BytesSent:number$ "$Referer$" "$UserAgent$"! "$ForwardedFor$"!
This log is separated into fields, each of which will take its respective value, and is then uploaded to Site24x7.
| Field name | Field value |
| RemoteAddress | 127.0.0.1 |
| RemoteUser | - |
| DateTime | 18/Jul/2017:23:59:18 +0530 |
| Method | GET |
| RequestURI | / |
| Protocol | HTTP/1.1 |
| Status | 200 |
| BytesSent | 612 |
| Referer | - |
| UserAgent | Mozilla/5.0 (X11; Linux x86_64) AppleWebKit/537.36 (KHTML, like Gecko) Chrome/52.0.2743.116 Safari/537.36 |
| ForwardedFor | - |
Gunicorn error logs (sample log and log pattern)
Here is the sample log and log pattern for the Gunicorn error logs:
[2022-05-31 10:09:53 +0530] [364217] [INFO] Listening at: http://0.0.0.0:5000 (364217)
[$DateTime:date$] [$ProcessID:number$] [$LogLevel$] $Message$
This log is separated into fields, each of which will take its respective value, and is then uploaded to Site24x7.
| Field name | Field value |
| DateTime | 2022-05-31 10:09:53 +0530 |
| ProcessID | 364217 |
| LogLevel | INFO |
| Message | Listening at: http://0.0.0.0:5000 (364217) |

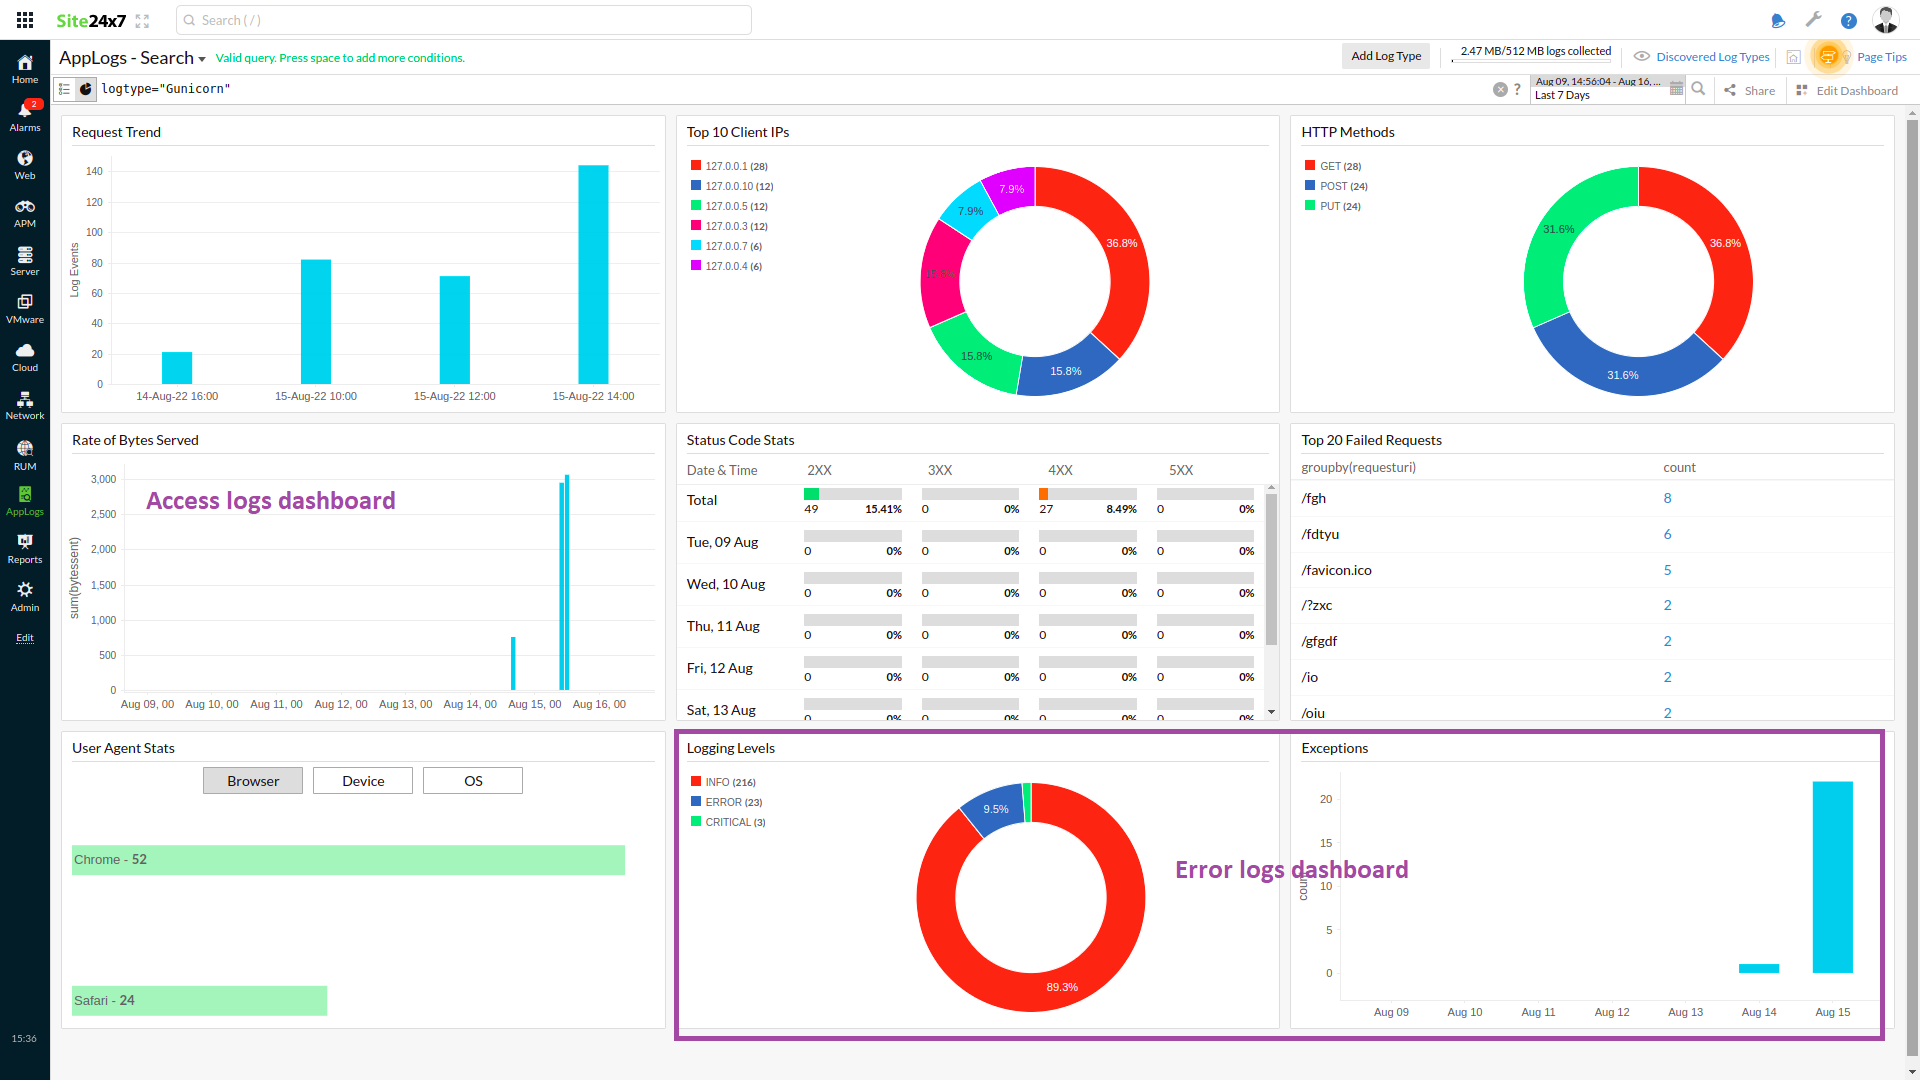
You can visualize the access and error log data on a single dashboard.

You can also specify a log pattern name in the query language to filter out the data specific to the log pattern. For example, you can query the access log pattern using the query below:
logtype="Gunicorn" and logpattern_name="gunicorn_access"
Here, gunicorn_access is the matched pattern name when you create the log type.
