Kubernetes Audit Logs
Kubernetes audit logs record everything that happens inside your clusters in chronological order. This includes auditing user activities and every call made to the Kubernetes API by the components such as the control plane, node daemons, cluster services, and the Kubernetes API call itself.
A Kubernetes audit log is a structured JSON output provided by the API server and contains rich metadata information. Monitor Kubernetes audit logs with Site24x7 AppLogs and get better visibility into your Kubernetes cluster environment.
Enabling and monitoring audit logs helps you:
- Get detailed information about who did what, when, and where.
- Debug issues in your cluster.
- Troubleshoot permission and privilege-related RBAC policy issues.
Audit policy and audit backend
The audit policy and the backend are the two basic configurations you must set in the API server to output the audit logs.
Audit policy: The audit policy defines what events should be recorded and what data should be included. The audit-policy.yaml file defines rules that contain the types of API requests you want to record. Audit logs are captured based on the audit policy configurations.
Audit backend: Audit events are processed based on the policy rules, and the backend pushes audit events to the following external storage:
- Log backend, which writes events in the log file (available on both on-premises and cloud environments).
- Webhook backend, which sends events to an external HTTP API instead of to a local file.
Refer to this Kubernetes Auditing document to learn more.
Follow the instructions relevant to the audit backend (log/webhook) that you would like to configure.
Log backend configurations
Kubernetes audit logs are disabled by default. You can enable or disable audit logs in the below environments:
Follow the instructions relevant to the environment (on-premises/cloud) for which you would like to configure.
On-Premises
Follow the below three steps to enable and configure audit logs in the on-premises environment:
Step 1: Create an audit policy
Create a policy file audit-policy.yaml at the /etc/kubernetes/audit-policy.yaml file path. As the API server process the first matching rule defined in the policy file, define the specific rules at the top, followed by the generic one.
Below is the sample policy file from the official Kubernetes documentation.
apiVersion: audit.k8s.io/v1 # This is required.
kind: Policy
# Don't generate audit events for all requests in RequestReceived stage.
omitStages:
  - "RequestReceived"
rules:
  # Log pod changes at RequestResponse level
  - level: RequestResponse
    resources:
    - group: ""
      # Resource "pods" doesn't match requests to any subresource of pods,
      # which is consistent with the RBAC policy.
      resources: ["pods"]
  # Log "pods/log", "pods/status" at Metadata level
  - level: Metadata
    resources:
    - group: ""
      resources: ["pods/log", "pods/status"]

  # Don't log requests to a configmap called "controller-leader"
  - level: None
    resources:
    - group: ""
      resources: ["configmaps"]
      resourceNames: ["controller-leader"]

  # Don't log watch requests by the "system:kube-proxy" on endpoints or services
  - level: None
    users: ["system:kube-proxy"]
    verbs: ["watch"]
    resources:
    - group: "" # core API group
      resources: ["endpoints", "services"]

  # Don't log authenticated requests to certain non-resource URL paths.
  - level: None
    userGroups: ["system:authenticated"]
    nonResourceURLs:
    - "/api*" # Wildcard matching.
    - "/version"

  # Log the request body of configmap changes in kube-system.
  - level: Request
    resources:
    - group: "" # core API group
      resources: ["configmaps"]
    # This rule only applies to resources in the "kube-system" namespace.
    # The empty string "" can be used to select non-namespaced resources.
    namespaces: ["kube-system"]

  # Log configmap and secret changes in all other namespaces at the Metadata level.
  - level: Metadata
    resources:
    - group: "" # core API group
      resources: ["secrets", "configmaps"]

  # Log all other resources in core and extensions at the Request level.
  - level: Request
    resources:
    - group: "" # core API group
    - group: "extensions" # Version of group should NOT be included.

  # A catch-all rule to log all other requests at the Metadata level.
  - level: Metadata
    # Long-running requests like watches that fall under this rule will not
    # generate an audit event in RequestReceived.
    omitStages:
      - "RequestReceived"
Step 2: Define the audit policy and log file path
You must enable audit logs only on the master node, as the kube-apiserver is part of the cluster's control plane hosted on the master node. Configure the following flags in the /etc/kubernetes/manifests/kube-apiserver.yaml file.
--audit-policy-file=/etc/kubernetes/audit-policy.yaml
--audit-log-path=/var/log/kubernetes/audit/audit.log
Update the volumeMounts and volumes section in the configuration file as below:
volumeMounts:
- mountPath: /etc/kubernetes/audit-policy.yaml
name: audit
readOnly: true
- mountPath: /var/log/kubernetes/audit/
name: audit-log
readOnly: false
volumes:
- hostPath:
path: /etc/kubernetes/audit-policy.yaml
type: File
name: audit
- hostPath:
path: /var/log/kubernetes/audit/
type: DirectoryOrCreate
name: audit-log
Step 3: Create a Log Profile in Site24x7 AppLogs
- Log in to your Site24x7 account.
- Download and install the Site24x7 Server monitoring agent (Linux) in Kubernetes cluster master node.
- Go to Admin > AppLogs > Log Profile > Add Log Profile.
- Select Kubernetes Audit Logs from the Choose the Log type drop-down.
- Include /var/log/kubernetes/audit/audit.log to the List of files to search for logs.
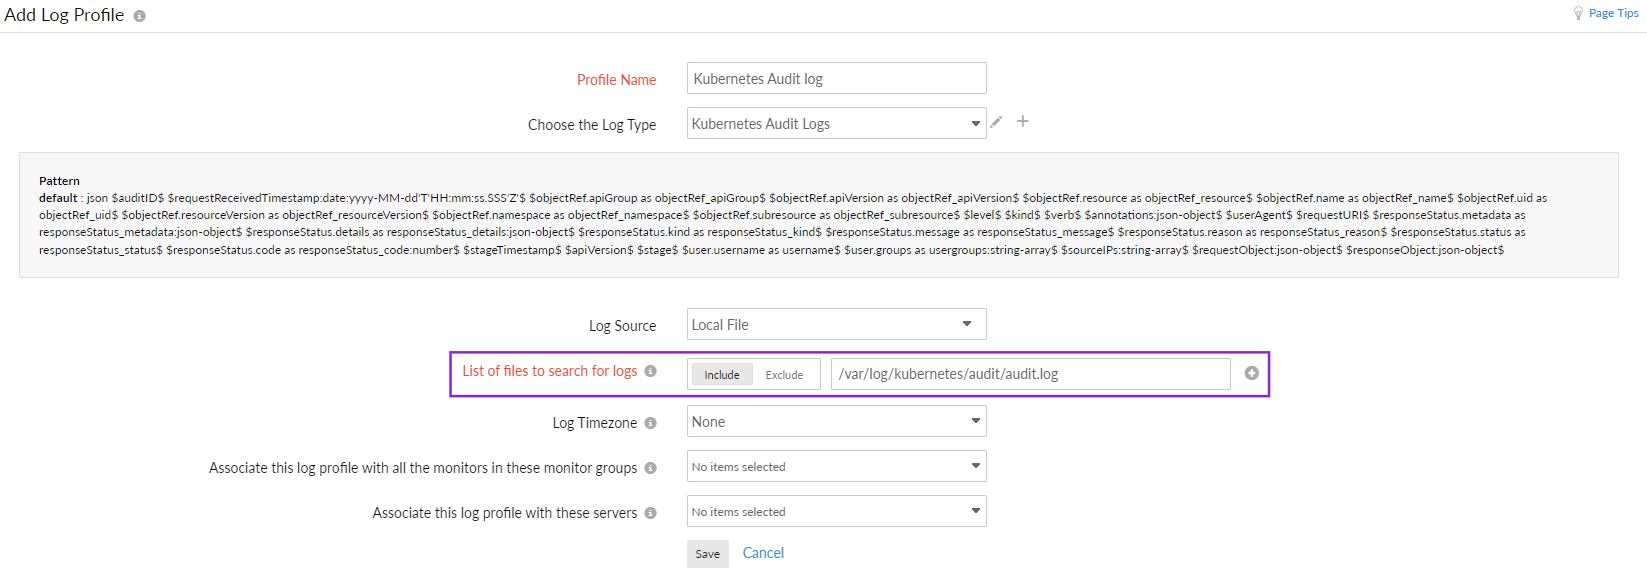
That's it. You are set to monitor the audit logs in your on-premises environment using Site24x7 AppLogs.
Cloud
Check below to enable or disable audit logging for:
- Azure Kubernetes Service (AKS)
- Amazon Elastic Kubernetes Service (EKS)
Azure Kubernetes Service logging
Follow the instructions below to enable or disable logging on Azure Kubernetes Service (AKS):
Step 1: Creating a Log Profile
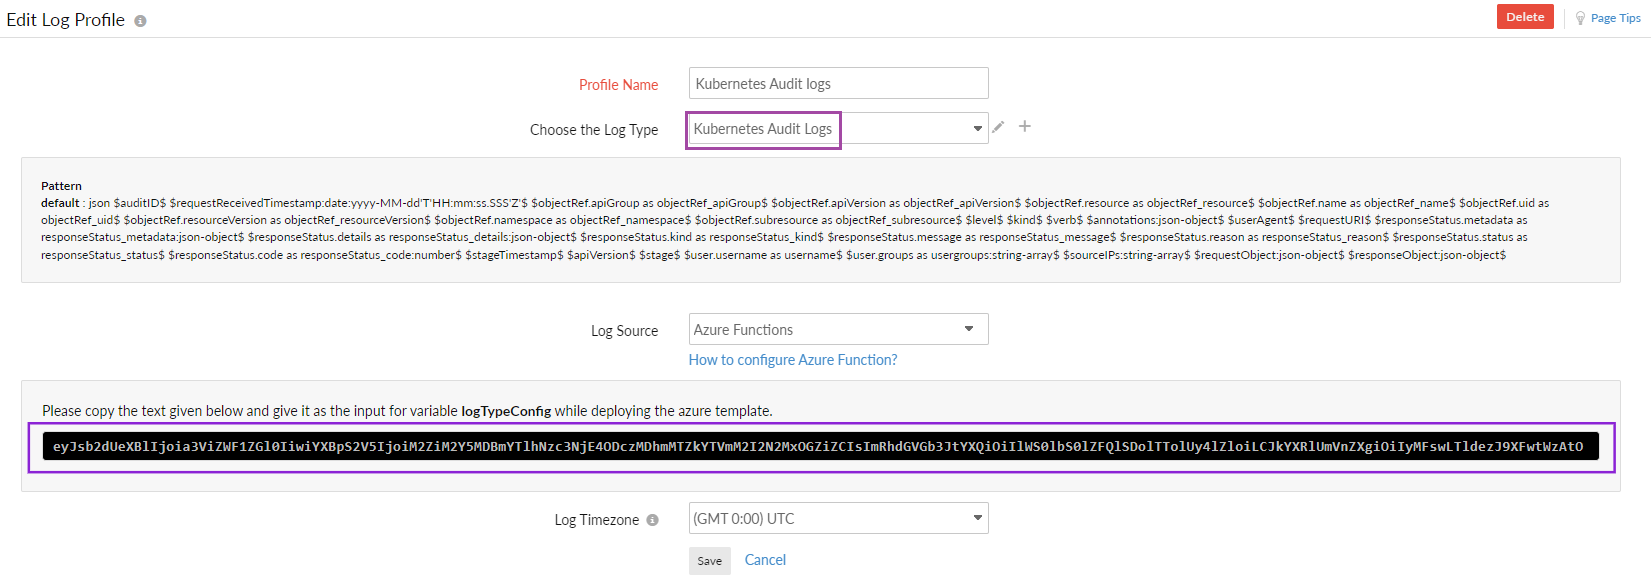
From the Site24x7 web console, navigate to Admin > AppLogs > Log Profile > Add Log Profile, and enter the following:
- Enter a name for your Log Profile in the Profile Name field.
- Choose Kubernetes Audit Logs from the Choose the Log Type drop-down.
- Choose Azure Functions from the Log Source drop-down.
- Choose UTC for the Log Timezone.
- Click Save.

Step 2: Configuring the Azure resource using an Azure Resource Manager (ARM) template
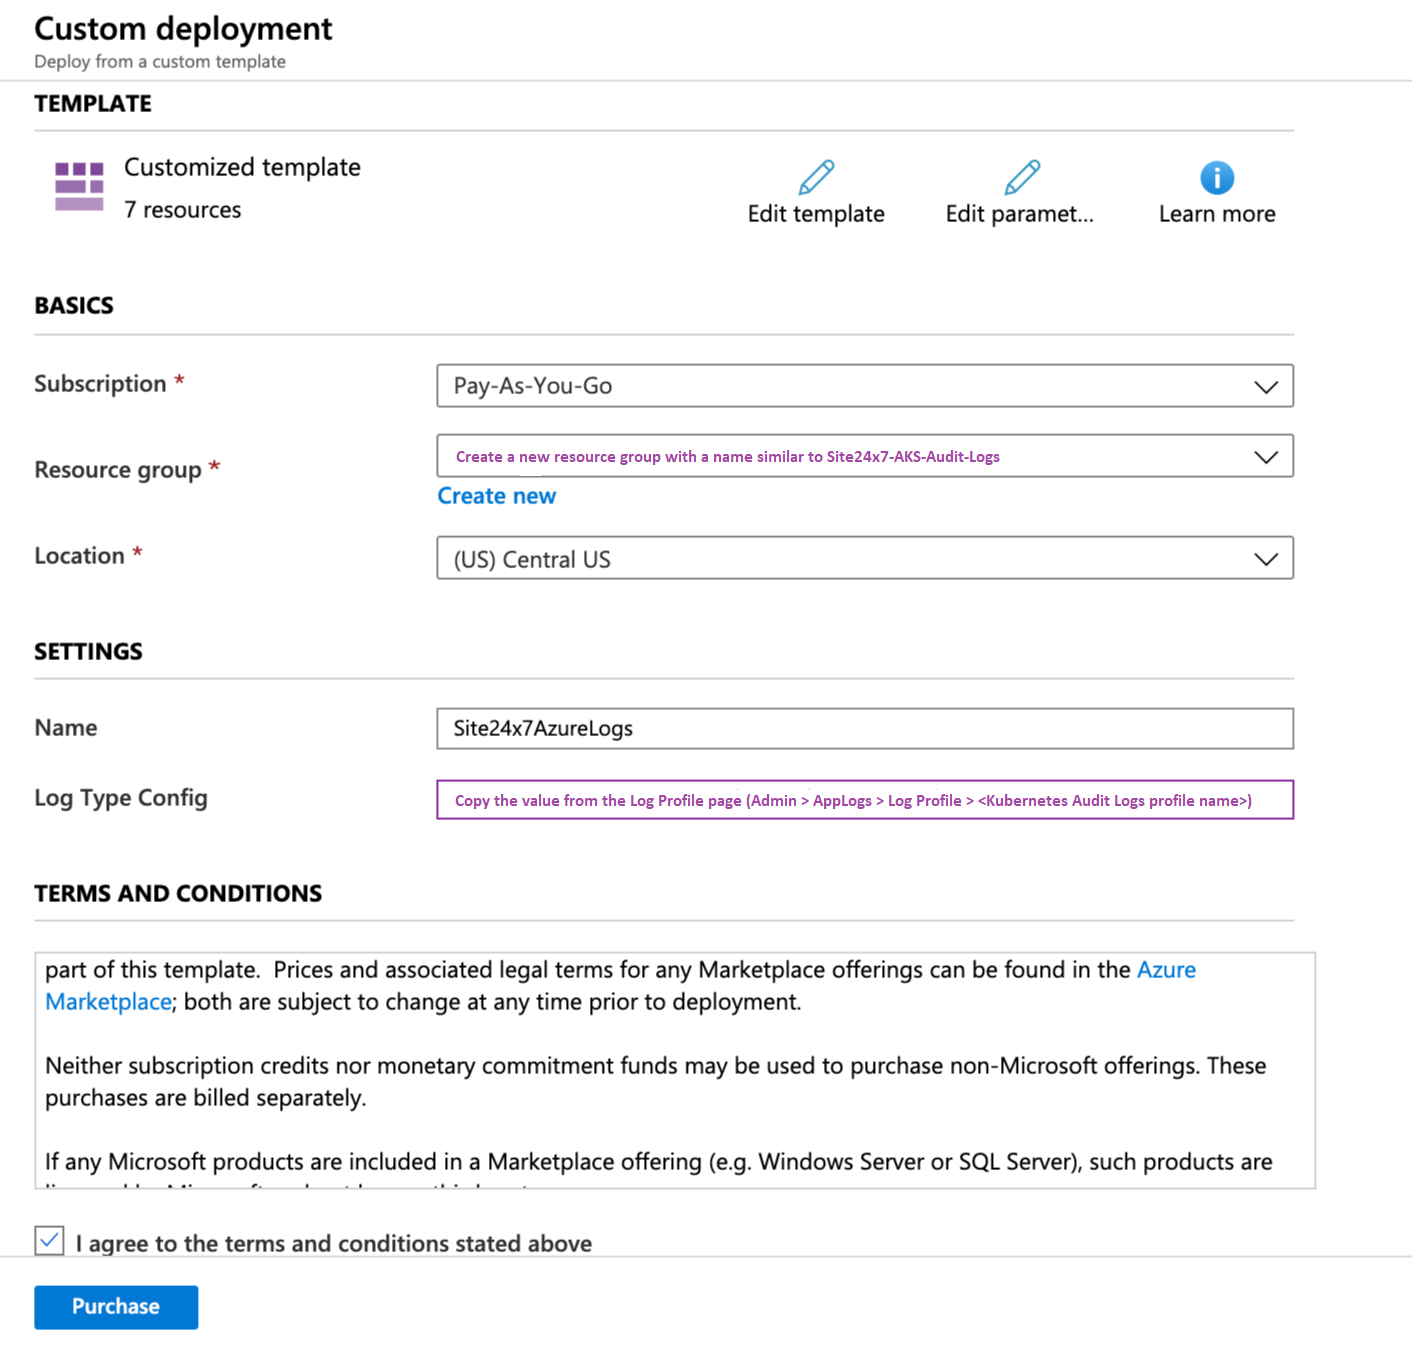
Follow the instructions in the Azure diagnostic logs document to configure the Azure resource using an ARM template. When entering the details on the custom deployment blade (steps 7 and 8) in the above document, make sure you edit the following specific to the Kubernetes Audit Logs:
- Resource group: Create a new resource group with a name similar to Site24x7-AKS-Audit-Logs.
- LogTypeConfig: Copy the value from the Log Profile page that you already created within Site24x7 (Admin > AppLogs > Log Profile > <Kubernetes Audit Logs profile name>).
Step 3: Enable Audit logs and forward to Site24x7
- Log in to your Azure portal.
- Go to Kubernetes services, choose your Kubernetes cluster and click Diagnostic settings.
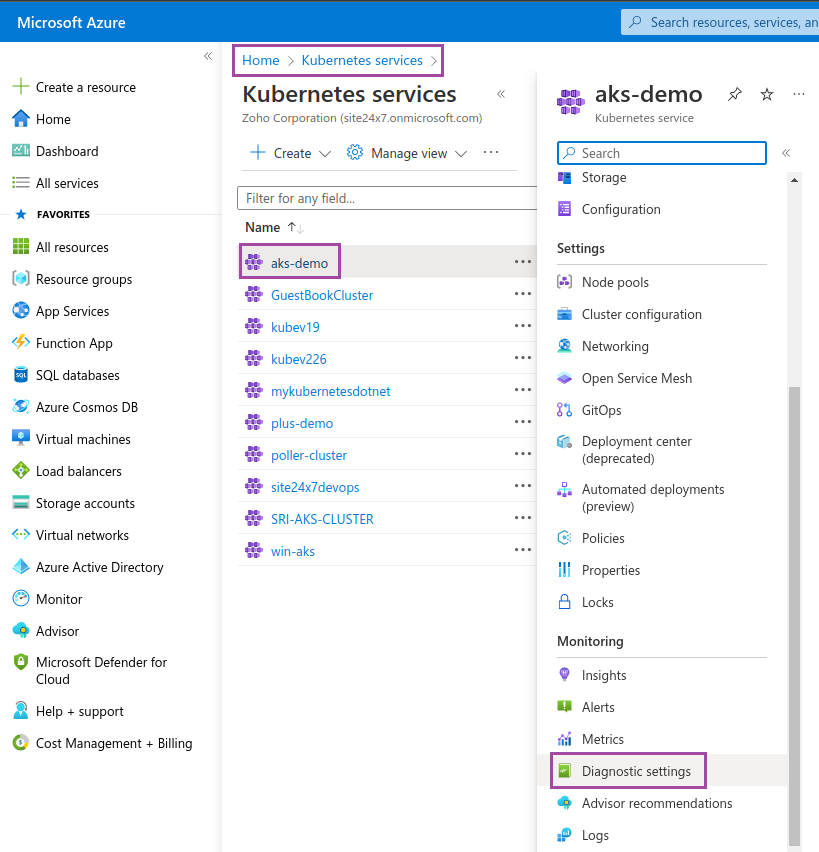
- Select Kubernetes Audit under Logs, Stream to an event hub under the Destination details and choose the Event hub namespace.
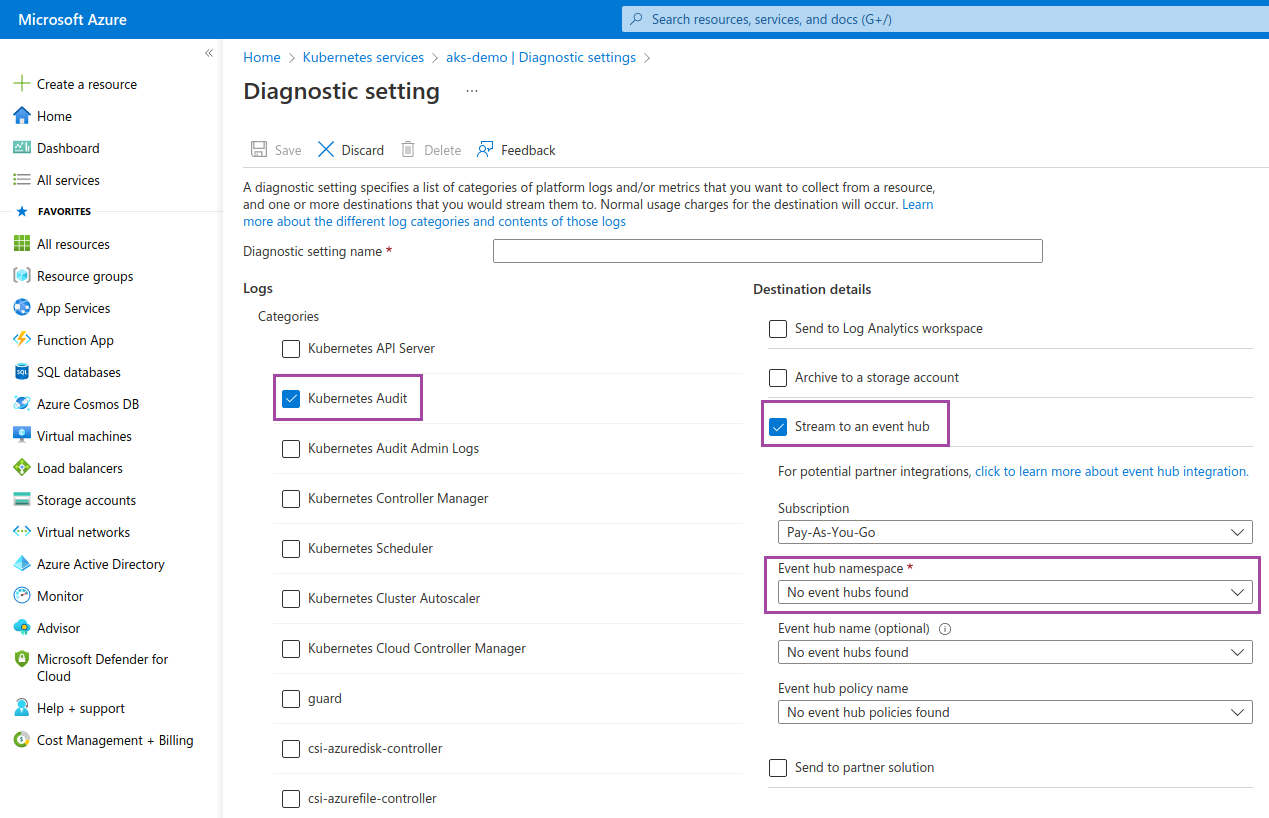
Now, you are set to monitor the audit logs in your Azure Kubernetes Service environment using Site24x7 AppLogs.
Amazon Elastic Kubernetes Service logging
Follow the steps below to enable or disable logging on Amazon Elastic Kubernetes Service (EKS):
Step 1: Enabling Amazon EKS audit logs
Refer to the guidelines in this official documentation to enable or disable Amazon EKS audit logs.
Step 2: Collecting the CloudWatch log
- From the Site24x7 web console, navigate to Admin > AppLogs > Log Profile > Add Log Profile, and then:
- Enter a name for your Log Profile in the Profile Name field.
- Choose Kubernetes Audit Logs from the Choose the Log Type drop-down.
- Choose Amazon Lambda from the Log Source drop-down.
- Click Save.
- Follow the instructions in the AWS setup section of this document to collect the CloudWatch logs and view them in Site24x7. However, make sure you choose Kubernetes Audit Logs, it's logtypeconfig, and the Log group as /aws/eks/<my-cluster>/cluster/ and continue the instructions defined in the document.
Now, you are set to monitor the audit logs in your Amazon Elastic Kubernetes Service environment using Site24x7 AppLogs.
Webhook backend configurations
Follow the steps below to configure webhook backend configurations:
Steps to configure
- Create and define the audit policy mentioned in the Log backend configurations section in this document.
- Create a Log Type, as shown in this document.
- For the Log Type, enter Kubernetes Audit Logs. This will automatically populate the rest of the fields.
- Ensure that API Upload is enabled.
- Copy the HTTPS endpoint URL to configure a webhook backend configuration.
- Click Save.
- Create a new file in the path /etc/kubernetes/pki/audit-webhook.yaml and copy the content below. Make sure you provide the HTTPS endpoint URL you copied in the above step in the YAML file for the server key.
apiVersion: v1
kind: Config
preferences: {}
clusters:
- name: kubernetes
cluster:
server: "https://logc.site24x7.com/event/receiver/M3NjE4ODc234242342wfwew3zMDhmMTZkYTVmM2I2N2MxOGZiZC9rdWJlY="
contexts:
- context:
cluster: kubernetes
user: kubernetes-admin
name: kubernetes-admin@kubernetes
current-context: kubernetes-admin@kubernetes
preferences: {}
users: [] - To configure a backend webhook audit, set the below flag:
in /etc/kubernetes/manifests/kube-apiserver.yaml file.--audit-webhook-config-file=/etc/kubernetes/pki/audit-webhook.yaml flag
You don't have to create a Log Profile for the webhook backend configuration. Also, you don't have to define the audit log path, as it sends audit events to the HTTPS endpoint instead of to a local file.
Now, you are set to monitor the audit logs of your Amazon Elastic Kubernetes Service environment using Site24x7 AppLogs.
Use cases for audit logs
Here is the sample audit event:
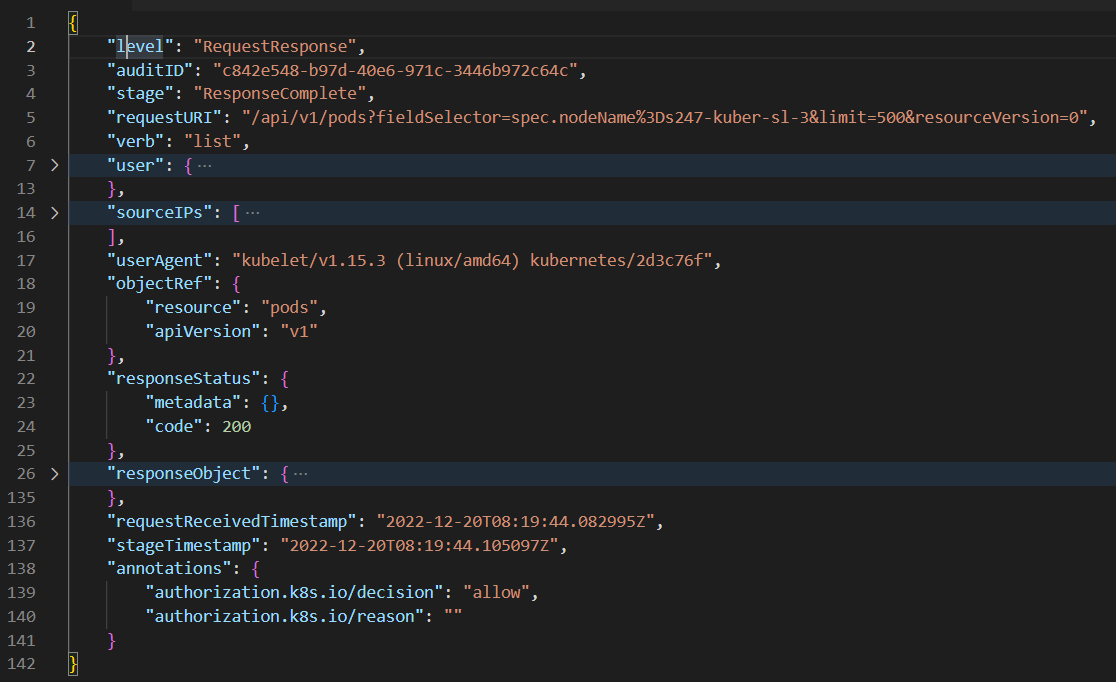
The following are a few important keys present in the above sample audit log. Refer to this documentation to see all available fields in the audit event.
| Keys | Description |
| user | Who (user or service account) initiated the request |
| sourceIP | From where it was initiated |
| verb | What action was performed (get, post, list, watch, patch, delete) |
| requestURI | Identifies the request sent by the client to a server |
| objectRef | Provides details about the Kubernetes objects associated to the request |
| responseStatus | The response to the request initiated |
| requestReceivedTimestamp | The time the API server first received the request |
| responseObject | Provides insights into the response to the requests initiated by users or service accounts |
| annotations | Provides details on an authorization decision and its reason |
- The keys such as user, sourceIP, verb, requestURI, objectRef, and requestReceivedTimestamp give detailed information about who did what, when, and where.
- The keys such as responseStatus, responseObject, and annotations provide information about the authorization and the response received and help you troubleshoot permission and privilege-related issues.
Decoding the dashboard
When you look at the Status Code Stats widget in the dashboard, there are status codes above 400.
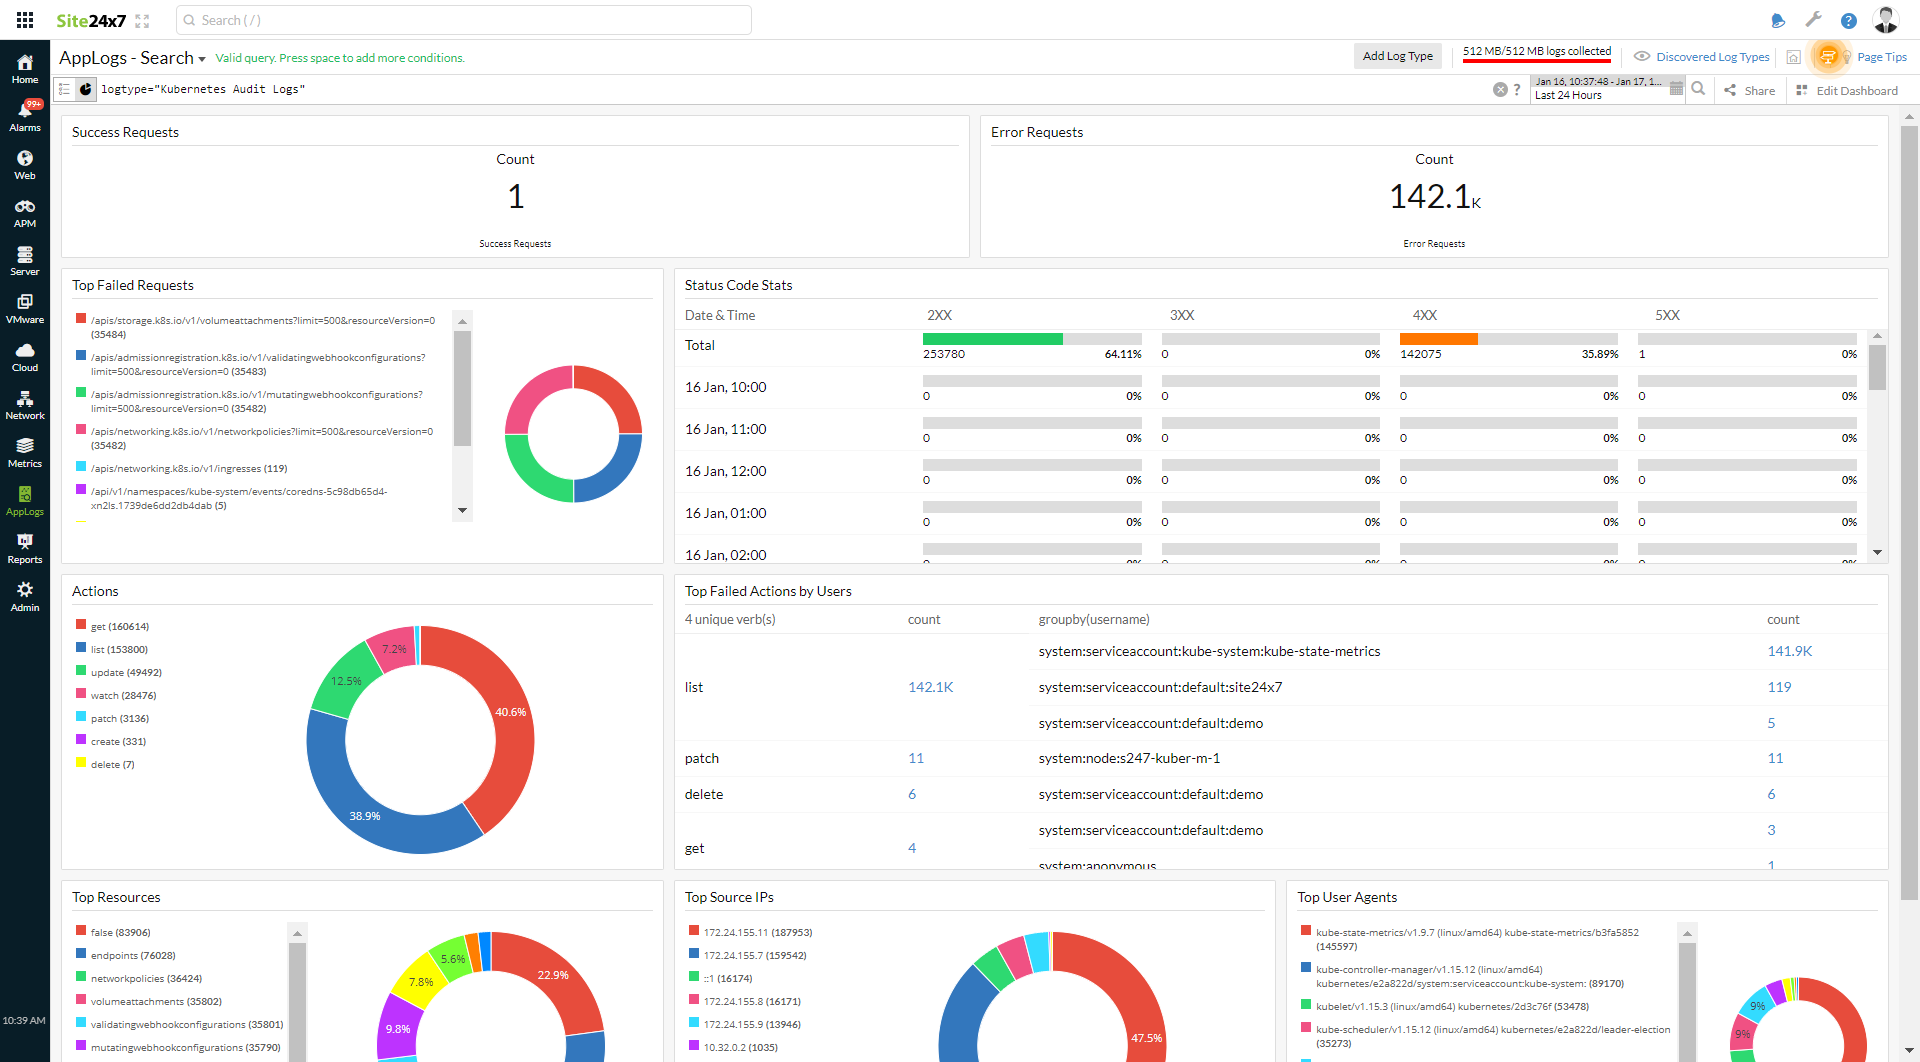
To investigate further, click the 4XX error code, which will take you to the events causing this error. You can use the query language filter below to determine the root cause.
logtype="Kubernetes Audit Logs" and responsestatus_code=403 and verb="list" groupby username
logtype="Kubernetes Audit Logs" and responsestatus_code=403 and verb="list" and username="system:serviceaccount:default:demo"
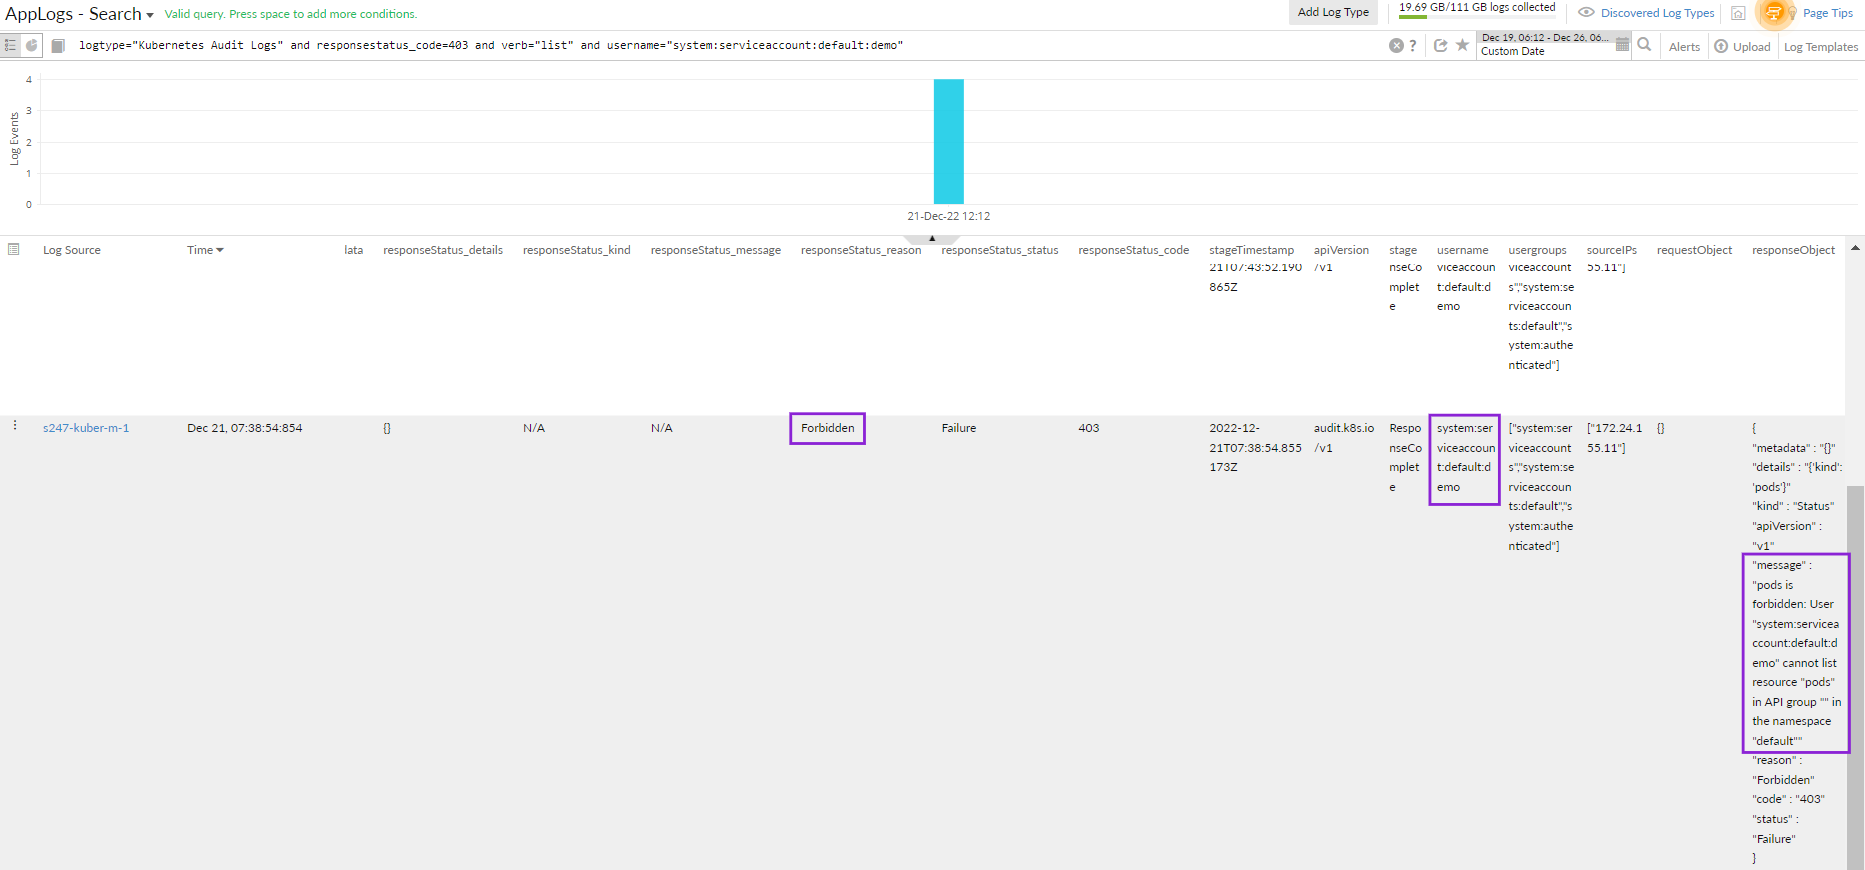
The demo user did not have access to the pod, resulting in the error. You can take remediation actions accordingly.
With Site24x7's Kubernetes event logs, you can view and also manage all the event logs of your clusters, pods, and nodes.
Troubleshooting
The following are a few tips and tricks to mitigate the issue that you might face during configuration:
How do you make sure the auditing log entry was made?
For log backend configurations
- Follow the instructions defined in the Log backend configurations section in this document, and wait a few seconds for your changes to the Kube-apiserver config file to be reflected.
- Run the below command to check whether the API server is up and running:
kubectl get pods -n kube-system -w
- Now, run the below command to open the log file and check whether the audit entry has been created:
sudo cat /var/log/kubernetes/audit/audit.log
- If you see a log similar to the sample log mentioned above, it is confirmed that the audit entry is being created.
For webhook backend configurations
- Follow the instructions defined in the webhook backend configurations section in this document, and wait a few seconds for your changes to the Kube-apiserver config file to be reflected.
- Run the below command to check whether the API server is up and running:
kubectl get pods -n kube-system -w
- As the webhook backend sends events to an external HTTP API, wait for a few seconds (up to one minute), log in to our web client, and confirm the audit entries.
General guidelines for audit policies
Each Kubernetes API call comprises stages such as RequestReceived, ResponseStarted, ResponseComplete, and Panic. Logs are recorded based on the rules and audit levels such as None, Metadata, Request, and RequestResponse defined in the policy.
- Request and RequestResponse levels provide complete insight into your API calls, but it will increase the memory consumption and, thereby, the audit logs storage.
- Use Metadata to exclude sensitive information like authentication tokens.
