NetFlow: QoS
Networks handle different data types like data, voice, and video. Busy networks are prone to congestion, which in turn can lead to packet loss, distortion, and delay.
Quality of service (QoS) denotes the measure of the overall performance of service. Measuring the QoS is helpful to optimize network usage, as it is based on the differentiated services code point (DSCP). The DSCP templates contain predefined DiffServ parameters and code points to monitor traffic based on the priority defined by the source device.
Navigating to the QoS tab
- Log in to Site24x7.
- Navigate to Network > NetFlow > NetFlow Devices.
- Select the device for which you wish to see the QoS metrics.
- Navigate to the QoS tab to view the QoS metrics at the device level. To view the QoS at the interface level, navigate to the Interfaces tab.
- Next, click the interface for which you wish to view the QoS metrics.
- Then, click the QoS sub-tab to view the QoS data at the interface level.
QoS metrics
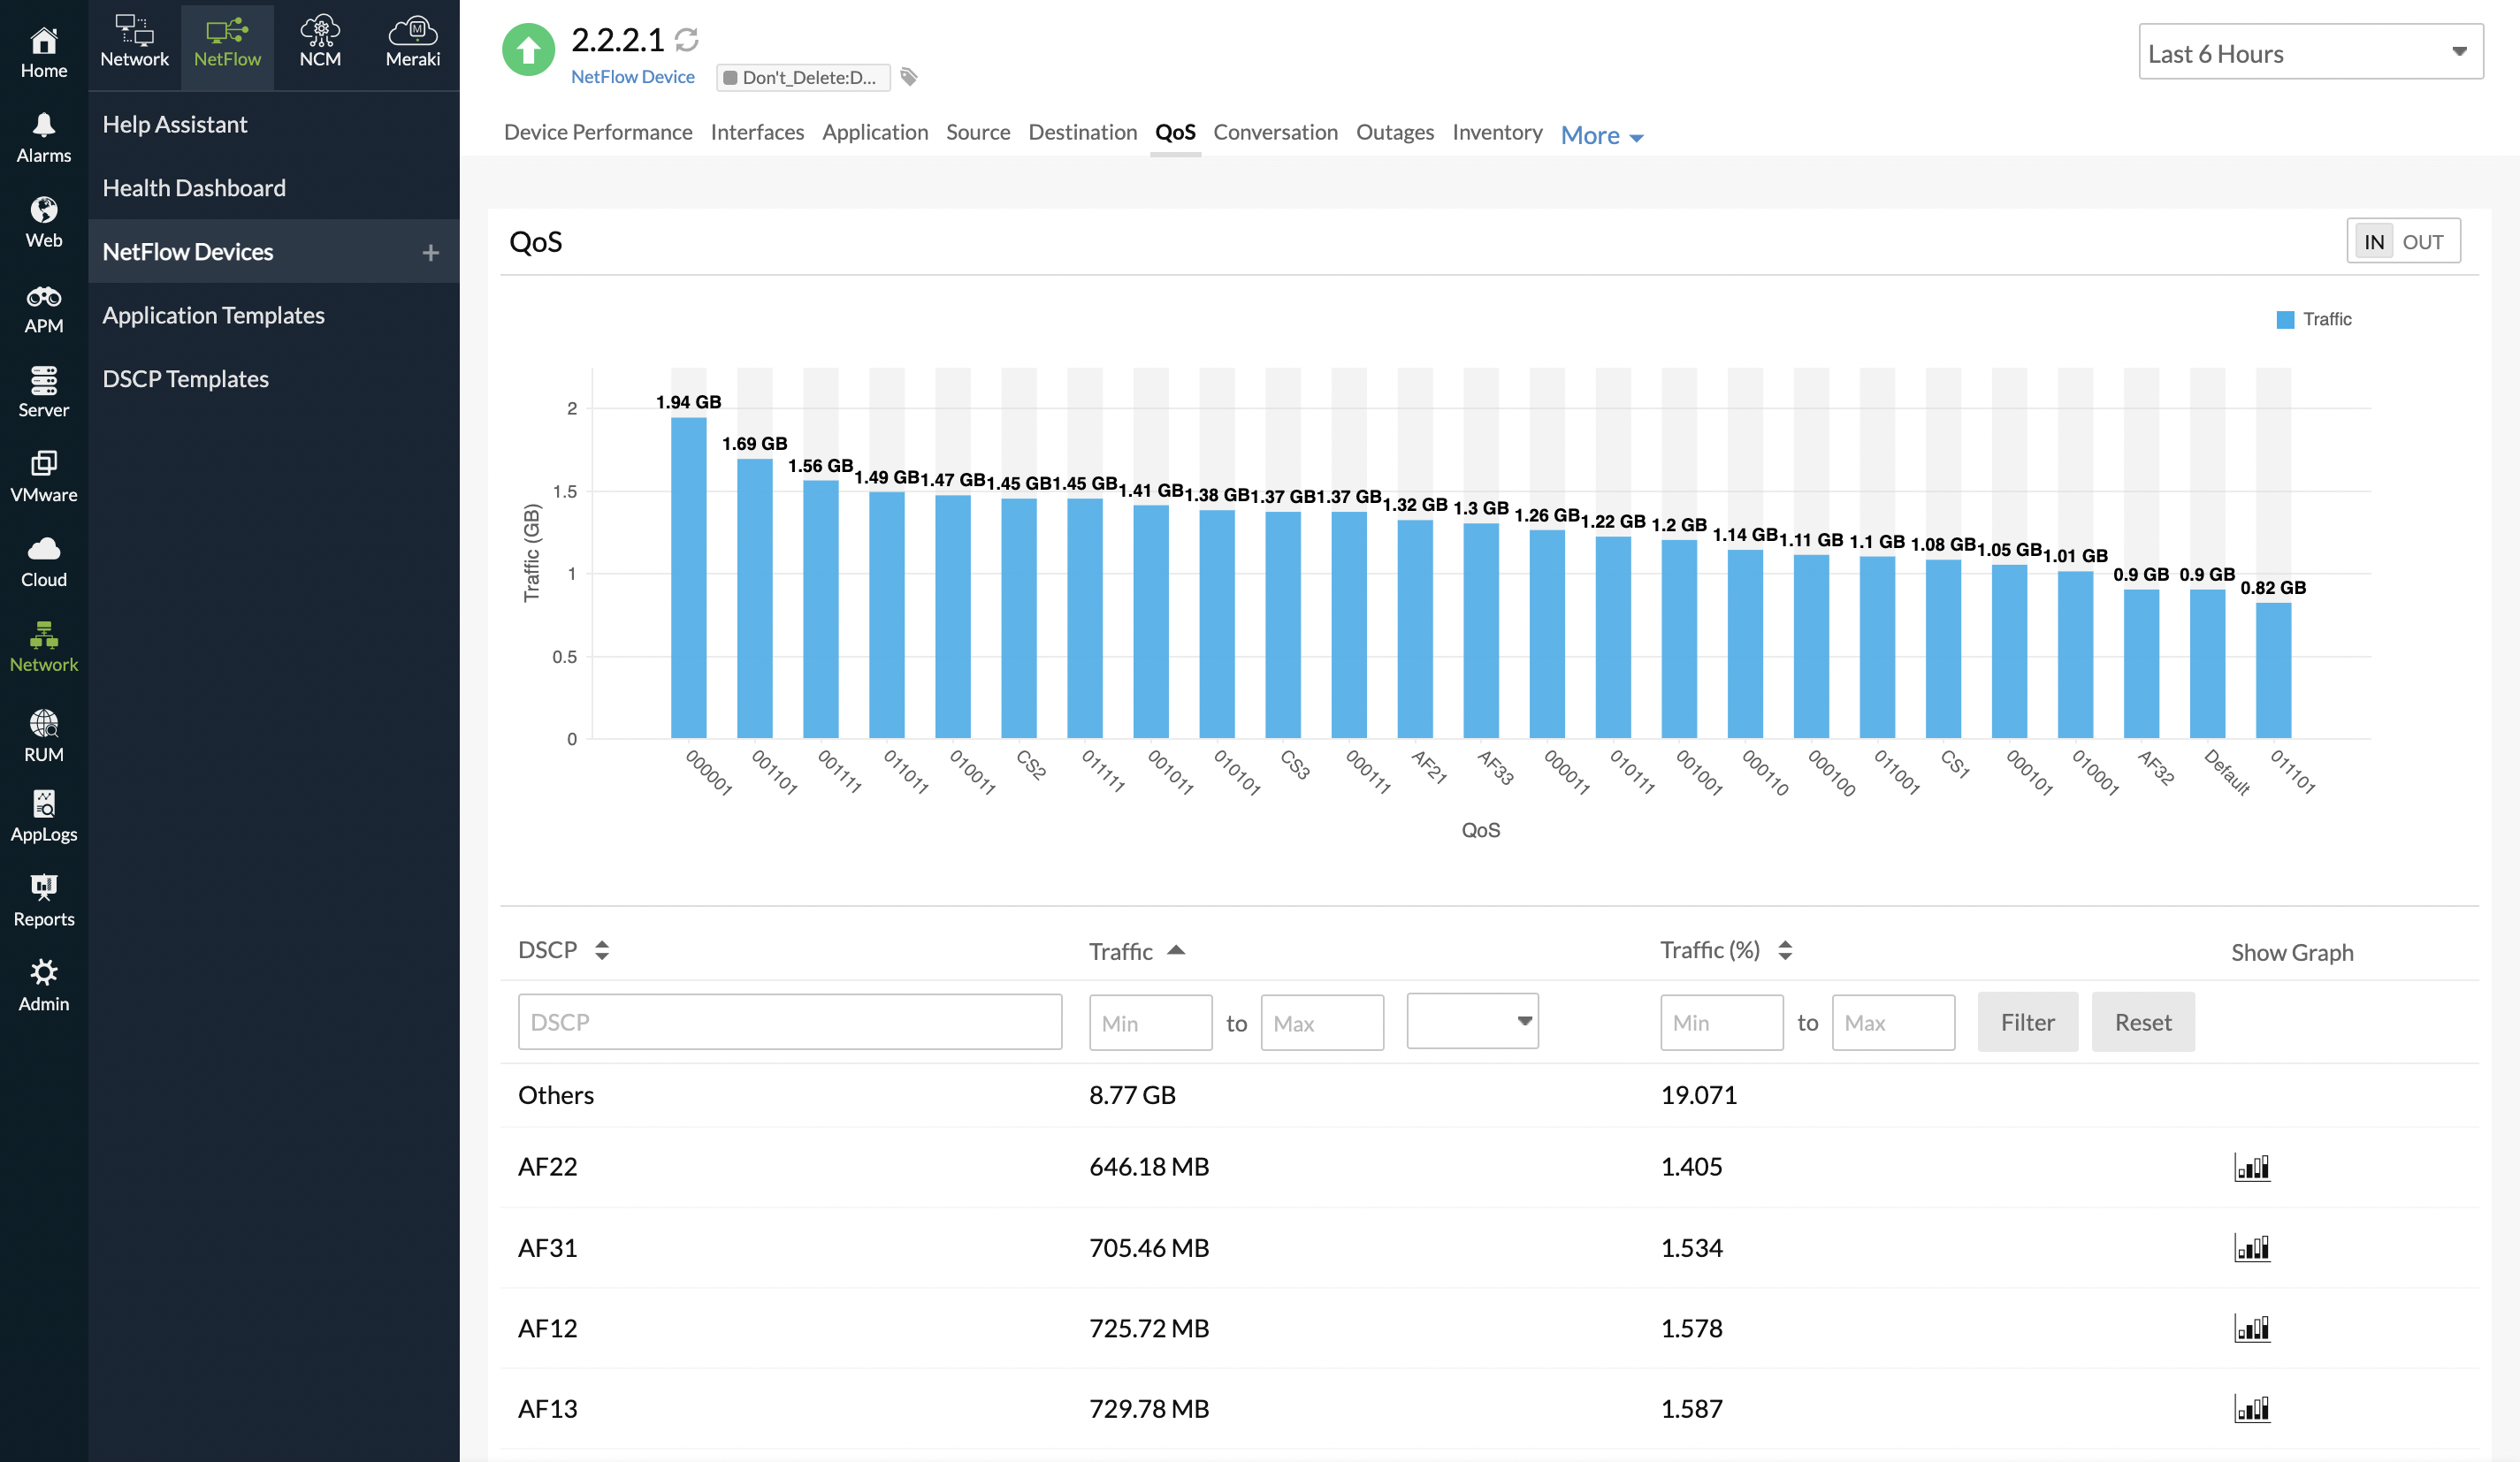
View the amount of traffic that has flowed through a DSCP template. This data includes traffic through a particular application and port, both at the device level and interface level. You can obtain the traffic as both volume (Traffic) and percentage of traffic (Traffic %) that has flowed. Additionally, you can filter the traffic according to a specific range by providing values for the Min and Max fields (minimum and maximum traffic volume). You can also filter according to the DSCP template name.
Click the graph ![]() icon in the Show Graph column to view the data as a graph for each DSCP template.
icon in the Show Graph column to view the data as a graph for each DSCP template.
Toggle between the IN and OUT buttons in the right corner to view the In and Out Traffic stats, respectively.

Figure 1. Viewing QoS metrics.
Related Articles
-
On this page
- Navigating to the QoS tab
- QoS metrics
