Health Trend Report
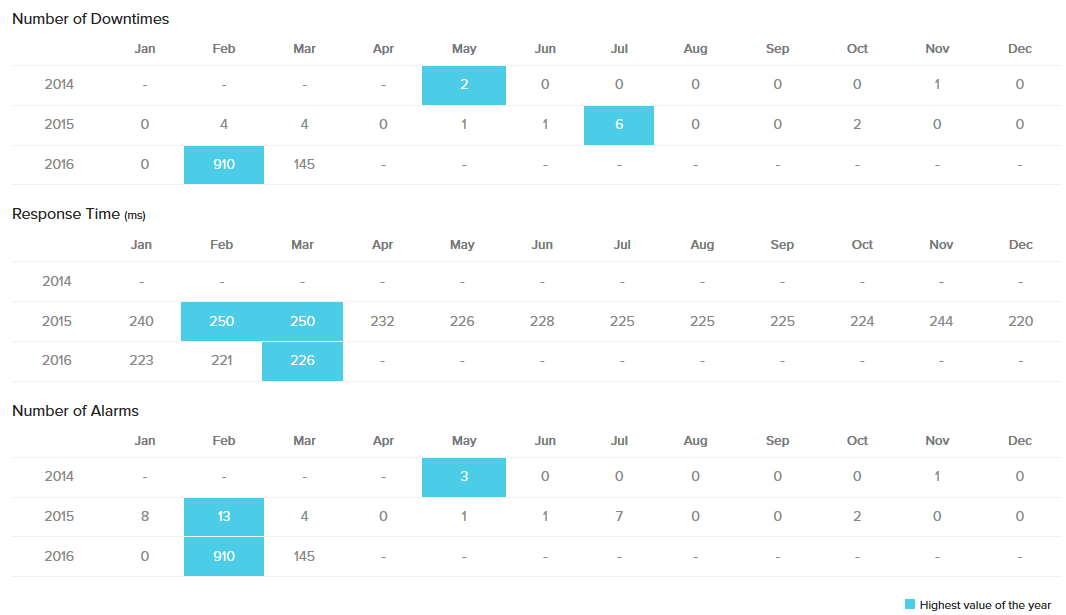
Health Trend Report provides the availability trend of your configured monitors or monitors associated with the tag, from the time it is initially set up. This report gives you a historical insight into how a resource has performed from inception, including a tabular interpretation of the exact count of downtimes, response time, longest transaction time percentage, private bytes, down alarms triggered by the monitors, and much more.
Generate Health Trend Report
- Login to Site24x7.
- Navigate to Reports > Monitor Type > Health Trend Report.
Note
You can either generate a Health Trend Report for a selected monitor or a consolidated report for all the monitors.
- Select required Monitor/Tag from the header drop-down.
- Once the report is generated, you can click "Share This" button on the top right corner to:
- Publish Report: Click publish report and populate the form. This creates a permalink that would make the report accessible to customers without a login.
- Email: Share the report via an email. Email can be sent to only those verified users who have agreed to receive emails from Site24x7.
- Export CSV: Export the report as a CSV file.
- Export PDF: Export the report as a PDF file.
Interpret Health Trend Report
For every configured monitor, numerous parameters are tracked from its inception and then presented in a tabular layout. The month with the highest count during the entire year is highlighted in blue. All the captures parameters are discussed below.

Additional Parameters Captured
| Parameter | Description |
| Number of Downtimes | The specific count of downtime encountered by the monitor, each month from its inception is captured and then presented in a tabular layout. The month with the highest downtime count is highlighted in red. |
| Response Time | Average response times (ms) recorded by the monitor are captured in a table. The month with the highest response time is highlighted in red. |
| Number of Alarms | Alarms are triggered whenever the monitors are in down or trouble state. This cumulative data is then captured and showcased in a tabular format showing the monthly count of trouble and down alarms triggered by the monitors from the time of its creation. The month with the highest reported alarms is highlighted in red. |
| Longest Transaction Time (%) | Longest Transaction Time percentage recorded by the monitor are captured and presented in a table. The month with the highest transaction time is highlighted in red. |
| Private bytes (KB/sec) | Private Bytes is the current size, in bytes, of memory that a specific process has allocated that cannot be shared with other processes. |
| Datastore (%) | Get visibility into your VMware VM datastore freespace. |
| Read Latency (%) | The average amount of time taken per disk read operation is captured and presented in a table. The month with the highest read latency is highlighted in red. |
| CPU (%) | CPU utilization percentage recorded by the monitor are captured and presented in a table. The month with the highest CPU utilization time is highlighted in red. |
| Transaction Time (ms) | Transaction time (ms) recorded by the monitor are captured and presented in a table. The month with the highest transaction time is highlighted in red. |
| Step Time (ms) | The step time refers to the time taken to complete an individual action or step in a synthetic transaction. |
| Global CPU core (%) | Performance per CPU core is recorded by the monitor and presented in a table. The month with the least CPU core percentage is highlighted in red. |
View related reports
