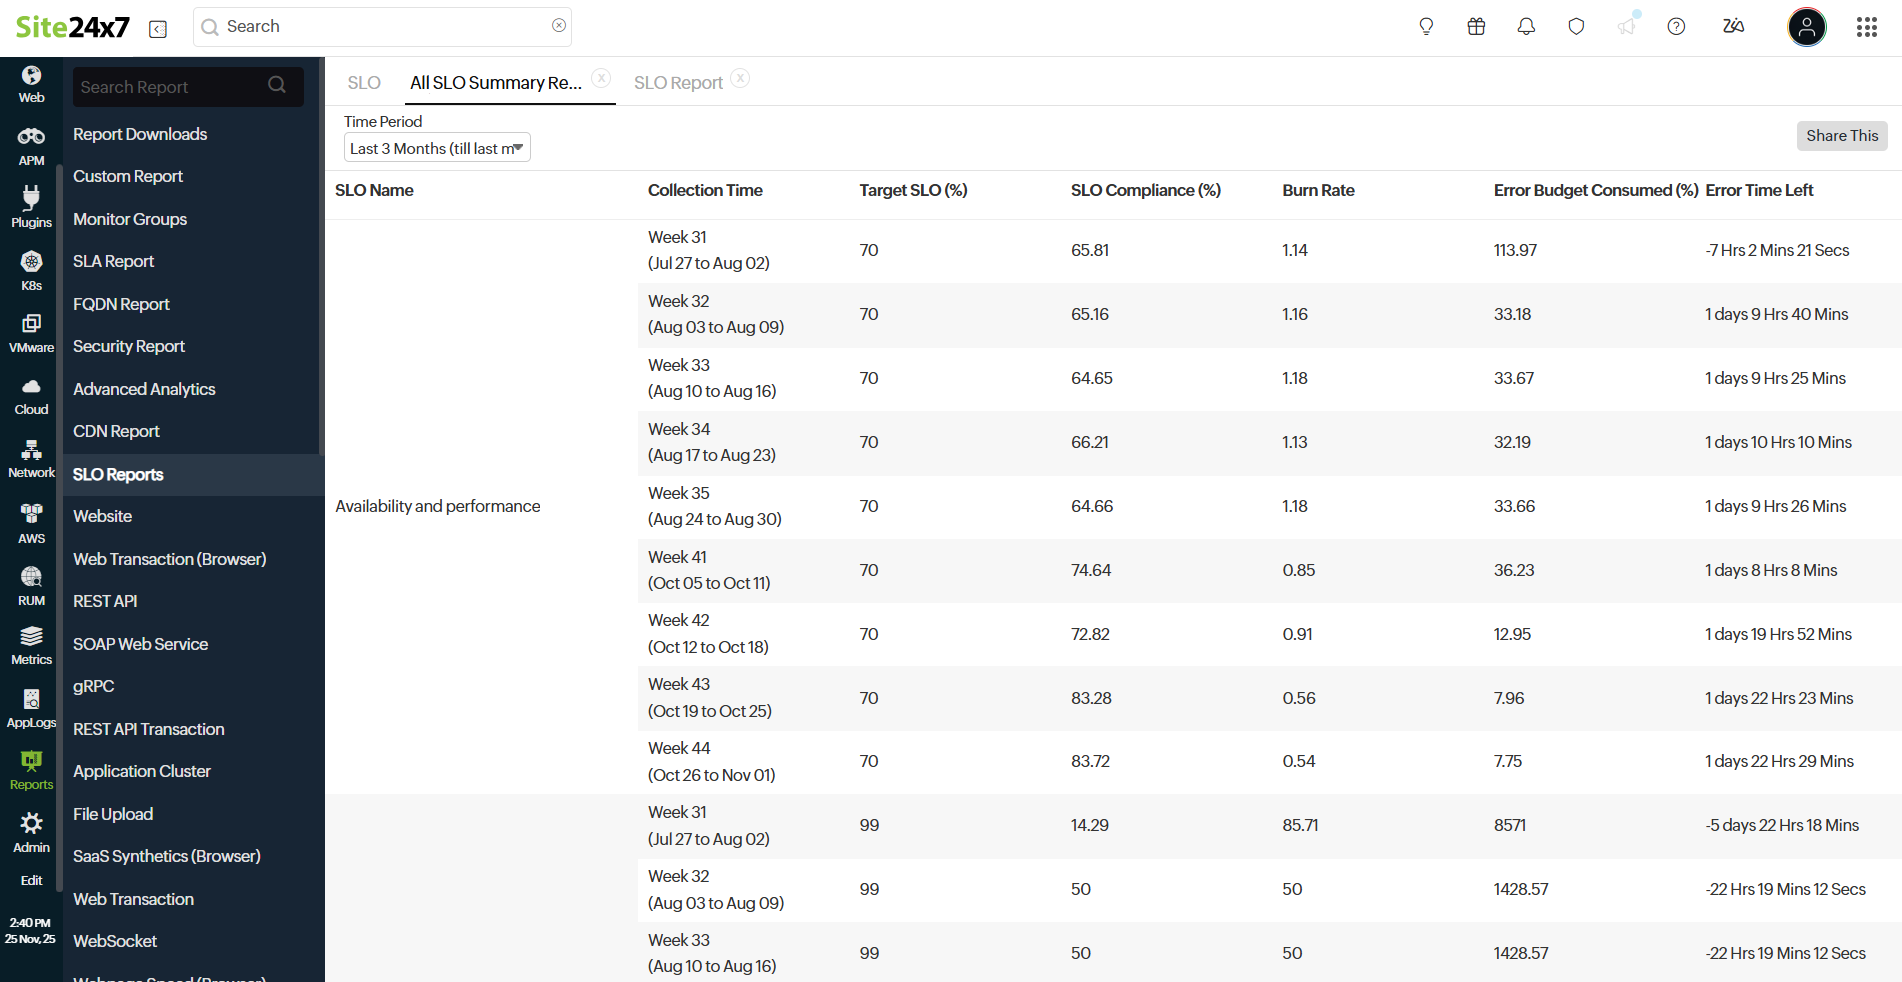
All SLO Summary Report
Our All SLO Summary Report helps site reliability engineers manage SLOs and track trends across the account. This report provides comprehensive SLO details, including Monitor Name, Burn Rate, error budget consumed, Error Time Left, SLO Compliance (%), and Target SLO (%).
Generate an All SLO Summary Report
Follow the steps below to generate the All SLO Summary Report:
- Log in to your Site24x7 account.
- Navigate to Reports > SLO Reports > All SLO Summary Report.
- Choose the Time Period from the drop-down list.
- Get the metrics of all the SLOs available.

Interpret the All SLO Summary Report
Understand and analyze the All SLO Summary Report for insights into service performance and compliance.
The following details can be inferred from the report:
- SLO Name: The name that uniquely identifies the SLO.
- Collection Time: The specific time period (week and date range) during which data for the SLO was collected.
- Target SLO (%): The predefined performance or availability goal that a service aims to achieve within a specific period.
- SLO Compliance (%): The percentage of time a service has met its defined SLO within a given period.
SLO compliance (%) = (good events / total events) * 100
- Burn Rate: The speed at which the error budget is being consumed for the SLO.
- Error Budget Consumed (%): The percentage of allowable downtime that has been used.
- Error Time Left: The remaining allowable downtime before breaching the SLO.
The Share This button allows you to share the report via email or download it as a CSV or PDF file.
